This repo needs a maintainer, if you want to take it over open an issue.
This is the readme for v2, if you are using v1 you want to look at the v1 readme
This extension creates a twig function that takes a number of values and creates a google map via the v3 Google Maps API. You can pass in simple values, a single geolocation object, an array of geolocation objects, a record or multiple records.
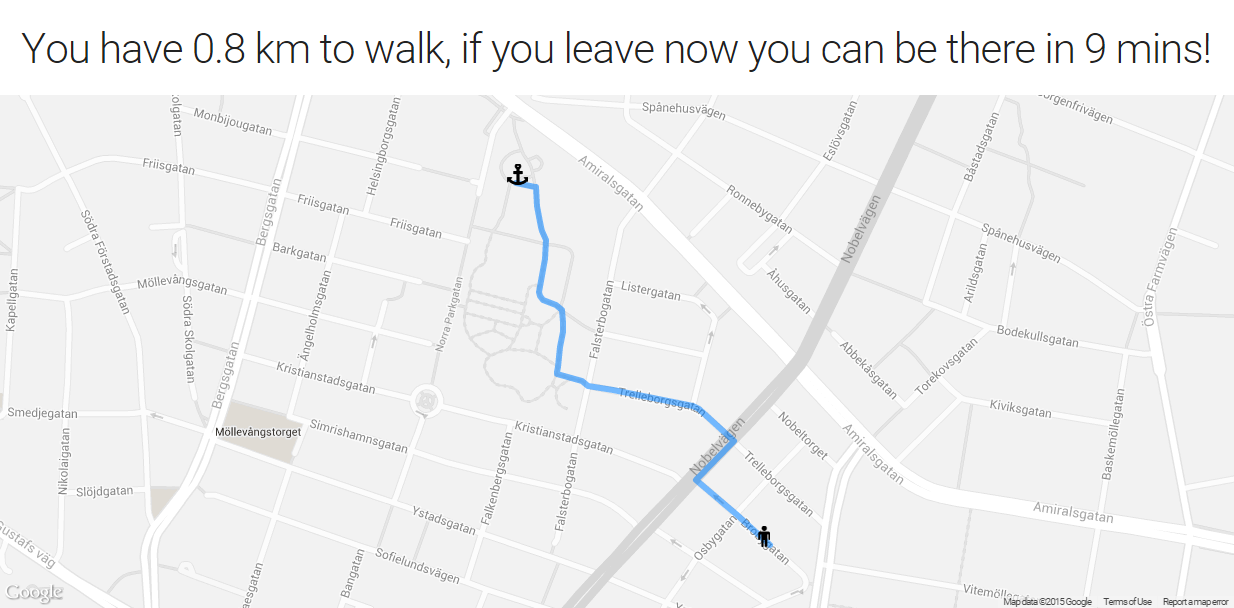
Example with Mapstyles, Geolocation and using optional parameters to output the distance and the time to get to a marker:
The icon fields are compatible with Raistlfiren/FAIconFieldType and
the color fields are compatible with boltabandoned/bootstrapcolorpicker.
The map has no set height by default. This is because it is often
used in situations where no height should be set (like in a flex
grid). In your css just enter .map-canvas{height:50vh} or
whatever height you want.
I recommend that you install those if non-techies will update those fields.
A simple map is usually constructed with named values passed to the map() function, like this:
{{map(
    latitude = record.geolocation.latitude,
    longitude = record.geolocation.longitude,
    html = record.body,
    icon = "fa-map-marker"
)}}
You can also supply it with the bolt geolocation object directly like this:
{{map( map = record.map )}}
You can set the HTML for the infopopup via the html argument. The default
is the formatted_address of the geolocation field. You can also set the map
icon with the icon argument:
{{map(
    map = record.map,
    html = record.body,
    icon = "fa-map-marker"
)}}
Multiple geolocation objects also work, which is useful for when you build a map from multiple contenttypes:
{% set maps = [] %}
{% for record in records %}
    {% set maps = maps|merge([record.geolocation]) %}
{% endfor %}
{{map( maps = maps )}}
You can also pass a single record, which will assume that your geolocation field
is called geolocation, your html field is called body, your icon field is
called icon and your color field is called color.
{{map( record = record )}}
You can change where it looks for these values by following this example:
{{map(
    record = record,
    geolocation-field = "geolocation",
    html_field = "body",
    icon_field = "icon",
    color_field = "color"
)}}
The values passed are the names of the fields you want to use for the respective property.
Just like passing a record you can also pass multiple records to the function. Just like in the previous example you can change which fields it looks for by passing additional arguments.
{{map( records = records )}}
And overwriting what values to use also works just like a single record:
{{map(
    records = records,
    geolocation_field = "geolocation",
    html_field = "body",
    icon_field = "icon",
    color_field = "color"
)}}
If you set geolocation = true it will try to get the visitors position and plot a route
from them to the closest marker. The map is rendered first without geolocation, and then
with the directions after the visitor has accepted to share his or her location.
{{map(
    record = record,
    geolocation = true
)}}
If you supply it with duration_holder and distance_holder it will output the trip duration and it's distance to them after the route is plotted. You can use this to display route information to the visitor. duration_holder and distance_holder take any valid selector.
<p>
You have <span id="distance_holder"></span> to walk,
if you leave now you can be there in <span id="duration_holder"></span>!
</p>

{{map(
    record = record,
    geolocation = true,
    duration_holder = "#duration_holder",
    distance_holder = "#distance_holder",
    travel_mode = "walking"
)}}
By default the map will not allow for zooming, scrolling or panning. You can change this by passing an options array, which will set the the mapoptions. See here for a reference: https://developers.google.com/maps/documentation/javascript/reference?hl=en#MapOptions
{{map(
    record = record,
    google_options = {
        scrollwheel: true,
        navigationControl: true,
        mapTypeControl: true,
        scaleControl: true,
        draggable: true,
        disableDefaultUI: false
    }
)}}
The JS has a couple of calls that you can implement to modify the data or appearace of the map. This an example of the JS options:
window.mapjs = {
    //Zoom level when there is only one marker
    defaultzoom: 16,
    //Mapstyles to be applied to the map. See http://www.mapstylr.com/ or https://snazzymaps.com/ for examples.
    mapstyles: "",
    //Called before initizialization of the JS
    beforeInit: function(){},
    //Called before rendering of each map. Passed the element, which contains all data for the map and is the DOM element it will be drawn to.
    beforeRender: function(element){},
    //Called after rendering of each map. Also passed the element.
    afterRender: function(element){},
    //Called before geolocation is attempted for each map. Also passed the element.
    beforeGeoloc: function(element){},
    //Called after geolocation is done for each map. Also passed the element.
    afterGeoloc: function(element){},
    //Called before directions are attempted for each map. Also passed the element.
    beforeDirections: function(element){},
    //Called after directions are rendered and done for each map. Also passed the element.
    afterDirections: function(element){}
}
Almost every value and object used is a property of the element object which is supplied by these methods or can be fetched by querying the dom for your map. You can change these as you want before rendering or in the methods.
- If you put the
disable_script_injecting: truein the global config the extension will not load it's usual scripts and styles. This is useful for when you want to include them in your own scripts and styles, load them via a cdn or modify them. - The scripts have no external dependencies except the Google Maps API.
- You can use leaflet instead of Google Maps by setting
disable_script_injecting: true, including leaflet and putting the below script in your JS:
Array.prototype.forEach.call(document.getElementsByClassName("map-canvas"), function (elem) {
var places = JSON.parse(elem.dataset.mapobj);
var center = L.latLngBounds([places[0].latitude, places[0].longitude], [places[1].latitude, places[1].longitude]);
places.forEach(function(place){
center.extend([ place.latitude, place.longitude ]);
})
var map = L.map(elem, {
scrollWheelZoom: false,
center: center.getCenter(),
layers: [L.tileLayer('/tileserver{s}/light_all/{z}/{x}/{y}.png', {
attribution: '© <a href="http://www.openstreetmap.org/copyright">OpenStreetMap</a> contributors, © <a href="http://cartodb.com/attributions">CartoDB</a>'
})],
zoom: 11
}).fitBounds(center);
places.forEach(function(place){
var cssIcon = L.divIcon({
className: typeof place.icon == "string" ? 'fa ' + place.icon : 'fa fa-taxi',
iconSize: typeof place.iconSize == "array" ? place.icon : [20, 37]
});
L.Icon.Default.imagePath = '/cssmodules/images';
L.marker(
[ place.latitude, place.longitude ],
{ icon: cssIcon }
).bindPopup(
L.popup()
.setContent(place.html)
).addTo(map);
})
map.fitBounds(center);
});
This example assumes that you proxy the tiles on your server (a good idea if you are using http2), so you need to add the following to your nginx config (of course tweak these settings to fit your need, these are for cartodb maps):
# In your http block:
proxy_cache_path /var/www/osm_cache levels=1:2 keys_zone=openstreetmap-backend-cache:512m max_size=5000m inactive=365d use_temp_path=on;
proxy_temp_path /var/www/osm_cache/tmp;
proxy_cache_revalidate off;
proxy_request_buffering off;
upstream openstreetmap_backend {
    server cartodb-basemaps-a.global.ssl.fastly.net;
    server cartodb-basemaps-b.global.ssl.fastly.net;
    server cartodb-basemaps-c.global.ssl.fastly.net;
    server cartodb-basemaps-d.global.ssl.fastly.net;
}

# In your server block
location ^~ /tileserver {
    rewrite ^/tileserver([a-z])(/.*)$ $2 break;
    proxy_pass  https://cartodb-basemaps-a.global.ssl.fastly.net;
    proxy_set_header X-Real-IP $remote_addr;
    proxy_set_header X-Forwarded-For $proxy_add_x_forwarded_for;
    proxy_set_header X-Forwarded-Proto https;
    add_header X-Cache-Status $upstream_cache_status;
    proxy_cache_revalidate off;
    proxy_ignore_headers X-Accel-Expires Expires Cache-Control Set-Cookie Vary;
    proxy_cache_use_stale error timeout http_500 http_502 http_503 http_504;
    proxy_cache openstreetmap-backend-cache;
    proxy_redirect off;
    proxy_cache_key $uri;
    proxy_cache_valid 365d;
    expires 365d;
    etag off;
    proxy_hide_header Set-Cookie;
    proxy_hide_header ETag;
}
Fontawesome license:
License - http://fontawesome.io/license (Font: SIL OFL 1.1, CSS: MIT License)
Markerwithlabel license:
@name MarkerWithLabel for V3
@version 1.1.10 [April 8, 2014]
@author Gary Little (inspired by code from Marc Ridey of Google).
@copyright Copyright 2012 Gary Little [gary at luxcentral.com]
Licensed under the Apache License, Version 2.0 (the "License");
you may not use this file except in compliance with the License.
You may obtain a copy of the License at
http://www.apache.org/licenses/LICENSE-2.0
Unless required by applicable law or agreed to in writing, software
distributed under the License is distributed on an "AS IS" BASIS,
WITHOUT WARRANTIES OR CONDITIONS OF ANY KIND, either express or implied.
See the License for the specific language governing permissions and
limitations under the License.
Everything not covered by these licenses is under GPLv3, copyright Alan Smithee.