Last update: 02/10/2020
This project originated from work on the Canada Warbler International Conservation Initiative (CWICI) towards a full life-cycle conservation plan. The preparation of these maps was contributed to in part by Environment and Climate Change Canada (ECCC) with a contract to High Branch Conservation Services. We thank the fifteen conservation, wildlife, and forestry professionals from six regions (provinces and states) who provided their opinions on the development of modelling scenarios via an expert survey. We also thank the Boreal Avian Modelling Project for data hosting and modelling support.
This work is published in several locations:
Westwood, AR, Lambert, JD, Reitsma, LR, Stralberg D. 2020. Prioritizing areas for land conservation and forest management planning for the threatened Canada Warbler (Cardellina canadensis) in the Atlantic Northern Forest of Canada. Diversity, 12(2): 61. https://doi.org/10.3390/d12020061
Two prior reports relating to this work have been published, including one on habitat management guidelines for the Canada Warbler and prioritizing areas for conservation and management for the Canada Warbler.
This github repository includes data and code only: Please refer to the paper and reports for explanations of variables, interpretations, and updates. The methodology on this page is that used in Westwood et al. 2020 Diversity. The methodology used in the report can be found [here] (/High Branch Conservation Reports/CAWA BCR14 Zonation report - metadata and workflow).
Project collaborators:
Alana Westwood, corresponding author (alana.westwood@hotmail.com)
Dan Lambert
Len Reitsma
Diana Stralberg
This process log refers to steps applied using the program Zonation, whose core, user manuals, and supporting documents can be downloaded for free at https://github.com/cbig/zonation-core.
All data layers were assembled using ArcGIS 10.3 in a common geodatabase (not included in data package). All input data layers can be found at /data
Environments for all rasters were set to a common extent (sdm.tif) and snap raster, exported at a resolution of 1 km2 with no data values = -9999. Zeroes were assigned as nodata. ArcGIS tools are indicated using ' '
| Data layer | Layer description | Layer creation steps | Pre-processing for Zonation | Original data ownership and source |
|---|---|---|---|---|
| BCR14_mask.tif | Canadian portion of Bird Conservation Region (BCR) 14 | Clipped the international BCR14 polygon layer to the extent of BCR14, then to the boundaries of Canada. 2 km buffer was added to the perimeter to account for cross-border data (if available) and discrepancies with georeferencing alignment between datasets. Field code added and all land mass coded as 1 | 'Feature to raster' | North American Bird Conservation Initiative |
| protected.tif | National, provincial, and privately protected areas ranked as IUCN category I-IV recorded in the CARTS Conservation Areas Reporting and Tracking System (CARTS) geodatabase | Added field to attribute table and coded all protected areas as "1" | 'Feature to raster' | CARTS 2015 |
| tenures.tif | Extent of areas owned or leased (on Crown land) by forestry companies for industrial harvesting as identified by Global Forest Watch (GFW) | Isolated forestry tenures by category and merged. Added attribute field and coded all forestry tenures polygons = 1 | 'Feature to raster' | Global Forest Watch Canada |
| ssi_CAWA2005.txt | Known locations of Canada Warblers (CAWA) 2005-2009 | On the BAM dataset of CAWA presence locations, used 'select by attribute' (all points 2005-2009) and on this set, 'select by location' (all points in BCR14). Exported as new layer and merged all points. Calculated new X and Y values and deleted points with identical values. Added field and coded as 1. | 'Feature to raster' | BAM |
| ssi_CAWA2010.txt | Known locations of Canada Warblers (CAWA) 2010-2015 | On the BAM dataset of CAWA presence locations, used 'select by attribute' (all points 2010-2015) and on this set, 'select by location' (all points in BCR14). Exported as new layer and merged all points. Calculated new X and Y values and deleted points with identical values. Added field and coded as 1. | 'Feature to raster' | BAM |
| clm_current.tif | Species distribution model (SDM) of mean projected population density of Canada Warbler based on climate variables in 2014 by Stralberg et al. (2014) | 'Extract by mask' to clip SDM to BCR14 Extent. 'Reclassify'used to rescale values from 1-100 | 'Feature to raster' | BAM |
| clm_2050.tif | Species distribution model (SDM) of mean projected population density of Canada Warbler based on climate variables in 2050 by Stralberg et al. (2014) | 'Extract by mask' to clip SDM to BCR14 Extent. 'Reclassify'used to rescale values from 1-100 | Raster data exported | BAM |
| sdm.tif | Median CAWA population density modelled by Haché et al. (in review) | Clipped SDM to extent of BCR14 | When exporting to raster, set to extent of BCR14 Canada but added one row of nodata to all 4 sides of raster square | BAM |
| uncertainty.tif | Standard deviation of CAWA population density modelled by Haché et al. (in review) | Clipped SDM to extent of BCR14 | Raster data exported | BAM |
| uplands.tif | Uplands as defined by the Northeastern Habitat Types (Anderson et al. 2013) common classification for ecosystems and habitats | 'Extract by attributes' for class 'wetlands', 'Reclassify' with formula uplands = 1, 'Extract by mask' to extent of BCR 14 | Raster data exported | The Nature Conservancy - Eastern Conservation Science |
| wetlands.tif | Wetlands as defined by the Northeastern Habitat Types (Anderson et al. 2013) common classification for ecosystems and habitats | 'Extract by attributes' for class 'wetlands', 'Reclassify' with formula wetlands = 1, 'Extract by mask' to extent of BCR 14 | Raster data exported | The Nature Conservancy - Eastern Conservation Science |
Steps completed in Zonation 4.0.
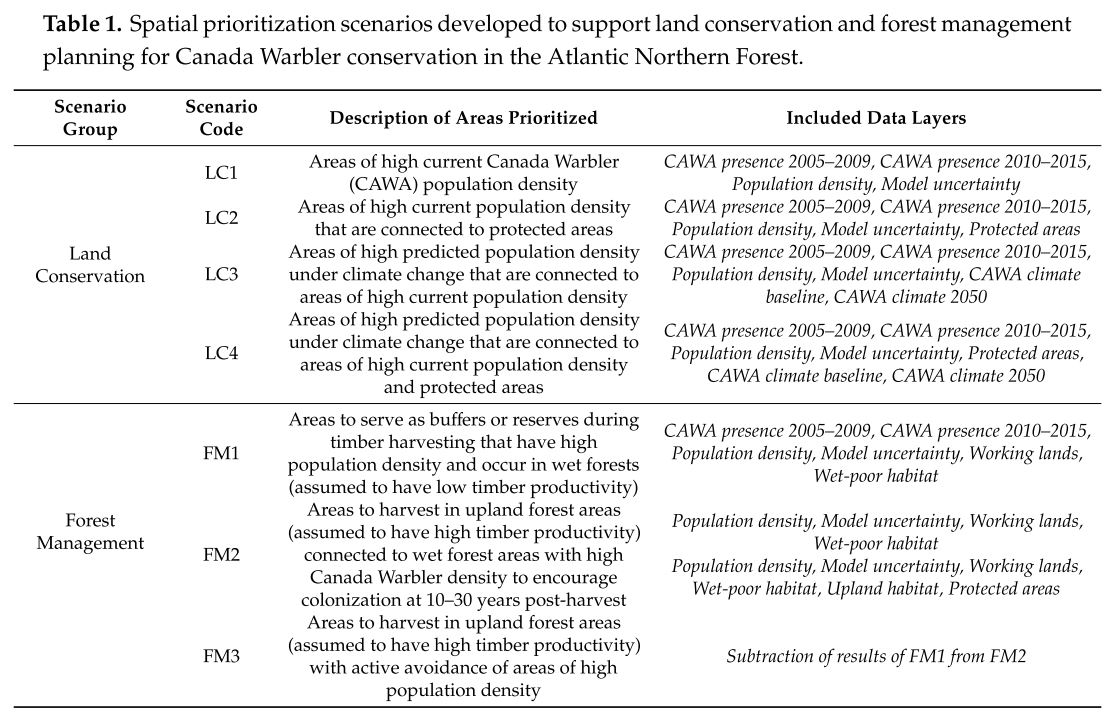
Six models were completed (Table 1), each at one of three dispersal distances: low (LDD = 5 km), medium (MDD = 10 km), and high (HDD = 50 km). The first model (LC1) was built in steps to evaluate the impact of each additive function.
Intermediate analyses, adding components iteratively to catch compare effects of each component
- LC1LDD_caz
- LC1LDD_caz_cnd
- LC1LDD_caz_cnd_dbs
- LC1LDD_caz_cnd_dbs_ssi
- LC1LDD_caz_cnd_dbs_ssi_unc
- LC1MDD_caz_cnd_dbs_ssi_unc
- LC1HDD_caz_cnd_dbs_ssi_unc
- LC2LDD_LC1_mtx
- LC2MDD_LC1_mtx
- LC2HDD_LC1_mtx
- LC3LDD_LC1_clm
- LC3MDD_LC1_clm
- LC3HDD_LC1_clm
- FM1LDD_adm_mtx
- FM1MDD_adm_mtx
- FM1HDD_adm_mtx
- FM2LDD_caz_dbs_unc_adm_mtx_mtx2
- FM2MDD_caz_dbs_unc_adm_mtx_mtx2
- FM2HDD_caz_dbs_unc_adm_mtx_mtx2
- FM3LDD_FM2-FM1
- FM3MDD_FM2-FM1
- FM3HDD_FM2-FM1
Codes in the names are interpreted as follows:
| Code | Description |
|---|---|
| caz | Cell removal rule: core-area zonation |
| sdm | Input features: Species distribution model |
| cnd | Condition layer (anthropogenic disturbance) |
| dbs | Distribution smoothing |
| ssi | Input features: species of special interest (Canada Warbler locations 2005-2009 and 2010-2015) |
| unc | Uncertainty discounting (standard deviation of sdm) |
| mtx | Connectivity: matrix connectivity |
| clm | Connectivity: interaction connectivity (climate change) |
| adm | Administrative units |
Models are divided into two classes: Land Conservation (LC) and Forest Management (FM).
LC1LDD_caz - CAWA species distribution model (SDM) with core area zonation
LC1LDD_caz_cnd - CAWA SDM (CAZ) + condition layer at dispersal kernel α = 0.0004
LC1LDD_caz_cnd_dbs - SDM (CAZ) + condition + distribution smoothing at dispersal kernel α = 0.0004
LC1LDD_caz_cnd_dbs_ssi - SDM (CAZ) + condition + distribution smoothing + species of special interest (ssi) at dispersal kernel α = 0.0004
LC1LDD_caz_cnd_dbs_ssi_unc - SDM (CAZ) + condition + distribution smoothing + species of special interest (ssi) at dispersal kernel α = 0.0004
LC1MDD_caz_cnd_dbs_ssi_unc - SDM (CAZ) + condition + distribution smoothing + species of special interest (ssi) at dispersal kernel α = 0.0008
LC1HDD_caz_cnd_dbs_ssi_unc - SDM (CAZ) + condition + distribution smoothing + species of special interest (ssi) at dispersal kernel α = 0.004
LC2LDD_LC1_mtx - LC1 + matrix connectivity to protected areas at dispersal kernel α = 0.0004
LC2MDD_LC1_mtx - LC1 + matrix connectivity to protected areas at dispersal kernel α = 0.0002
LC2HDD_LC1_mtx - LC1 + matrix connectivity to protected areas at dispersal kernel α = 0.00004
LC3 - Areas of high predicted population density under climate change that are connected to areas of high current population density
LC3LDD_LC1_clm - LC1 + interaction connectivity (climate 2050) at dispersal kernel α = 0.0004 and interaction effect β = 0.000011
LC3MDD_LC1_clm - LC1 + interaction connectivity (climate 2050) at dispersal kernel α = 0.0002 and interaction effect β = 0.00000556
LC3HDD_LC1_clm - LC1 + interaction connectivity (climate 2050) at dispersal kernel α = 0.00004 and interaction effect β = 0.0000011
LC4 - Areas of high predicted population density under climate change that are connected to areas of high current population density and protected areas
LC4LDD_LC1_mtx_clm - LC1 + matrix connectivity to protected areas at dispersal kernel α = 0.0004 + interaction connectivity (climate 2050) at dispersal kernel α = 0.0004 and interaction effect β = 0.000011
LC4MDD_LC1_mtx_clm - LC1 + matrix connectivity to protected areas at dispersal kernel α = 0.0002 + interaction connectivity (climate 2050) at dispersal kernel α = 0.0002 and interaction effect β = 0.00000556
LC4HDD_LC1_mtx_clm - LC1 matrix connectivity to protected areas at dispersal kernel α = 0.00004 + interaction connectivity (climate 2050) at dispersal kernel α = 0.00004 and interaction effect β = 0.0000011
FM1 - Areas to serve as buffers or reserves during timber harvesting that have high population density and occur in wet forests (assumed to have low timber productivity)
FM1LDD_LC1_adm_mtx - LC1 + matrix connectivity to wet-poor habitats at dispersal kernel α = 0.0004 FM1LDD_LC1_adm_mtx - LC1 + matrix connectivity to wet-poor habitats at dispersal kernel α = 0.0002 FM1LDD_LC1_adm_mtx - LC1 + matrix connectivity to wet-poor habitats at dispersal kernel α = 0.00004
FM2 - Habitat management to steward future populaAreas to harvest in upland forest areas (assumed to have high timber productivity) connected to wet forest areas with high Canada Warbler density to encourage colonization at 10–30 years post-harvest
FM2LDD_caz_dbs_unc_adm_mtx_mtx2 - SDM (CAZ) + distribution smoothing + uncertainty + administrative units + negative matrix connectivity to wet-poor habitats + positive matrix connectivity to upland habitats at dispersal kernel α = 0.0004 FM2MDD_caz_dbs_unc_adm_mtx_mtx2 - SDM (CAZ) + distribution smoothing + uncertainty + administrative units + negative matrix connectivity to wet-poor habitats + positive matrix connectivity to upland habitats at dispersal kernel α = 0.0002 FM2HDD_caz_dbs_unc_adm_mtx_mtx2 - SDM (CAZ) + distribution smoothing + uncertainty + administrative units + negative matrix connectivity to wet-poor habitats + positive matrix connectivity to upland habitats at dispersal kernel α = 0.00004
FM3 - Areas to harvest in upland forest areas (assumed to have high timber productivity) with active avoidance of areas of high population density
Not completed in Zonation. Subtraction of raster surface resulting from FM1 from the result of FM2.
All run and output files are available in this database