This download provides a couple of Matlab functions for determining the degree and nature of collinearity in a regression matrix (also termed multicollinearity). Given a design matrix, the condition indices (ratio of largest singular value to each singular value), variance decomposition proportions, and variance inflation factors are returned. Belsley, Kuh, & Welsch [1] suggest a strategy for diagnosing degrading collinearity using the following conditions:
- A singular value judged with a large condition index, and which is associated with
- Large variance decomposition proportions for two or more covariates
The number of large condition indexes identifies the number of near dependencies among the columns of the design matrix. Large variance decomposition proportions identify covariates that are involved in the corresponding near dependency, and the magnitude of these proportions, in conjunction with the condition index, provides a measure of the degree to which the corresponding regression estimate has been degraded by the presence of collinearity. What is meant by "large" is not statistically precise, although numerical experiments by Belsley et al. indicate that the following ranges are useful:
| Condition index | Collinearity |
|---|---|
| 5 < CI < 10 | weak |
| 30 < CI < 100 | moderate to strong |
| CI > 100 | severe |
and where a pair (or more) of variance decomposition factors > 0.5 warrant inspection.
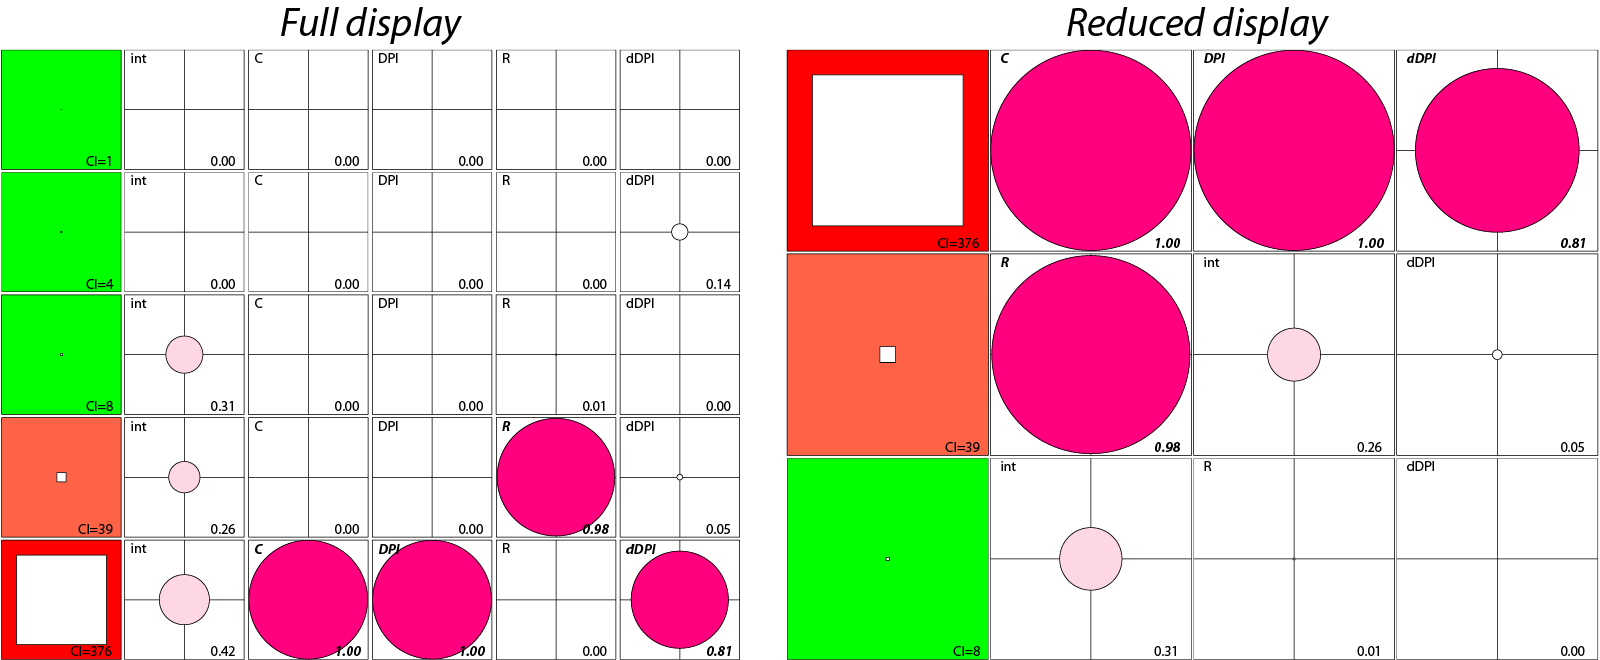
The main function prints a summary table to stdout when called without outputs, which may be sufficient to identify problems with smaller design matrices. For models with more covariates, I've included a function to make a collinearity tableplot [2], which allows one to more easily determine the degree of collinearity and pinpoint problematic covariates. More information about tableplots can be found at Michael Friendly's site, where he's posted R software for making these plots.
- Belsley, DA, Kuh, E, Welsch, RE (1980). Regression diagnostics: Identifying influential data and sources of collinearity. Wiley
- Friendly, M, Kwan, E (2009). Where's Waldo: Visualizing collinearity diagnostics. The American Statistician, 63(1):56-65
Install the functions under your Matlab path and have a look at demo_colldiag.m. The following will get you started right away:
>> info = colldiag(x); % calculate collinearity diagnostics on design matrix x [nSamples x nVariables]
>> disp(info.str) % print info to stdout
>> colldiag_tableplot(info); % collinearity tableplot
The following figure reproduces an example from section 3.4 of Belsley et al. [2] that uses consumption function data well-known to be ill-conditioned.
Copyright (c) 2014 Brian Lau brian.lau@upmc.fr, see LICENSE
tight_subplot is copyright Pekka Kumpulainen