Sensu is a monitoring system typically front-ended by Uchiwa.
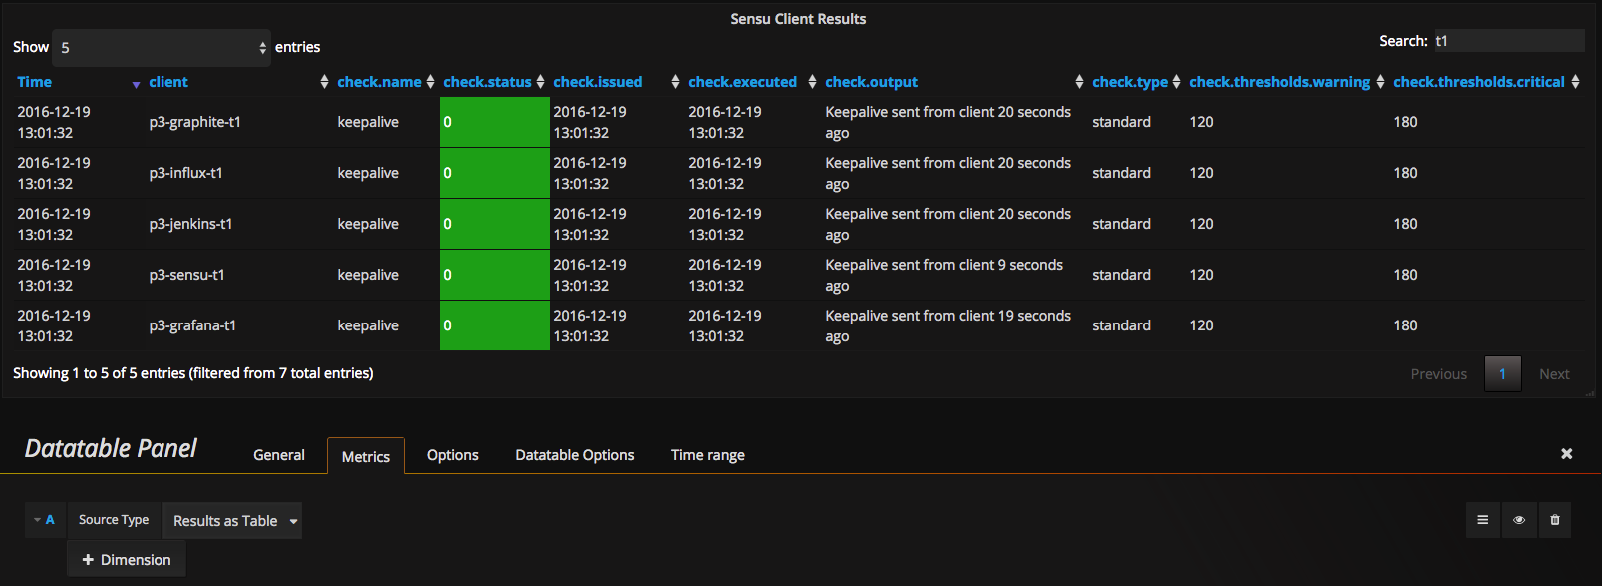
Screenshot of plugin with datatable panel:
Results can be return as a table or as JSON, this is the "table" data:
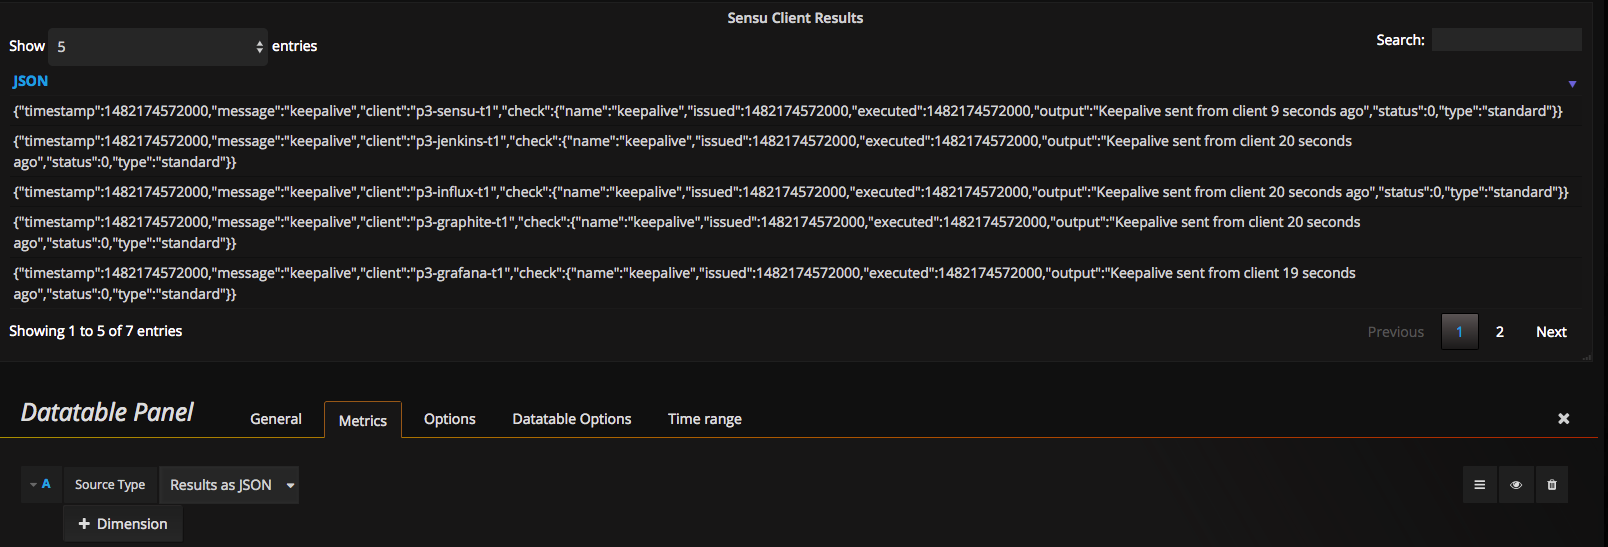
This is the JSON data:
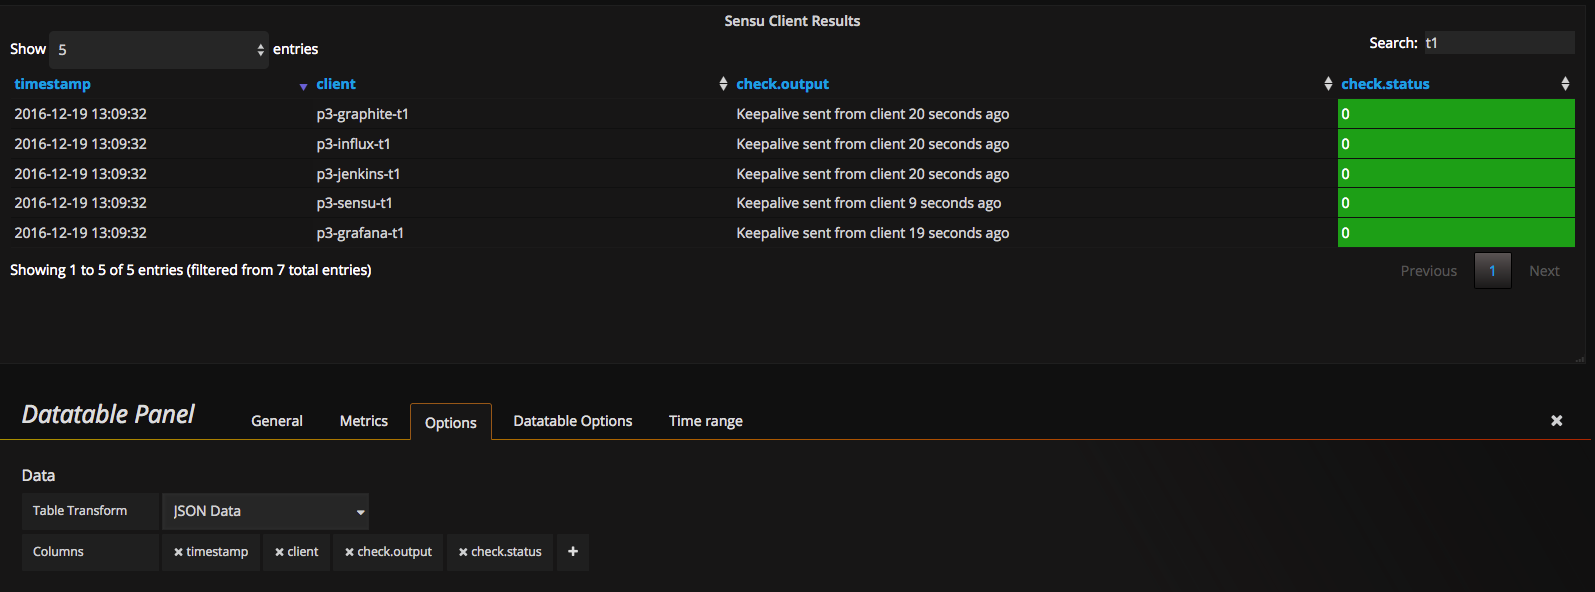
This is the same JSON data but will column selection:
Additional docs at github.io
This is a datasource plugin for integrating Grafana 3.x/4.x and Sensu. It provides a query builder to return data about Events, Results, Aggregates, and Clients.
The query builder provides hints for each type, with two optional dimensions "Client Name" and "Check Name".
A docker-compose.yml file is provided to easily stand up a Grafana 3.x server with this datasource mapped to the container.
- Copy/clone this repos into /var/lib/grafana/plugins
- Restarting
grafana-serveris required to pick up the plugin.
Once the plugin is "feature complete" a PR will be made to add this plugin to the official datasource plugins on Grafana.net
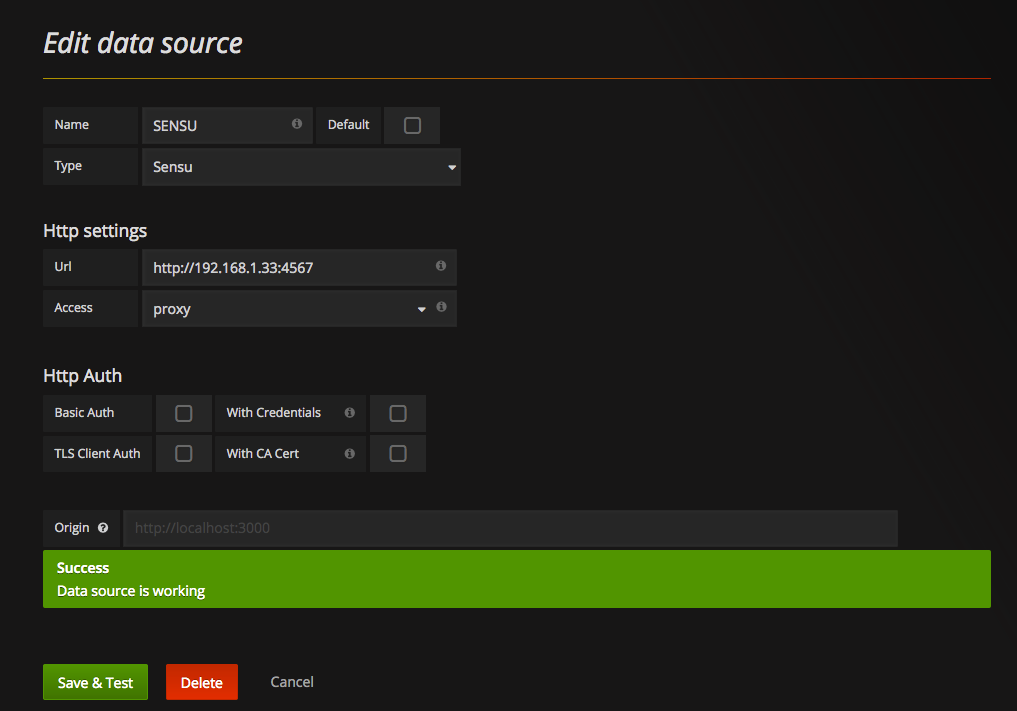
And and test datasource by setting the Url to the Sensu API, typically on port 4567.
Add a new "Table" to a dashboard and select the Sensu datasource. Choosing results, you will get a "dimensions" option to narrow the dataset.
There are 11 options for the datasource:
- Aggregates: Returns aggregate check states, with 7 different "modes"
- List
- Clients
- Checks
- Results Critical
- Results OK
- Results Unknown
- Results Warning
- Check Subscriptions: Returns list of checks associated with a subscription Dimensions
- name - name of check
- aggregate - name of aggregate
- type (metric|check)
- source - JIT client
- Clients
- Client History: Similar to Results, but with additional data
- NOTE: this is a deprecated API but still actively used by Uchiwa
- Events: Returns active events (alerts)
- Events as JSON: Returns active events (alerts)
- Results as JSON: Returns check results in JSON format
- Results as Table: Returns check results in Table format
- Sensu Health
- Silenced Entries
- Stashes
Choosing results, you will get a "dimensions" option to narrow the dataset.
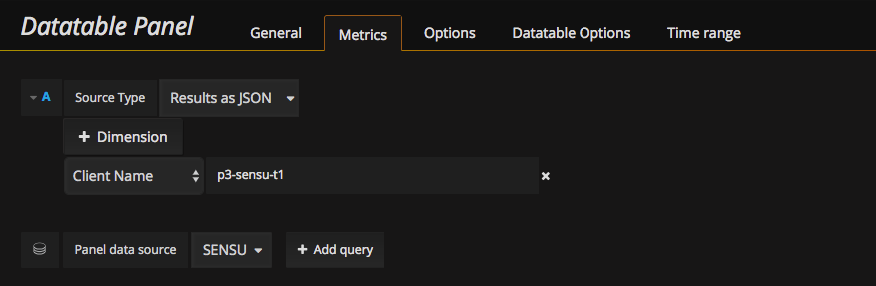 Select the textbox for metrics, and hints will be provided:
Support exists for using the following as template variables in Grafana:
- Clients
- Checks
- Aggregates
Here is an example configuration adding Client as a template variable:

Once added, you can reference the template variable as you would with any other Grafana datasource. Here is an example showing how to limit a table panel to show just the selected client:

ssh -i ~/.ssh/environment.pem -L 4567:localhost:4567 ec2-user@ec2-52-1-1-1.us-west-2.compute.amazonaws.com
More info about Sensu here.
source type: client history needs dimension: check_name filter and min/max/current/avg/total selector source type: aggregates, aggregate mode: list need dimension to pick aggregate field “checks/clients/crit/ok/stale/etc” and min/max/current/avg/total selector