npm install
npm install gulp --global
Install the index.html file found in _public to your Tableau Server
as a web data connector (but change the address for the javascript and
css files used to point to your local server).
After the web data connector is installed, open the test workbook in Tableau Desktop,
add the sipri-arms-by-seller-2006-2016.csv file found in app\sql as data source
and replace the existing data source with it, set the SanKey HTML page URL
parameter in the test workbook to point to the newly installed web data
connector. This allow the dashboard to load the web data connector to
the right side of the screen, which in turn forwards the requests to
your development server.
A detailed explanation of this installation process can be found in the Tableau JavaScript API without Embedding blog post.
gulp watch serveThis example connector uses the 2010-1016 slice of the SIPRI Arms Sales database to demonstrate how to draw SanKey diagrams from Tableau data using D3 and some JavaScript/CoffeeScript trickery.
Lets define a few functions first that allow us to connect to the tableau JS API in the dashboard frame while keeping line lengths sane (this process has been explained in detail in the Tableau JavaScript API without Embedding blog post).
# Quick accessors for accessing the tableau bits on the parent page
getTableau = ()-> parent.parent.tableau
getCurrentViz = ()-> getTableau().VizManager.getVizs()[0]

# Returns the current worksheet.
# The path to access the sheet is hardcoded for now.
getCurrentWorksheet = ()-> getCurrentViz().getWorkbook().getActiveSheet().getWorksheets()[0]
We also need to export our initializer function so it can be ran on document load:
@appApi = {
  initEditor
}Also lets declare a simple helper that wraps a function in a try/catch block, so any exceptions wont be swallowed by the JS Promise implementation used:
# Because handlers in promises swallow errors and
# the error callbacks for Promises/A are flaky,
# we simply use this function to wrap calls
errorWrapped = (context, fn)->
  (args...)->
    try
      fn(args...)
    catch err
console.error "Got error during '", context, "' : ", err.message, err.stackWe want to show a SanKey graph when the user selects a country on our
dashboard. To do this, we'll hook into the Tableau MARKS_SELECTION
event.
initEditor = ->

  # Get the tableau bits from the parent.
  tableau = getTableau()

  # Error handler in case getting the data fails in the Promise
  onDataLoadError = (err)->
    console.err("Error during Tableau Async request:", err)

  # Handler for loading and converting the tableau data to chart data
  onDataLoadOk = errorWrapped "Getting data from Tableau", (table)->
      # [...]

  # Handler that gets the selected data from tableau and sends it to the chart
  # display function
  updateEditor = ()->
    getCurrentWorksheet()
      .getUnderlyingDataAsync({maxRows: 0, ignoreSelection: false, includeAllColumns: true, ignoreAliases: true})
      .then(onDataLoadOk, onDataLoadError )

  ## Add an event listener for marks change events that simply loads the
  ## selected data to the chart
  getCurrentViz().addEventListener( tableau.TableauEventName.MARKS_SELECTION,  updateEditor)
Lets walk through the important bits of code from the back
getCurrentViz().addEventListener( tableau.TableauEventName.MARKS_SELECTION, updateEditor)This tells Tableau to call updateEditor on selecting anything on the dashboard.
  updateEditor = ()->
    getCurrentWorksheet()
      .getUnderlyingDataAsync({maxRows: 0, ignoreSelection: false, includeAllColumns: true, ignoreAliases: true})
      .then(onDataLoadOk, onDataLoadError )
We use the Tableau JS API to get the underlying data:
- we DO want all columns not just the displayed ones
- we DONT care about aliases, we dont use them in our workbook
- we DO only care about the data related to the selection
- we DO want ALL the data
getUnderlyingDataAsync() returns a Promise we need to handle, .then is the Promise way of saying:
- if the everything went OK, call
onDataLoadOkwith the loaded data - if anything failed, call
onDataLoadErrorwith the exception (where we simply log it to the console)
So lets assume that the request for the underlying data was successful and Tableau calls us back with the data. Its in Tableau's own format (an array of Tableau objects), so lets convert it to a native POD (plain old data) format.
Tableau needs column indices instead of column names, which is very uncomfortable and error prone, so lets do two little helper functions:
The first one takes a tableau table and a list of column names we are interested in and returns a javascript object where the keys are the field names we've given and the values are the field indices:
# Takes a table and returns a "COLUMN_NAME" => COLUMN_IDX map
getColumnIndexes = (table, required_keys)->
  # Create a column name -> idx map
  colIdxMaps = {}
  for c in table.getColumns()
    fn = c.getFieldName()
    if fn in required_keys
      colIdxMaps[fn] = c.getIndex()
  colIdxMaps
The second helper takes a Tableau Row object and the fieldname/index map
object returned by getColumnIndexes() and returns a POD javascript
object with the field names mapped to the values using _.mapObject():
# Takes a Tableau Row and a "COL_NAME" => COL_IDX map and returns
# a new object with the COL_NAME fields set to the corresponding values
convertRowToObject = (row, attrs_map)->
_.mapObject attrs_map, (id, name)-> row[id].valueLets write the first steps of the onDataLoadOk function using these
two helpers:
  # [...]
  onDataLoadOk = errorWrapped "Getting data from Tableau", (table)->
      # Decompose the ids
      col_indexes = getColumnIndexes(table, ["buyercod", "sellercod", "nrdel", "desc", "desig2", "delyears", "Pivot Field Names", "Pivot Field Values"])
      # conver the data
      data = (convertRowToObject(row, col_indexes) for row in table.getData())
Now we have a data in a format like:
[
  {buyercod: "AZR", sellercod: "USA", nrdel:12, ...},
  {buyercod:....},
  ...
]
SanKey needs data in the following format:
// Nodes:
[{name: "Node Name"}, ....]
// Links
[{source: 0, target: 1, value: 3}, ....]
So links use the indices in the nodes list to select the source and the target.
So we need to:
- find all unique seller/buyer names and create the nodes list
- for all transactions create a link using the names list created for the nodes list to look up the indices
makeSanKeyData = (rows)->

  # Get all names
  all_names = _.pluck(rows, "sellercod").concat( _.pluck(rows, "buyercod"))

  # Create the cache
  i = 0
  cache = {}
  for name in all_names
    unless cache.hasOwnProperty(name)
      cache[name] = i
      i++


  # Create the nodes list
  nodes = ({name: "#{name}", idx: idx}  for name, idx of cache)
  o = []
  for row, idx in rows
    value = parseFloat(row.nrdel)
    value = 0.0 if isNaN(value)
    o.push _.extend {source: cache[row.sellercod], target: cache[row.buyercod], value: value}, row

{ nodes: nodes, links: o }- first we combine the seller and buyer names into a single list.
- then create a cache object that maps node names to node ids
- using this cache object we can generate the node list data
- then for each transaction, look up the the seller and buyer ids and append them to the transaction data
- we combine the two into a single object and return that
Since 95% of the graph drawing code is identical to the D3 SanKey diagram example posted by Mike Bostock, and D3 can be a complicated beast to exmplain, we only look at the bits that are different (consider this a Tips & tricks section):
For our use-case there is a problem in the resolveCollisions() function in sankey.js because
it wants to push bottom and overlapping nodes that are out of bounds
back to the canvas.
For our use, we would like to have the ability to scroll the graph rather then shrink the nodes vertically to fit our target height.
    function resolveCollisions() {
      nodesByBreadth.forEach(function(nodes) {
        // [...]

        ///// THE FOLLOWING TWO STATEMENTS ARE THE PROBLEM FOR US:

        // If the bottommost node goes outside the bounds, push it back up.
        dy = y0 - nodePadding - size[1];
        if (dy > 0) {
          /// [ EVEN MORE STUFF WE DONT NEED ]
        }
      });
    }
so if we delete these (or put a switch before them), this function will look like:
    function resolveCollisions() {
      nodesByBreadth.forEach(function(nodes) {
        var node,
            dy,
            y0 = 0,
            n = nodes.length,
            i;

        // Push any overlapping nodes down.
        nodes.sort(ascendingDepth);
        for (i = 0; i < n; ++i) {
          node = nodes[i];
          dy = y0 - node.y;
          if (dy > 0) node.y += dy;
          y0 = node.y + node.dy + nodePadding;
        }

        // [ THE PUSHBACK CODE IS DELETED ]
      });
    }
After this change, our graphs should be less cluttered vertically, and with the following change they allow us to scroll our full-sized SanKey graph.
By default SanKey uses a fixed size canvas, so we need to make sure that the user can scroll the iframe if the diagram is larger than what fits in the report window.
To do this, we simply check the size of the diagram after drawing it and resize (and crop) the graph correctly:
s = svg.node()
bbox = s.getBBox()

s.setAttribute("viewBox", "#{bbox.x-5} #{bbox.y-5} #{bbox.width+10} #{bbox.height+10}")
s.setAttribute("width", "#{bbox.width+10}px")
s.setAttribute("height","#{bbox.height+10}px")
The extra 5 pixel margin is for clipping safety.
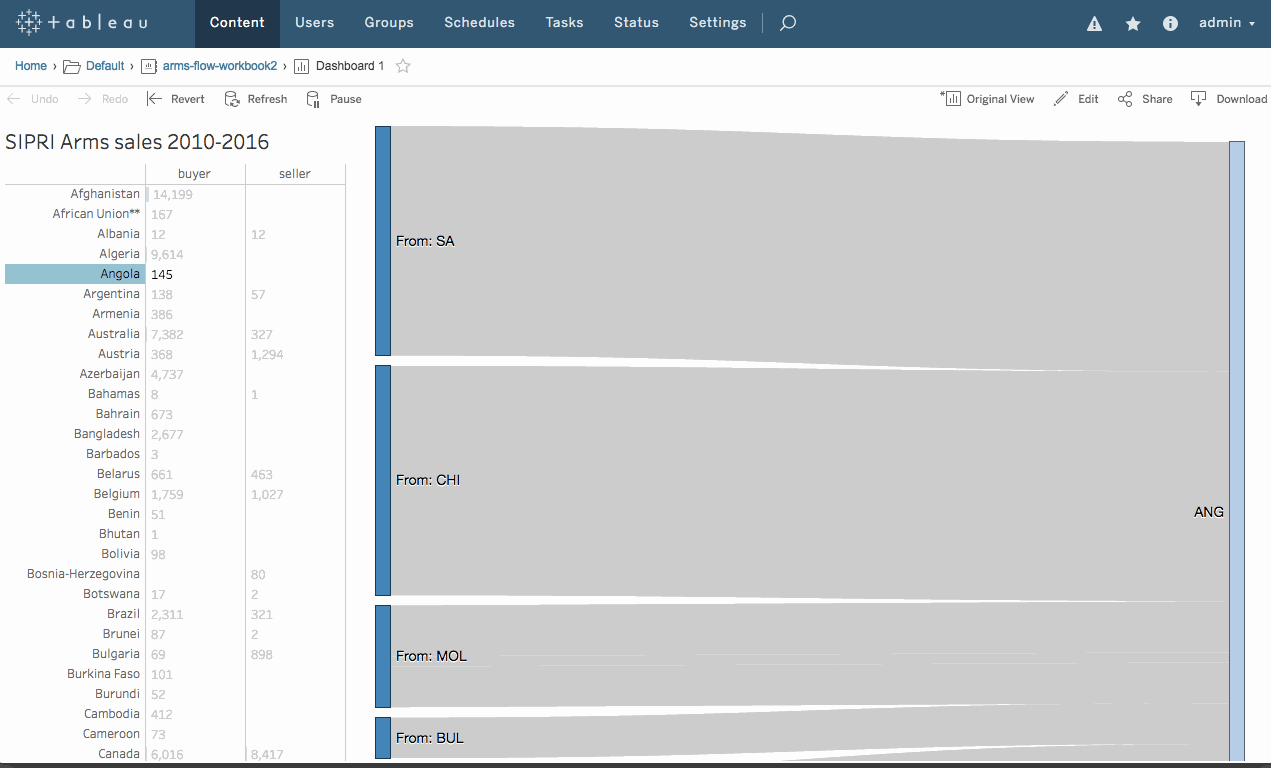
When we select "Argentina", our diagram loads wonderfully, but when we select "Austria", our browser window just freezes and we have to use Chrome's Task Manager to kill the browser tab itself. Lets hunt this bug down.
After a little console.log debugging, its clear to us, that the
problema happens after we call sankey.layout(), which tries to layout
the graph, but does not seem to work.
So lets add a breakpoint to the first line of the layout function:
  sankey.layout = function(iterations) {
    // Add breakpoint to the next line
    computeNodeLinks();
    computeNodeValues();
    computeNodeBreadths();
    computeNodeDepths(iterations);
    computeLinkDepths();
    return sankey;
  };
After reloading the page and clicking once again on Austria, we
can use the Step function (F10) to step over each call, and we find
that the error happens in computeNodeBreadths() (the browser freezes
there). So lets kill the tab once more, reload it, and this time when
the execution reaches computeNodeBreadths(), instead of jumping over
it with F10, we'll jump into it using F11 or the Step into button on
the debug toolbar.
The function body itself is a fairly standard DAG walker:
  function computeNodeBreadths() {
    var remainingNodes = nodes,
        nextNodes,
        x = 0;

    while (remainingNodes.length) {
      // put a breakpoint to the next line
      nextNodes = [];
      remainingNodes.forEach(function(node) {
        node.x = x;
        node.dx = nodeWidth;
        node.sourceLinks.forEach(function(link) {
          if (nextNodes.indexOf(link.target) < 0) {
            nextNodes.push(link.target);
          }
        });
      });
      remainingNodes = nextNodes;
      ++x;
    }

    // [...]
  }
So its a recursive-like algorithm, perfectly suited for infinite loops when exit condition checks are negated. Lets find a suitable exit condition for our case.
But first, lets use the debugger to figure out what the problem is. Placing a breakpoint to the start of the inner loop and stepping through the loop a few times its clear, that the problem comes from cyclic sales:
- country A sells something(s) to B
- country B sells something(s) to A
First lets make sure that we dont ever have to use the Chrome Task Manager again: lets add a check to the outer loop to check if we did any work in the current resolve round.
    while (remainingNodes.length) {
      // [...]
      remainingNodes.forEach(function(node) {
        // [...]
      });

      // Check if we have reduced any elements, if not, we should be in an inifinite loop
      if (nextNodes.length == remainingNodes.length) {
        throw new Error("Infinite loop detected in links");
      }

      remainingNodes = nextNodes;
      // [...]
    }
So now instead of an infinite loop, we'll throw an error and our browser keeps being responsible.
Looking at this code its clear that D3 SanKey only supports DAGs (links going from left to right without any cycles), and our sales data is certanly not Acyclic. The classic sollution would be to extend SanKey to handle Cyclic graphs, but this takes too much time and requires too much experimentation, so we'll just use a simple workaround:
We are only curious about the import export flow of the central node(s), we dont want to properly represent the complete graph, so lets change the node names to reflect their role:
- nodes we import from will be named
From: [COUNTRY] - nodes we export to will be named
To: [COUNTRY]
This way even if country A exports to and imports from country B, we'll
have two nodes for B: From: B and To: B so our graph will not
contain any cycles, and we can plot it with SanKey.
To inject it, the best place is before we do the transform to SanKey
format (in the makeSanKeyData function):
makeSanKeyData = (rowsIn)->

  rows = _.map rowsIn, (row)->
    _.extend {}, row, switch row["Pivot Field Names"]
      when "buyer" then {sellercod: "From: #{row.sellercod}"}
      when "seller" then {buyercod: "To: #{row.buyercod}"}

  # [...]
We are (ab)using the fact that the Pivot field name tells us the actual role of the node (if its a buyer or seller), and we update the name of the node in the SanKey data to reflect this role and to split up import and export.
Now our graph can show us all countries. But we are still getting some
errors about rect tags and their height attributes in the drawNode
function. Lets try to fix those.
Since the error traces pinpoint the exact problem spot our job is fairly easy:
drawNodes = (svg, sankey, width, nodes)->
  # [...]
  node = # ...
  # [...]

  node.append("rect")
      # The next line is where the error is coming from
      .attr("height", (d)-> d.dy)
  # [...]
So if d.dy is a NaN (Not a Number) or negative, we have some
problems. Lets make sure that can never happen by using Math.max()
with a 10 pixels as a reasonable minimum:
   # [...]
    .attr("height", (d)-> Math.max(10, d.dy))
And now most of our graphs should draw fine.
There still are some layout errors with our graph (check the USA for example), but the article is already very long, so we'll most likely tackle those problems in a later blog post, as they require an almost from-scratch rewrite of the SanKey layouter (because they stem from the fact that the D3 SanKey layouter was designed for fixed size graphs with a relatively small number of nodes and links).