PANOPLY is a platform for applying state-of-the-art statistical and machine learning algorithms to transform multi-omic data from cancer samples into biologically meaningful and interpretable results. PANOPLY leverages Terra—a cloud-native platform for extreme-scale data analysis, sharing, and collaboration—to host proteogenomic workflows, and is designed to be flexible, automated, reproducible, scalable, and secure. A wide array of algorithms applicable to all cancer types have been implemented, and available in PANOPLY for analysis of cancer proteogenomic data.
 |
|---|
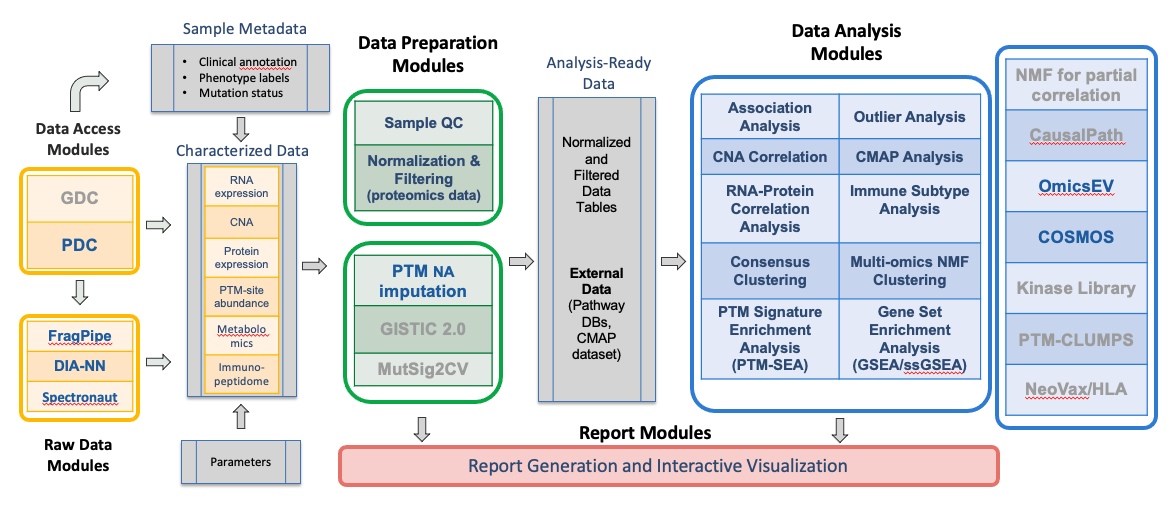
| Figure 1. Overview of PANOPLY architecture and the various tasks that constitute the complete workflow. Tasks can also be run independently, or combined into custom workflows, including new tasks added by users. Inputs to PANOPLY consists of (i) externally characterized genomics and proteomics data (in gct format); (ii) sample phenotype and annotations (in csv format); and (iii) parameters settings (in yaml format). Panoply modules are grouped into Data Preparation Modules (green box), Data Analysis Modules (blue box) and Report Modules (red box). Data preparation modules perform quality checks on input data followed by optional normalization and filtering for proteomics data. Analysis ready data tables are then used as inputs to the data analysis modules. Results from the data analysis modules are summarized in interactive reports generated by appropriate report modules. Modules under development are listed in grey text. |
PANOPLY consists of the following components:
- A Terra production workspace on PANOPLY_Production_Pipelines_v1_4 with a preconfigured unified workflow to automatically run all analysis tasks on proteomics (global proteome, phosphoproteome, acetylome, ubiquitylome), transcriptome and copy number data; and an additional workspace that includes separate methods for each analysis component.
- An interactive Jupyter notebook (included in the Terra workspaces) that provides step-by-step instructions for uploading data, identifying data types, specifying parameters, and setting up the PANOPLY workspace for analyzing a new dataset.
- A GitHub repository that contains code for all PANOPLY tasks and workflows, including R code for implementing analysis algorithms, task module creation, and release management. A GitHub wiki includes documentation and description of algorithms.
- A tutorial illustrating the application of PANOPLY to a published breast cancer dataset and demonstrating the practical relevance of PANOPLY by regenerating many of the results described in (Mertins et al) (1) with minimal effort. The PANOPLY_Tutorial workspace contains data and results from running the tuorial.
- Terra workspaces showing case studies of applying PANOPLY to the analysis of CPTAC BRCA (7) and CPTAC LUAD (8) datasets. The workspaces include all data, parameter settings and results.
PANOPLY provides a comprehensive collection of proteogenomic data analysis methods including sample QC (sample quality evaluation using profile plots and tumor purity scores (1), identify sample swaps, etc.), association analysis, RNA and copy number correlation (to proteome), connectivity map analysis (1 ,2), outlier analysis using BlackSheep (3), PTM-SEA (4), GSEA (5) and single-sample GSEA (6), consensus clustering, and multi-omic clustering using non-negative matrix factorization (NMF). Most analysis modules include a report generation task that outputs a HTML interactive report summarizing results from the respective analysis tasks. Mass spectrometry-based proteomics data amenable to analysis by PANOPLY includes isobaric label-based LC-MS/MS approaches like iTRAQ, TMT and TMTPro profiling the proteome and multiple PTM-omes including phospho-, acetyl-and ubiquitylomes.
Users can also customize or create new pipelines and add their own tasks and integrate them into the PANOPLY.
- For a quick introduction and tour of PANOPLY, follow the tutorial.
- Detailed documentation can be found here.
Email proteogenomics@broadinstitute.org with questions, comments or feedback.
Mani, D. R. et al. PANOPLY: a cloud-based platform for automated and reproducible proteogenomic data analysis. Nature Methods 1–3 (2021) doi:10.1038/s41592-021-01176-6.
- Mertins, P. et al. Proteogenomics connects somatic mutations to signalling in breast cancer. Nature 534, 55–62 (2016).
- Subramanian, A. et al. A Next Generation Connectivity Map: L1000 Platform and the First 1,000,000 Profiles. Cell 171, 1437–1452.e17 (2017).
- Blumenberg, L. et al. BlackSheep: A Bioconductor and Bioconda package for differential extreme value analysis. J of Proteome Research 20(7), 3767-3773 (2021).
- Krug, K. et al. A Curated Resource for Phosphosite-specific Signature Analysis. Mol. Cell. Proteomics 18, 576–593 (2019).
- Subramanian, A. et al. Gene set enrichment analysis: a knowledge-based approach for interpreting genome-wide expression profiles. Proc. Natl. Acad. Sci. 102, 15545–15550 (2005).
- Barbie, D. A., Tamayo, P., Boehm, J. S., Kim, S. Y. & Moody, S. E. Systematic RNA interference reveals that oncogenic KRAS-driven cancers require TBK1. Nature (2009).
- Gillette, M. A. et al. Proteogenomic Characterization Reveals Therapeutic Vulnerabilities in Lung Adenocarcinoma. Cell 182, 200–225.e35 (2020).
- Krug, K., Jaehnig, E. J., Satpathy, S., Blumenberg, L., et al. Proteogenomic Landscape of Breast Cancer Tumorigenesis and Targeted Therapy. Cell 183, 1–21 (2020).