

RATH is an OpenSource automated data exploration tool, which can help you automated discovery patterns & insights, generate charts and dashboards from muti-dimensional data. It uses AI enhanced engine to automate the working flow in data analysis.
- Try Latest version !! Try it(latest)
- Try Stable version Try it(stable)
Rath is an auto EDA tool (or Augmented Analytic BI), which automate explore your dataset and discovery interesting patterns, relations, recommanding expressiveness and effectiveness visualizations.
Rath provides different level of automation for different scenarios and users. For instance, 'Explore' module provides fully automation. Connect your data, and click 'analysis', Rath will do all the exploration and analysis work for you. Rath will find some insights and patterns in data and generate charts/dashboards for you. 'Discovery/knowledge build' module is an semi-automation analysis system which can be controlled to focus on your thoughts more. 'Graphic Walker' module is a manual data analysis and visualization tool for whom with specific analysis purpose.
Rath can auto generate high dimensional visualization contains complex patterns while most other auto-EDA tools only providing simple low dimensional charts with basic statistics pattern. Its means you can use Rath to explore the data to a deep level and find more insights.
Here are main parts in Rath,
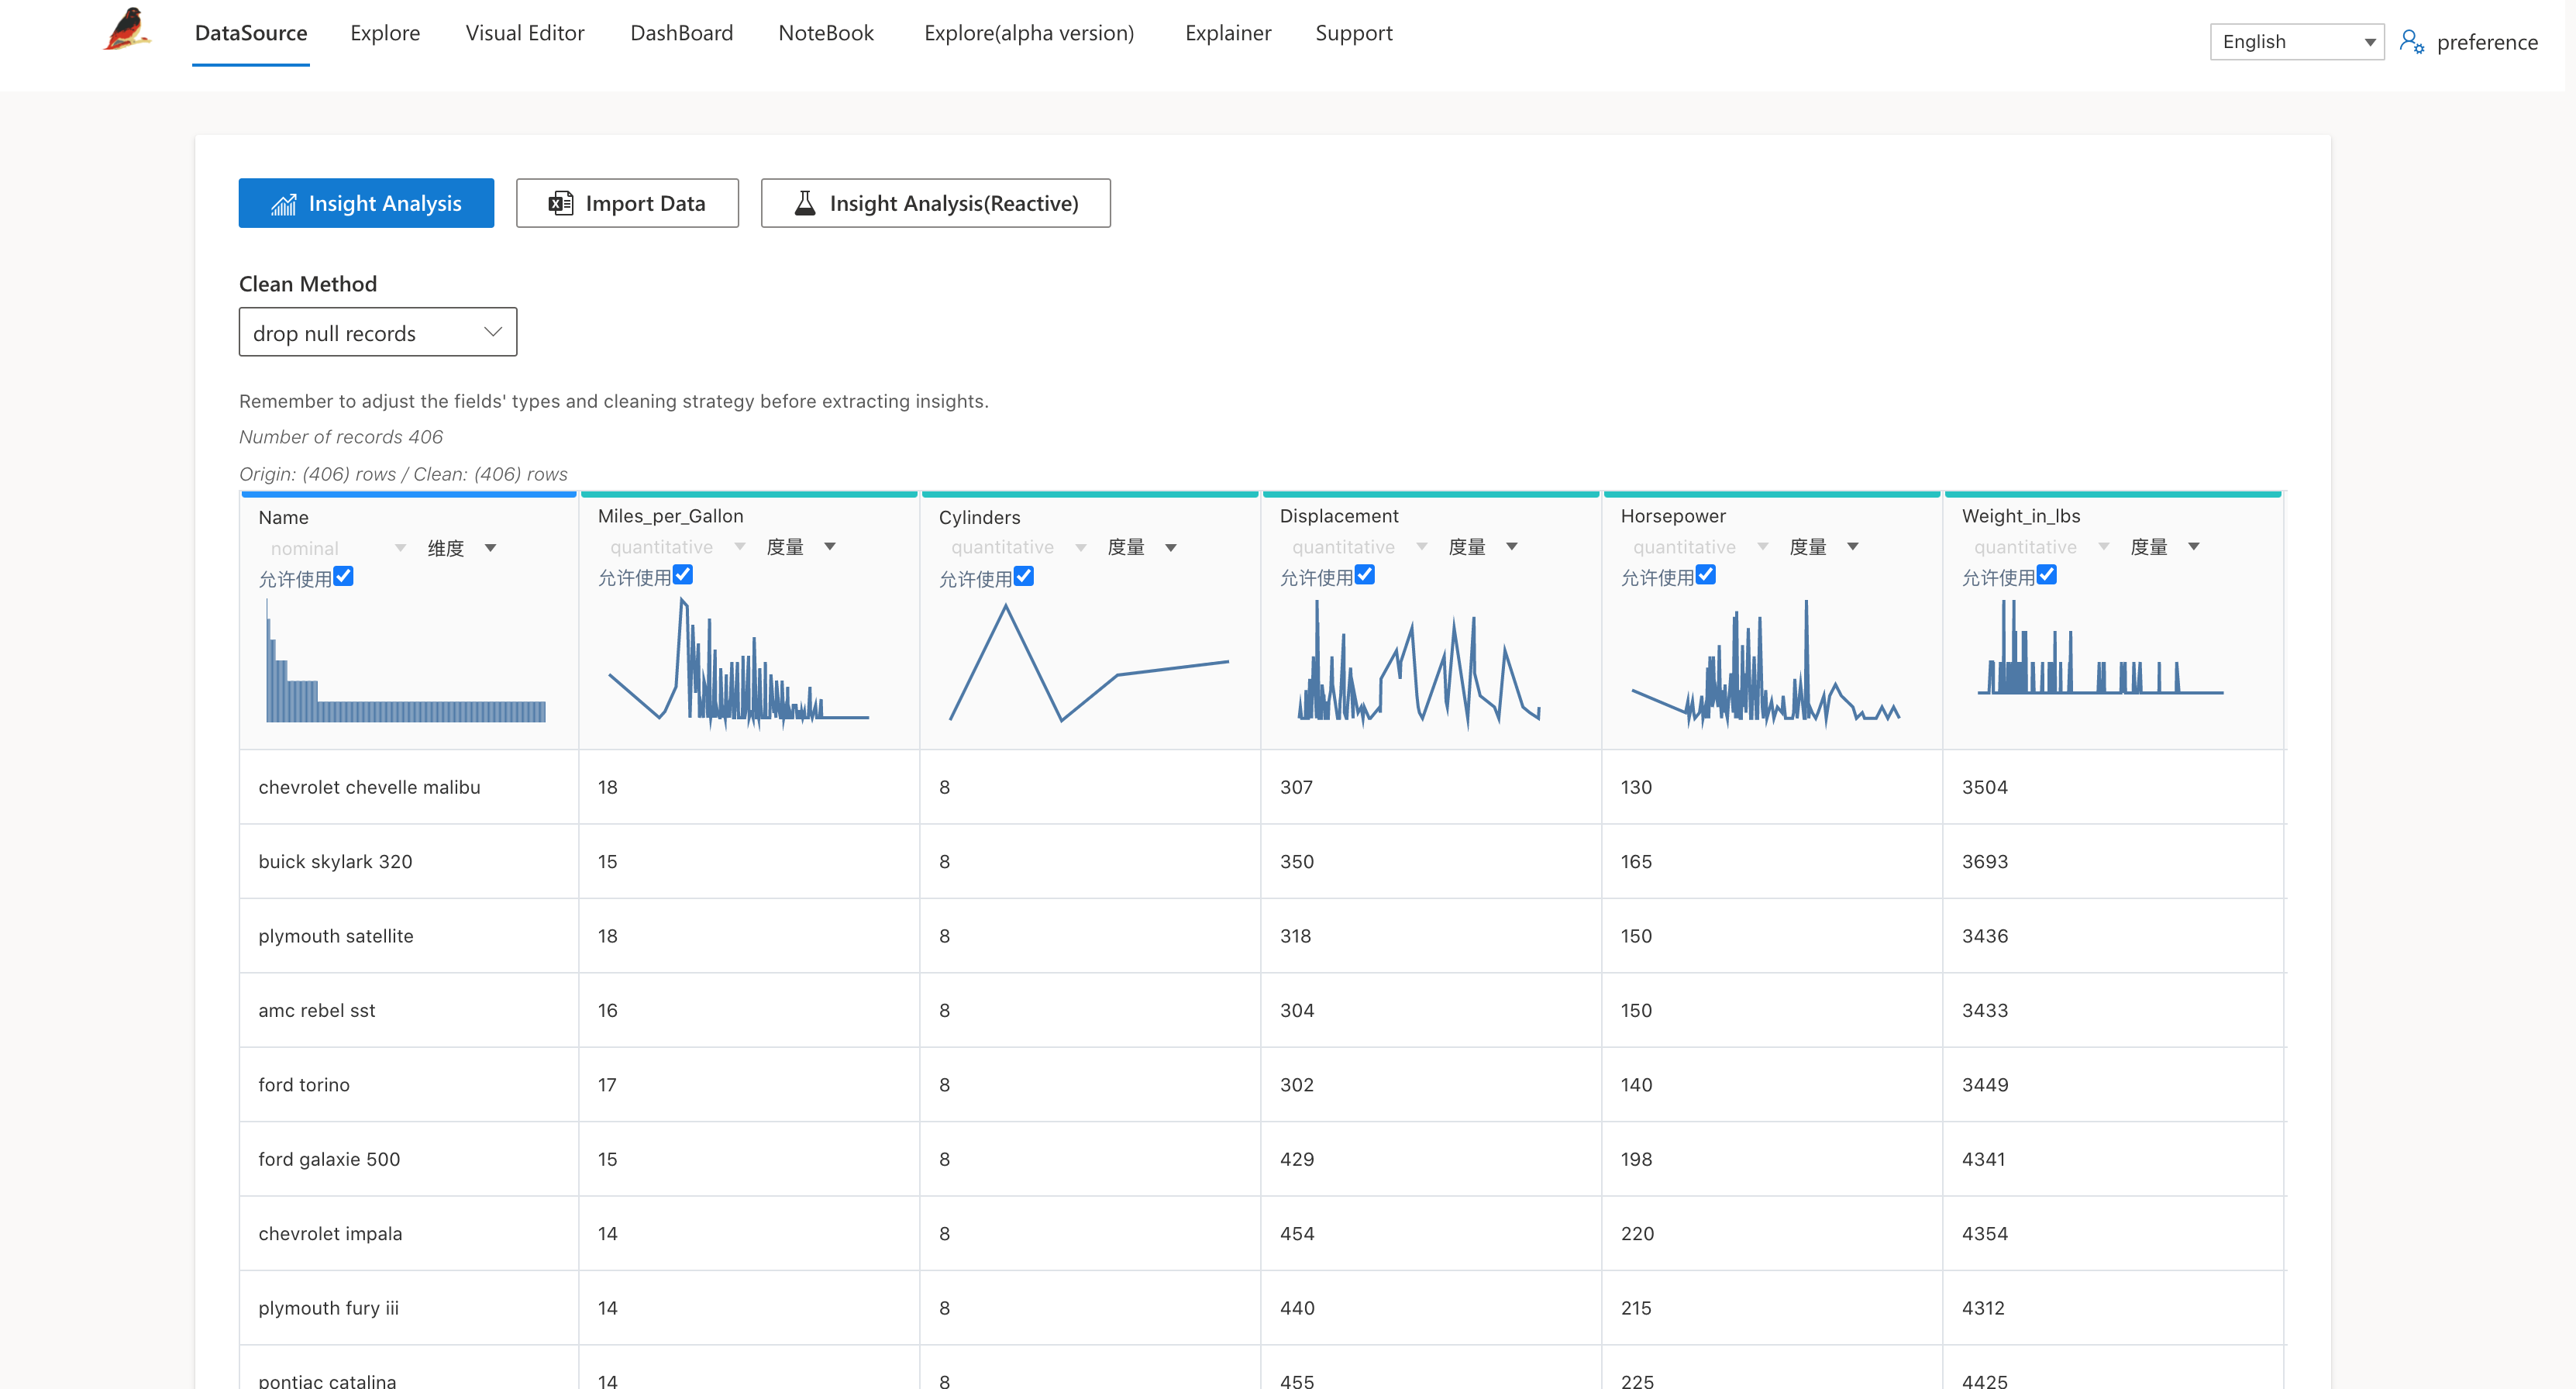
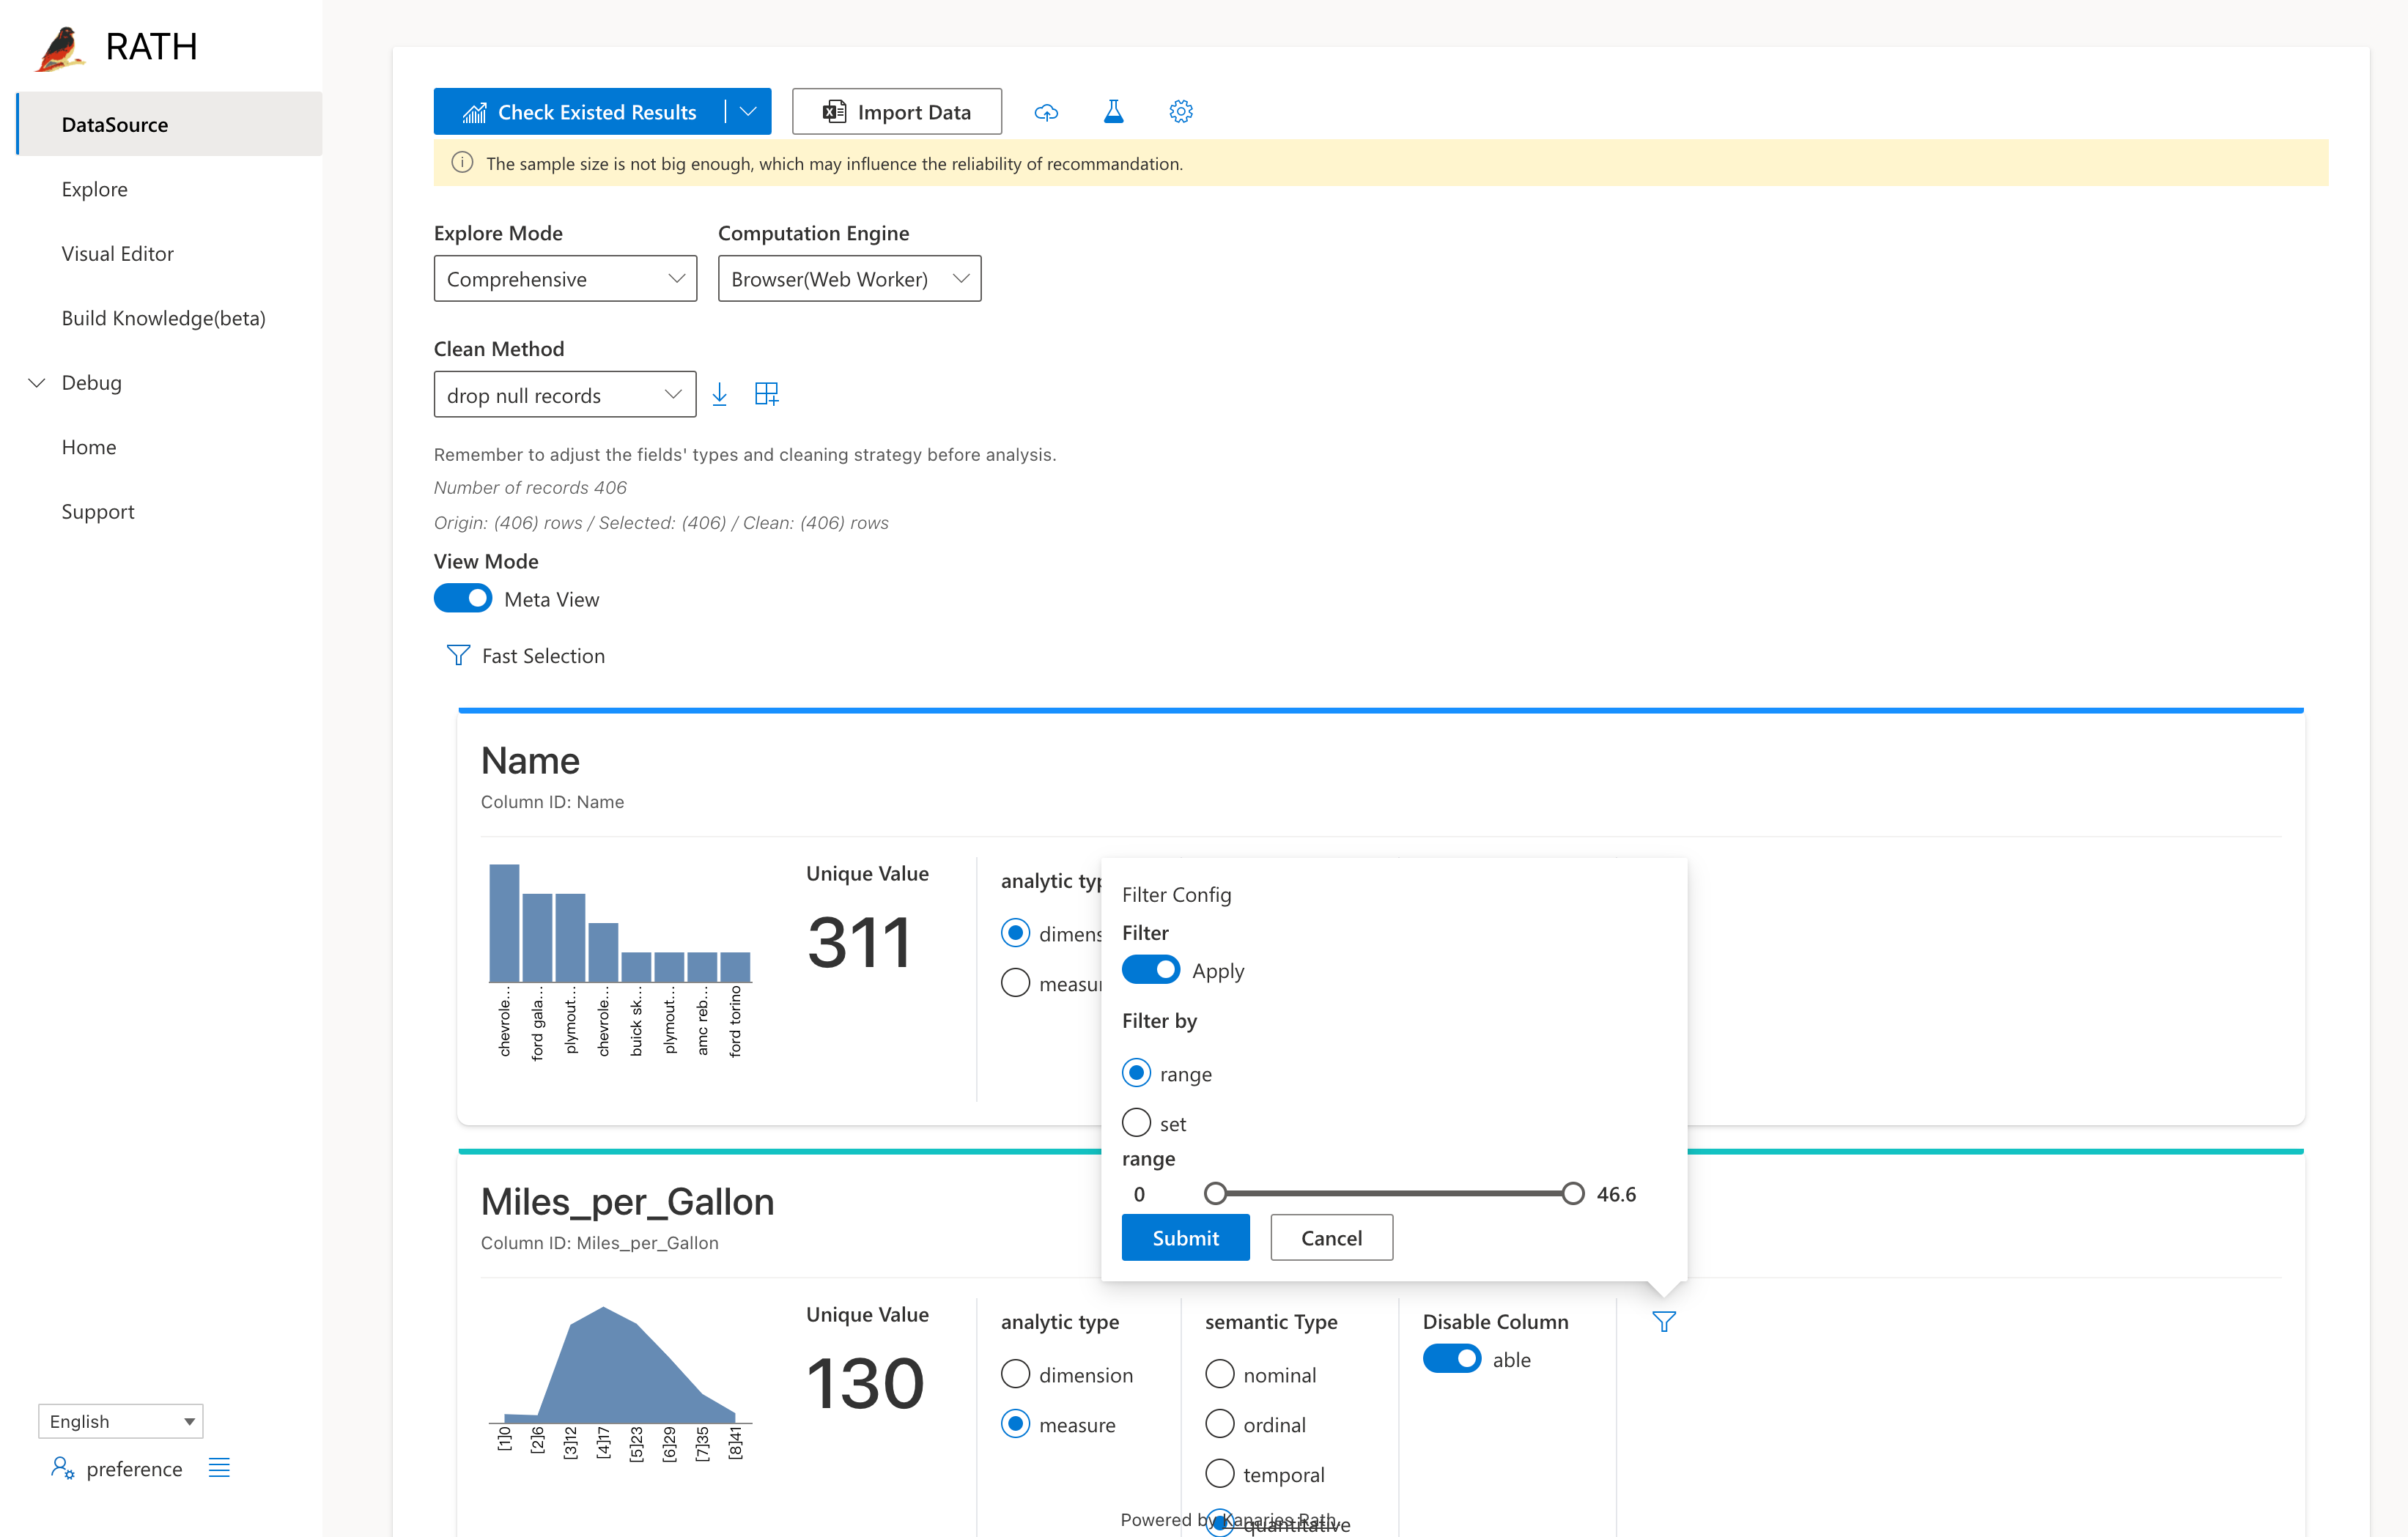
DataSource board is for data uploading, sampling(currently support stream data, which means there is no limit of the size of file you uploaded), cleaning and defining fields type(dimensions, measures). In visual insights, we regard dimensions as independent variable or feature and measures as dependent variable or target.
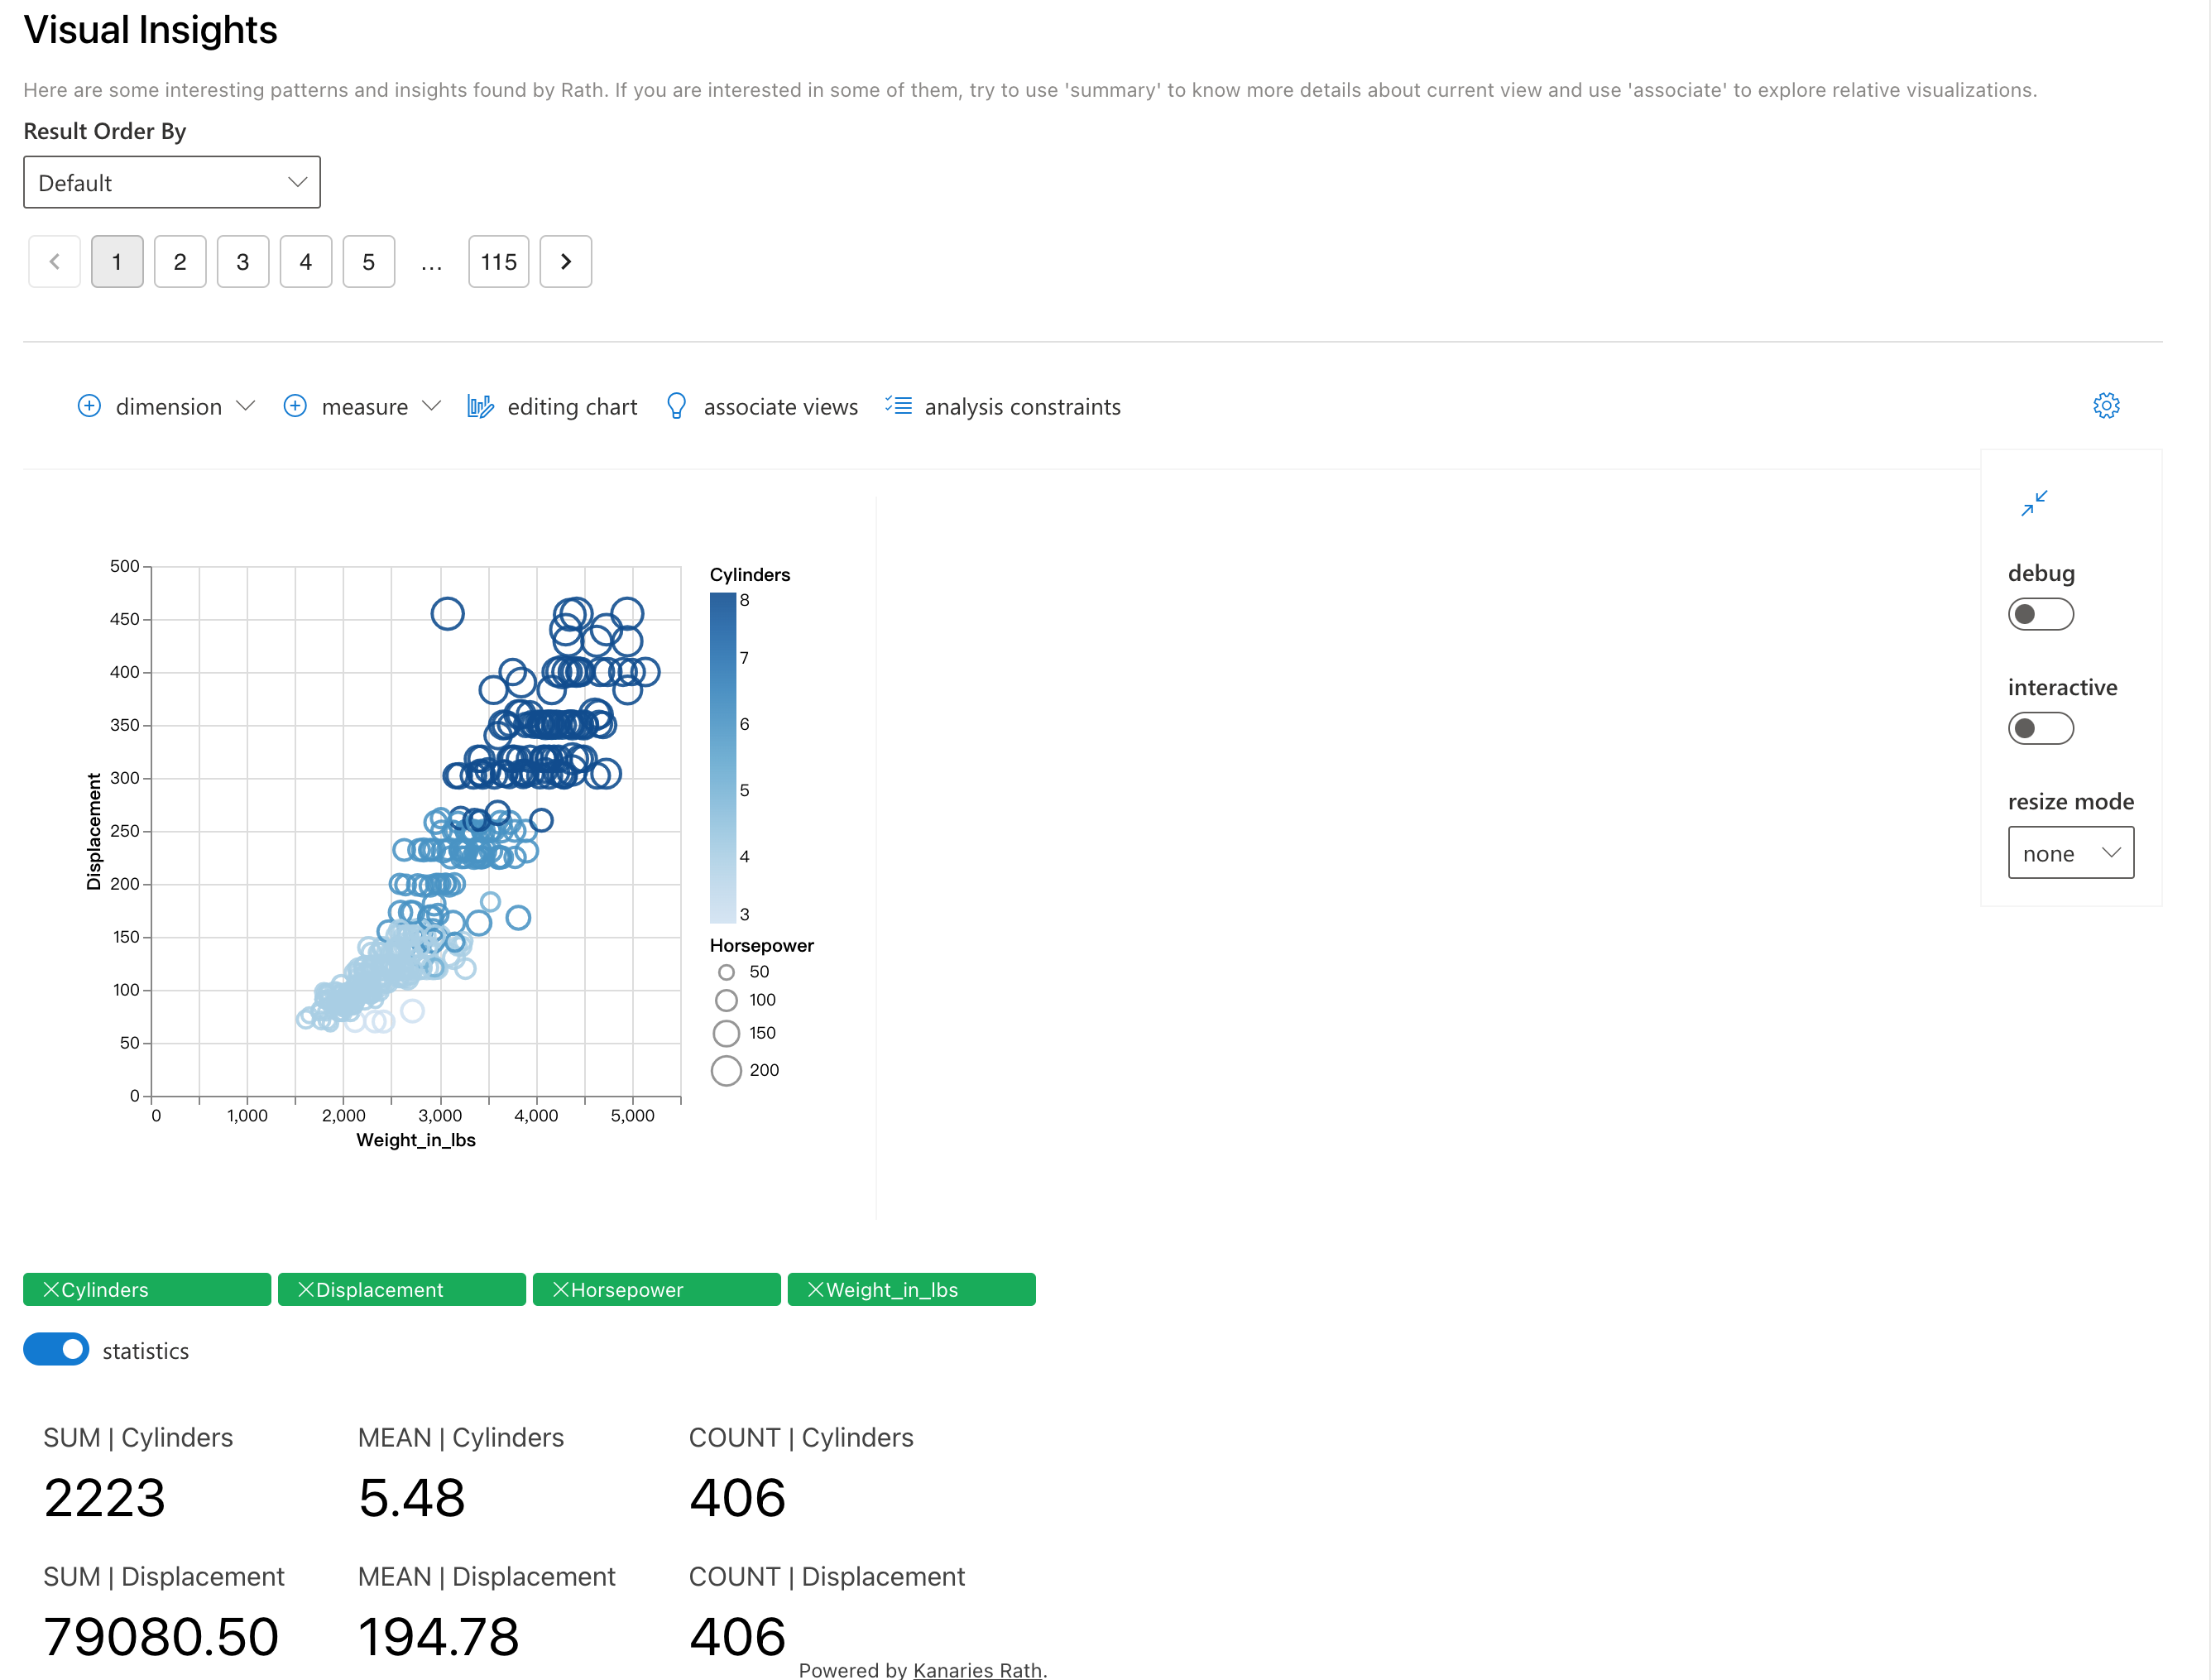
Rath automate explore your dataset and discovery interesting patterns, relations, recommanding expressiveness and effectiveness visualizations.
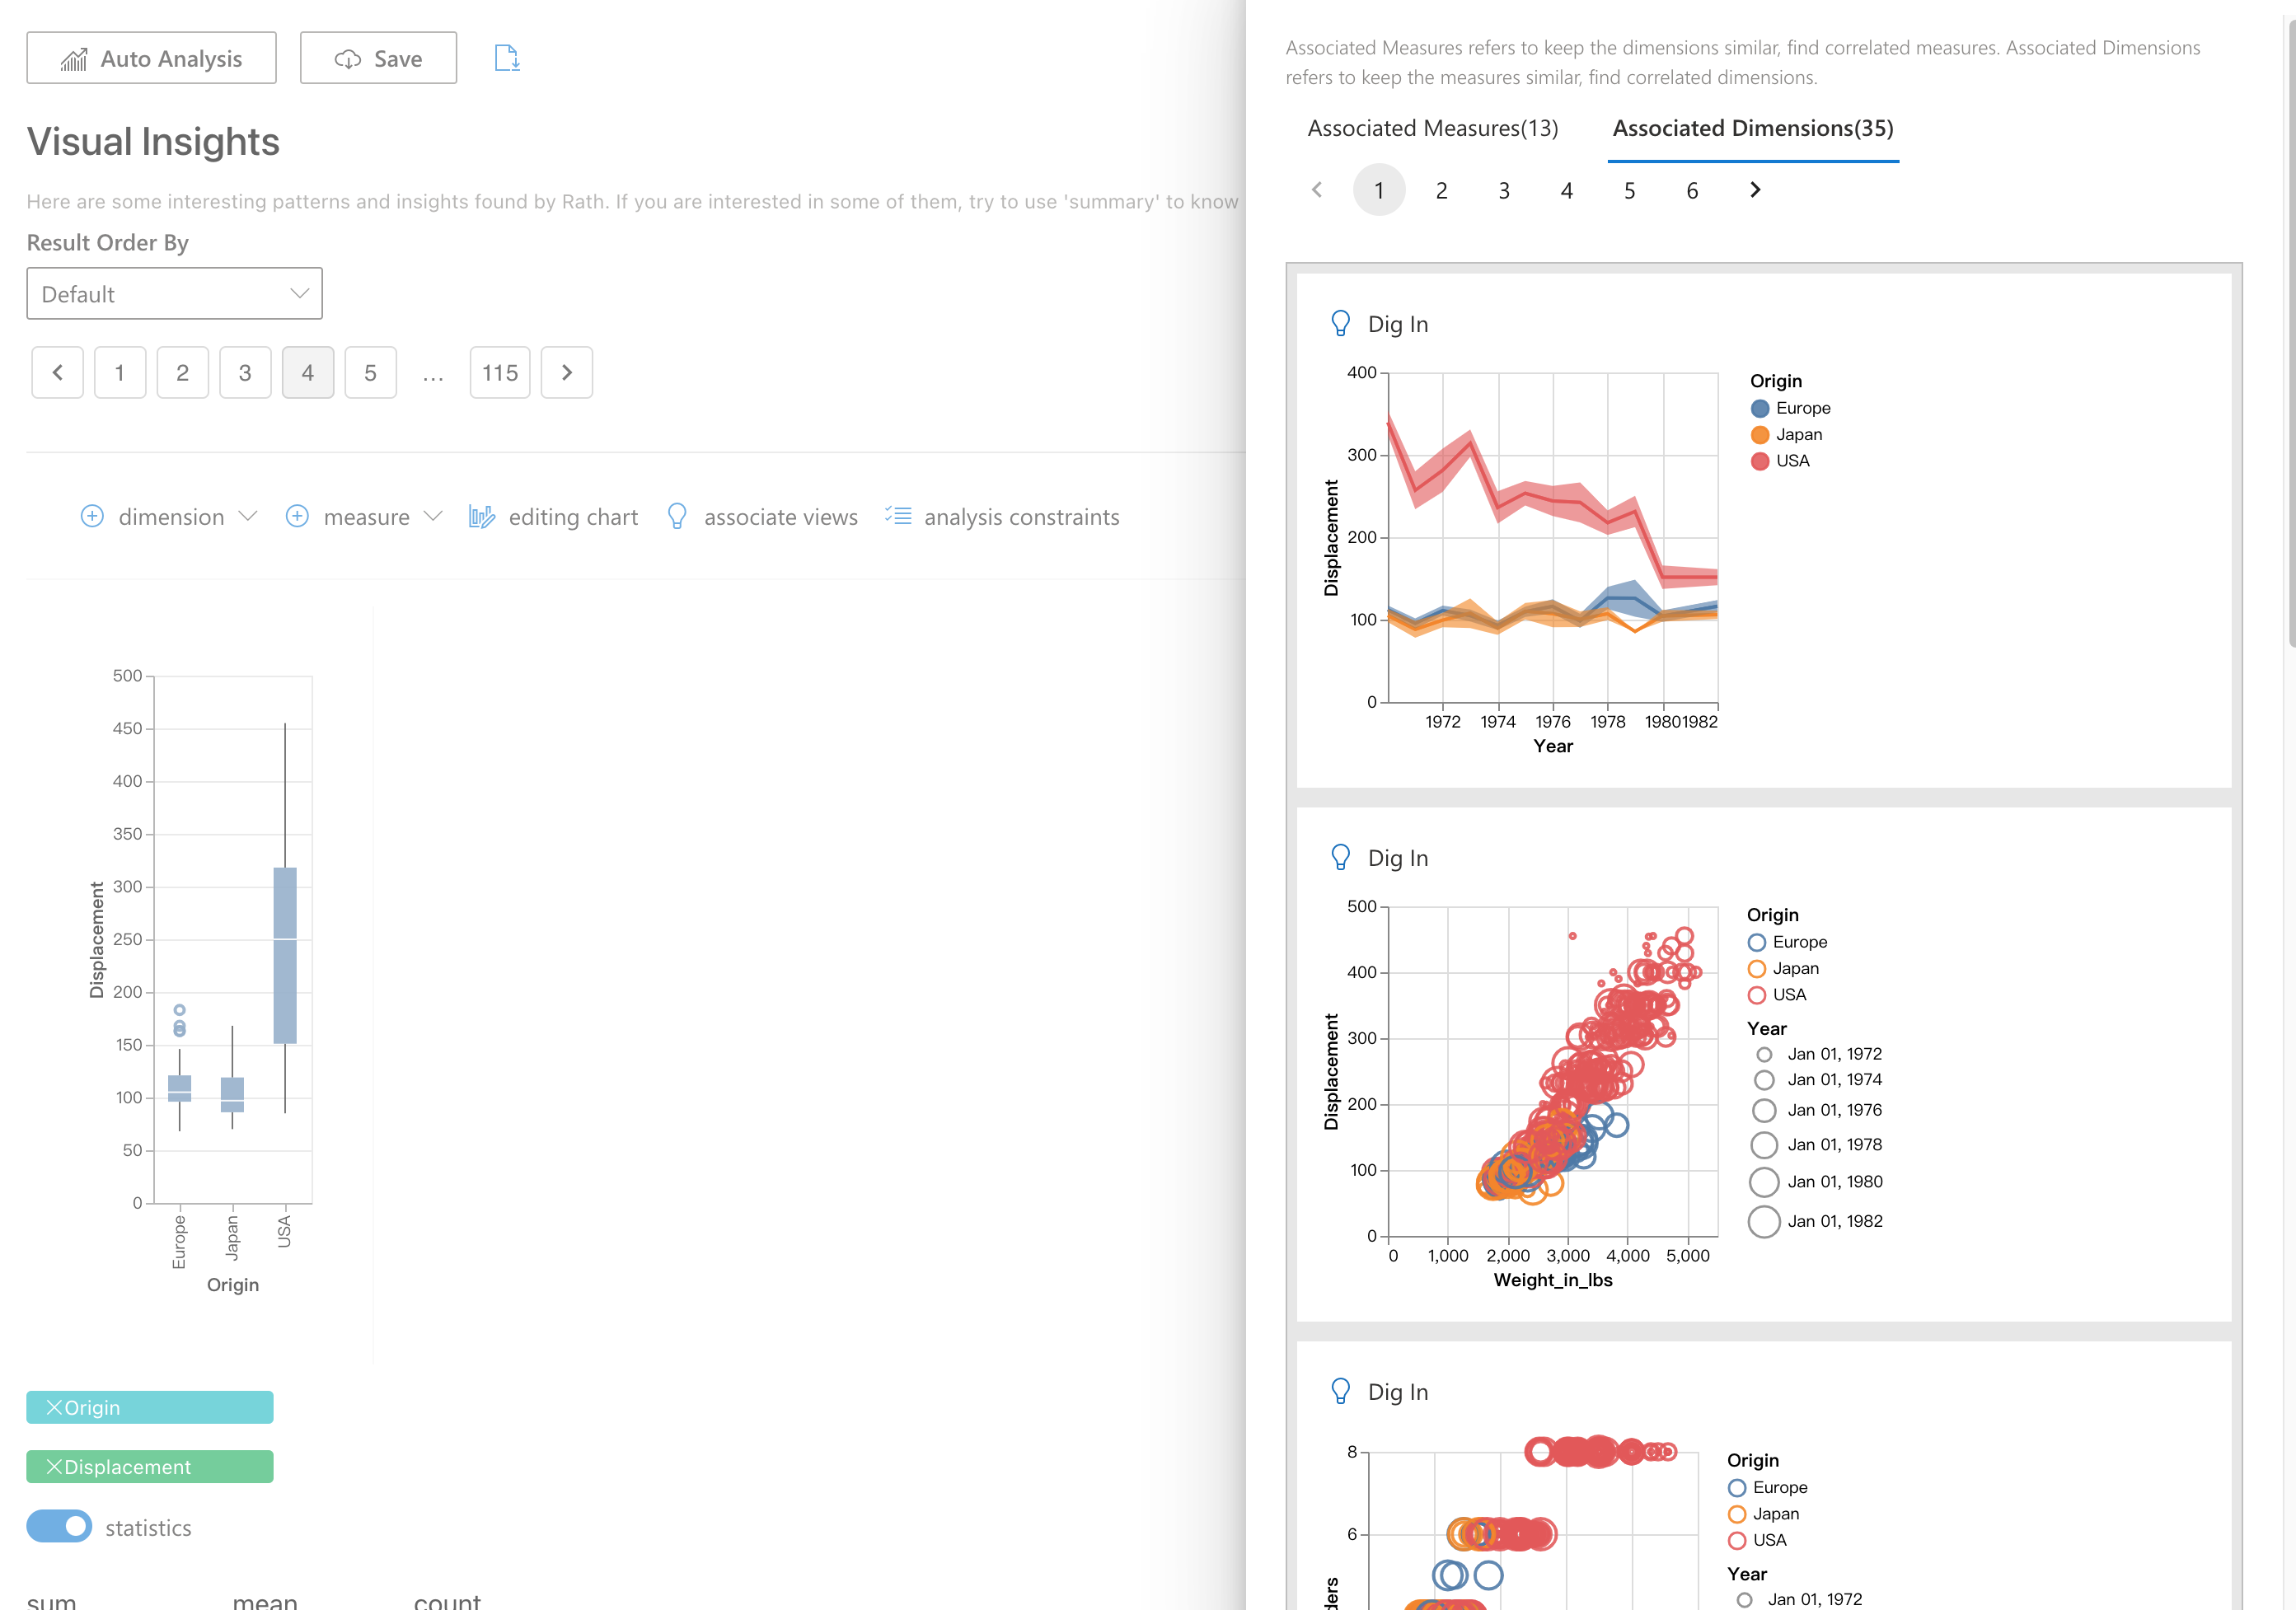
If some of the recommadations catch your interests, you can click associate button and Rath will assocaite more related insights for you.
If you have some very specific target, you can switch to a manual EDA tool inside Rath called Graphic Walker.
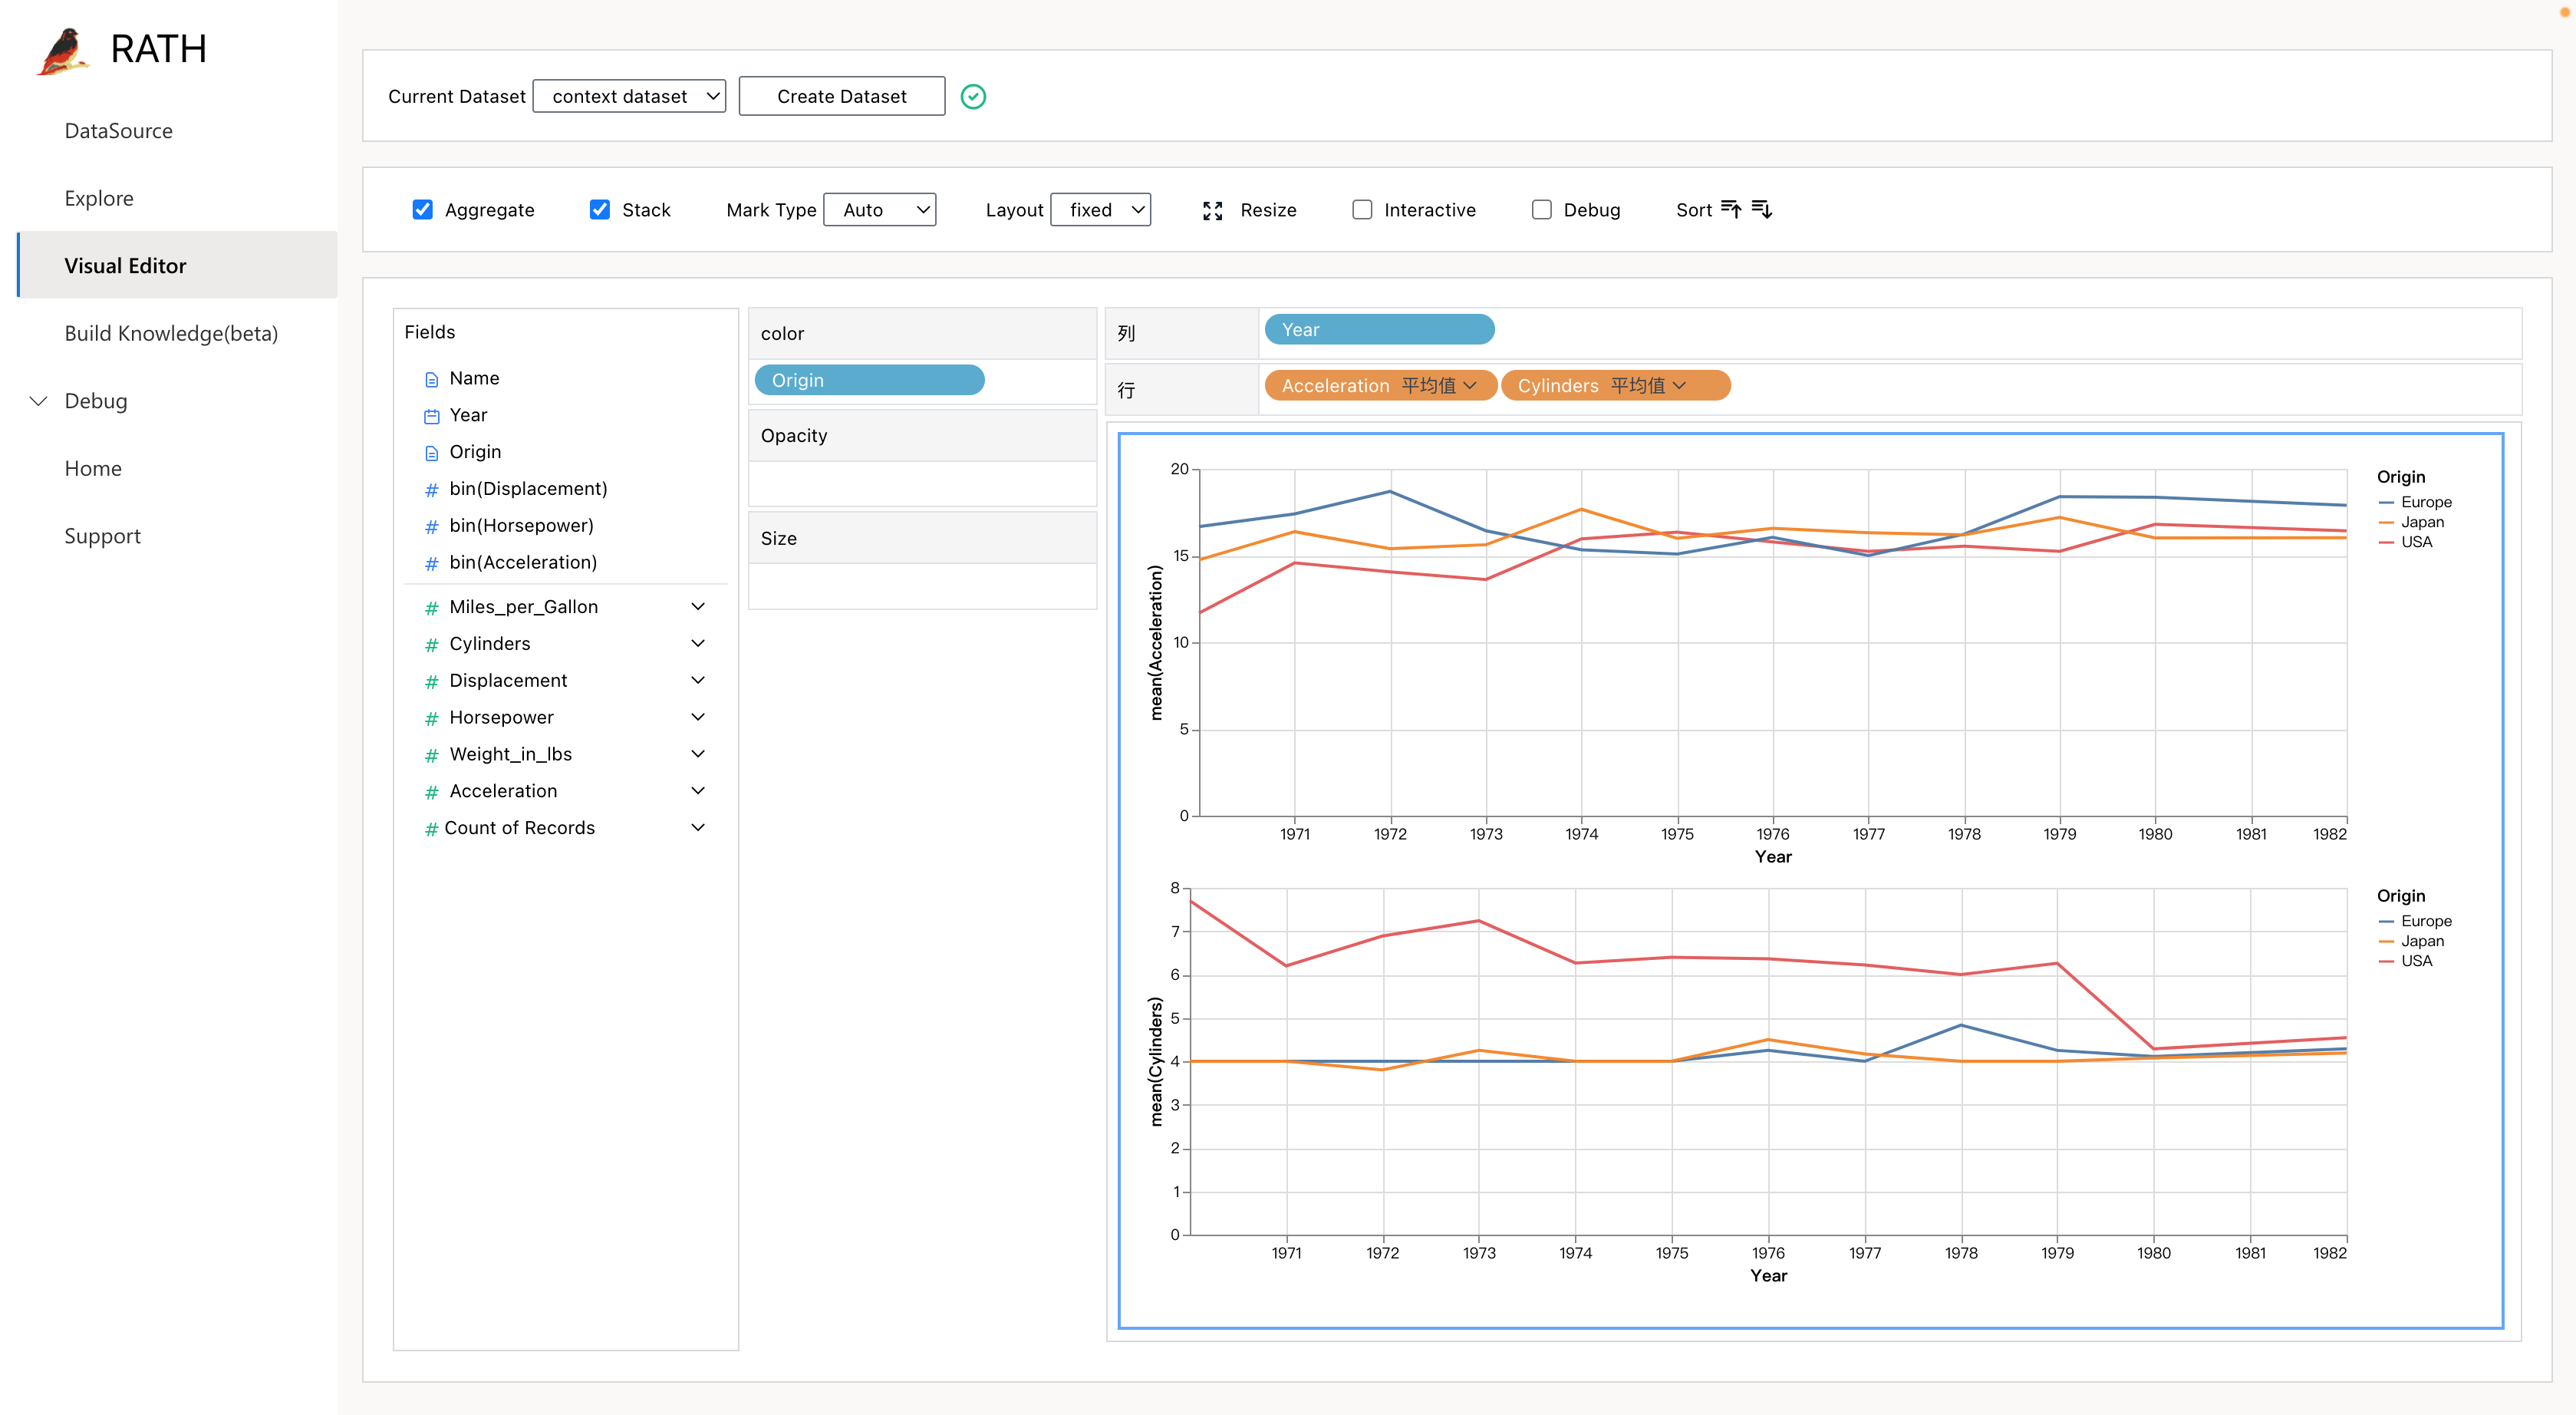
Graphic Walker is a lite tableau/polaris style visual analysis app, which is also based on wilkinson's Grammer of Graphics. It is used for cases when users have specific analytic target or user want to analysis further result based on the recommended results by Rath's auto insights.
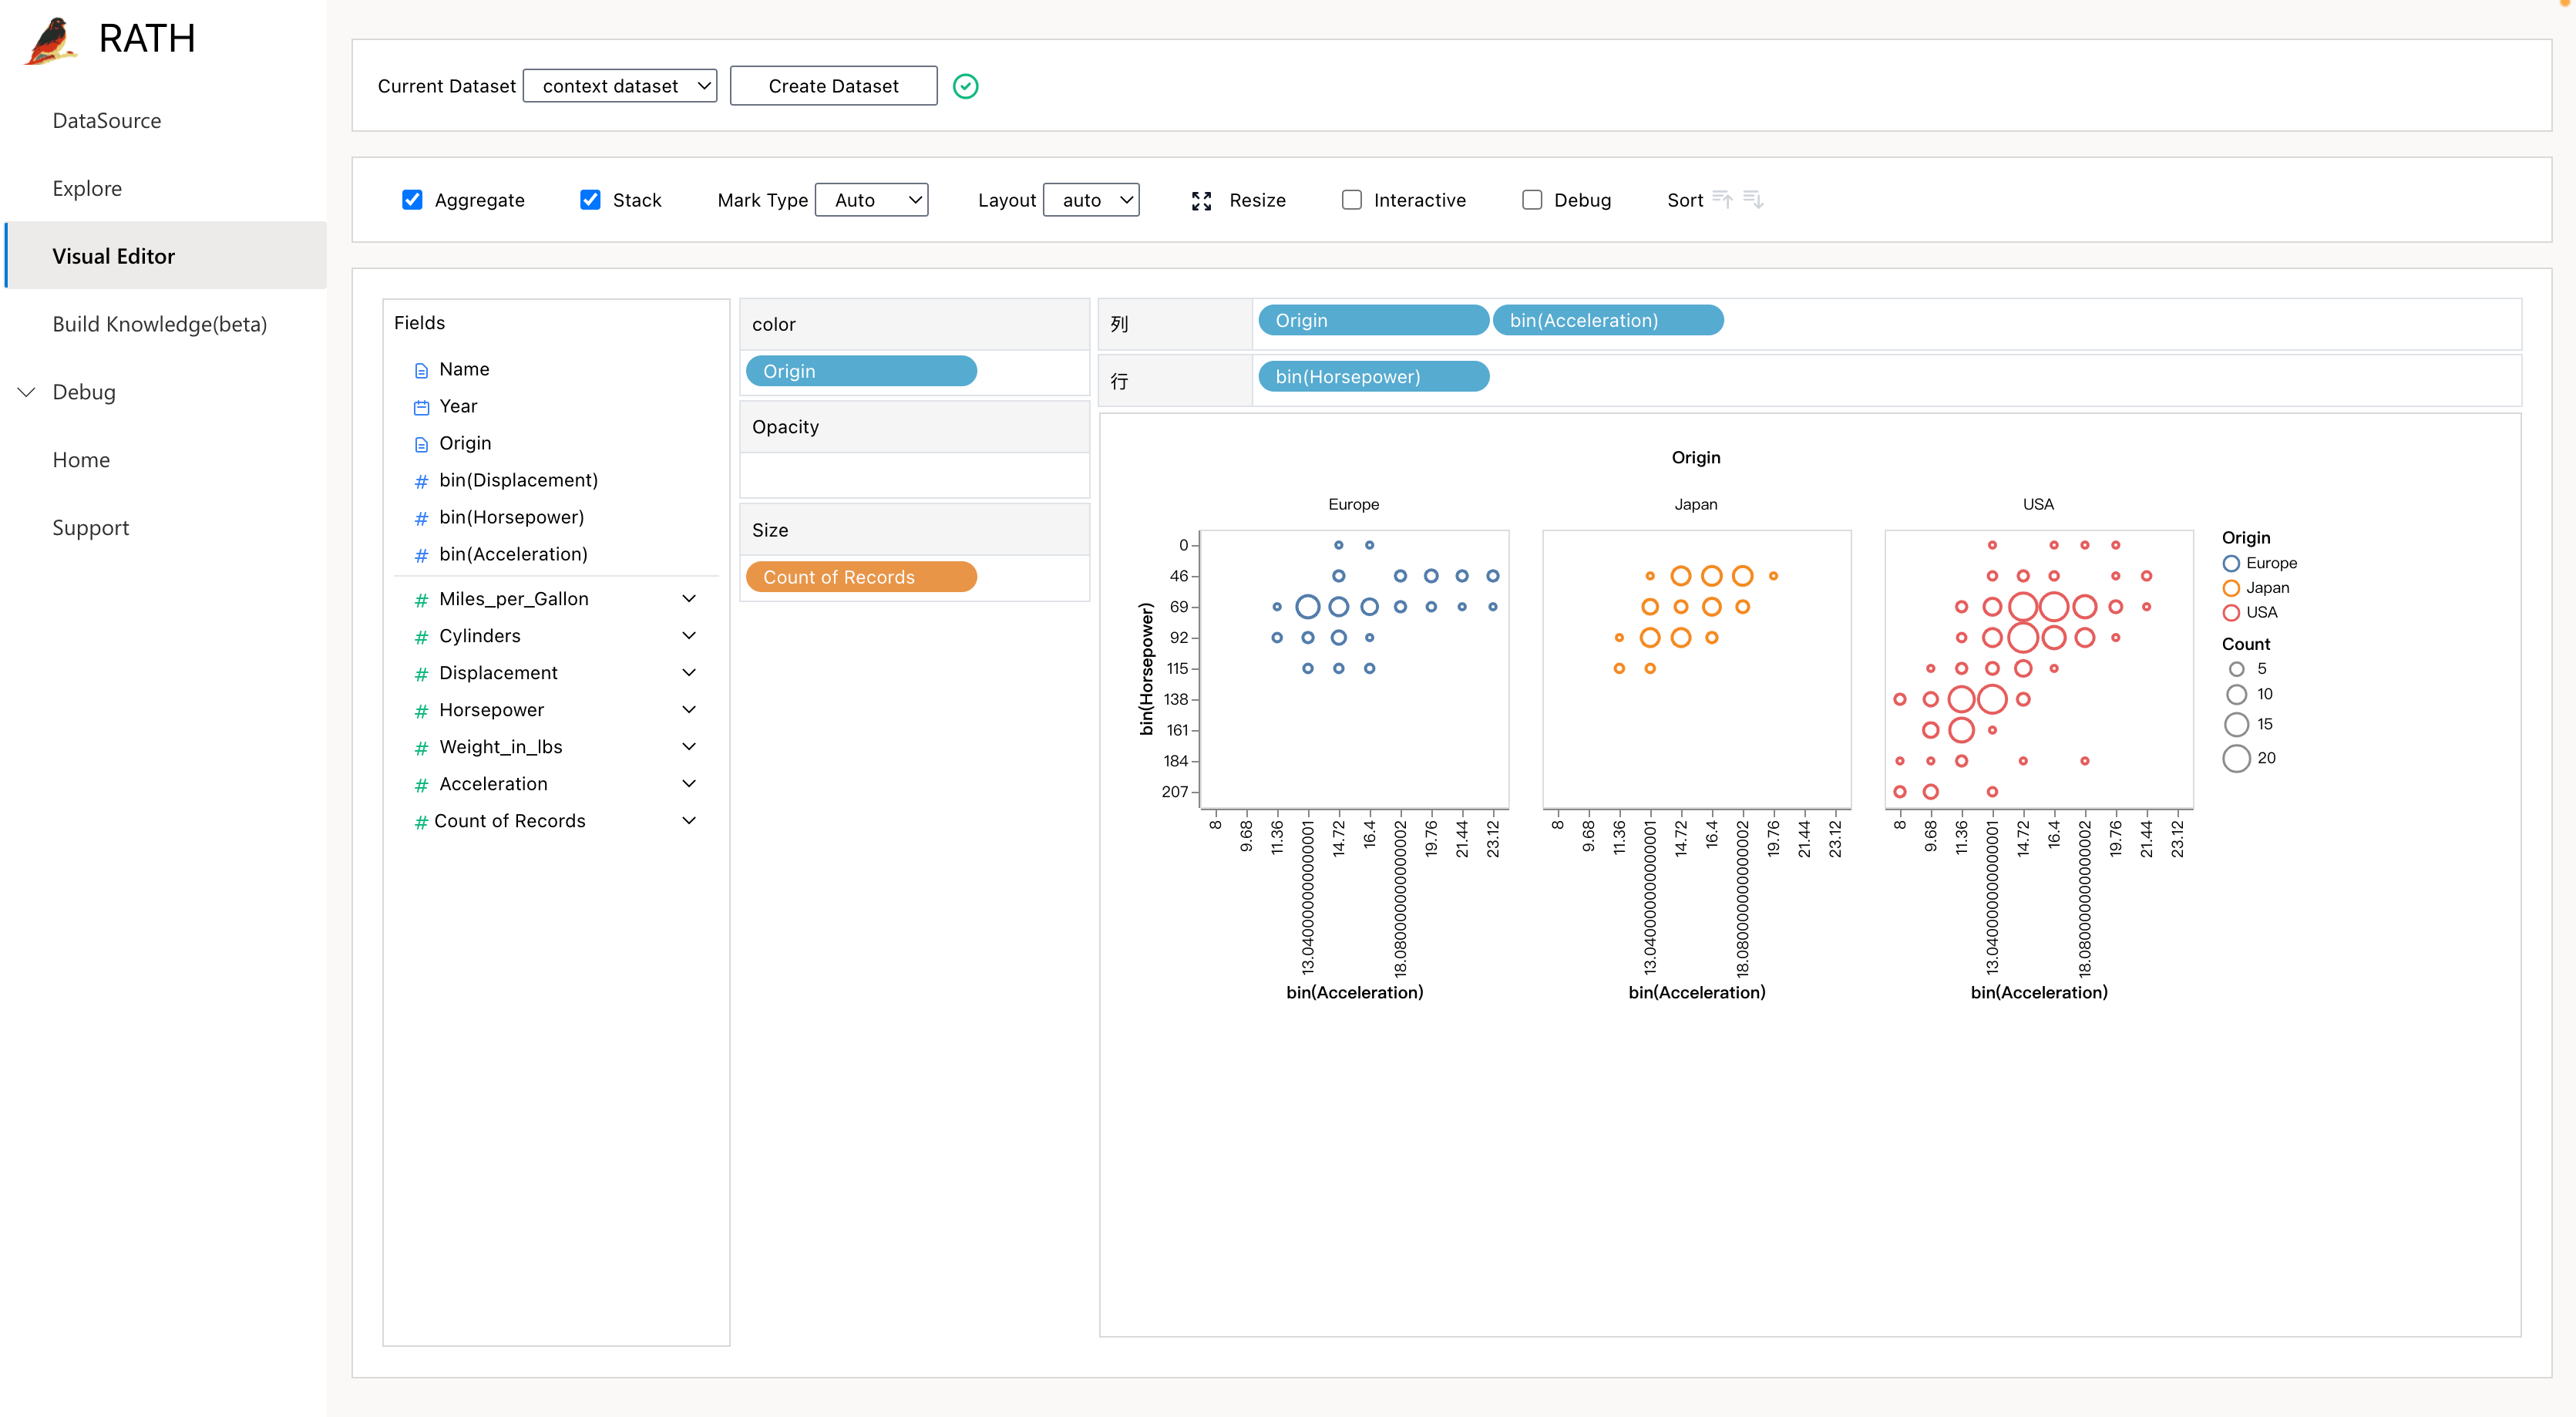
We use similar visualization specification rules in polaris, which is frendly to users who are familiar with tableau.
Graphic Walker is an independent embedding module. You can use it independently in your own app. See more details in packages/graphic-walker/README.md
yarn add @kanaries/graphic-walker
# or

npm i --save @kanaries/graphic-walker
Discovery or knowledge build module is a semi-automated data exploration system. It automate step by step and try to understand what the users are thinking in real time. Users can tell Rath Discovery what thery are more interested in and Rath will focus more on the subset user care about.
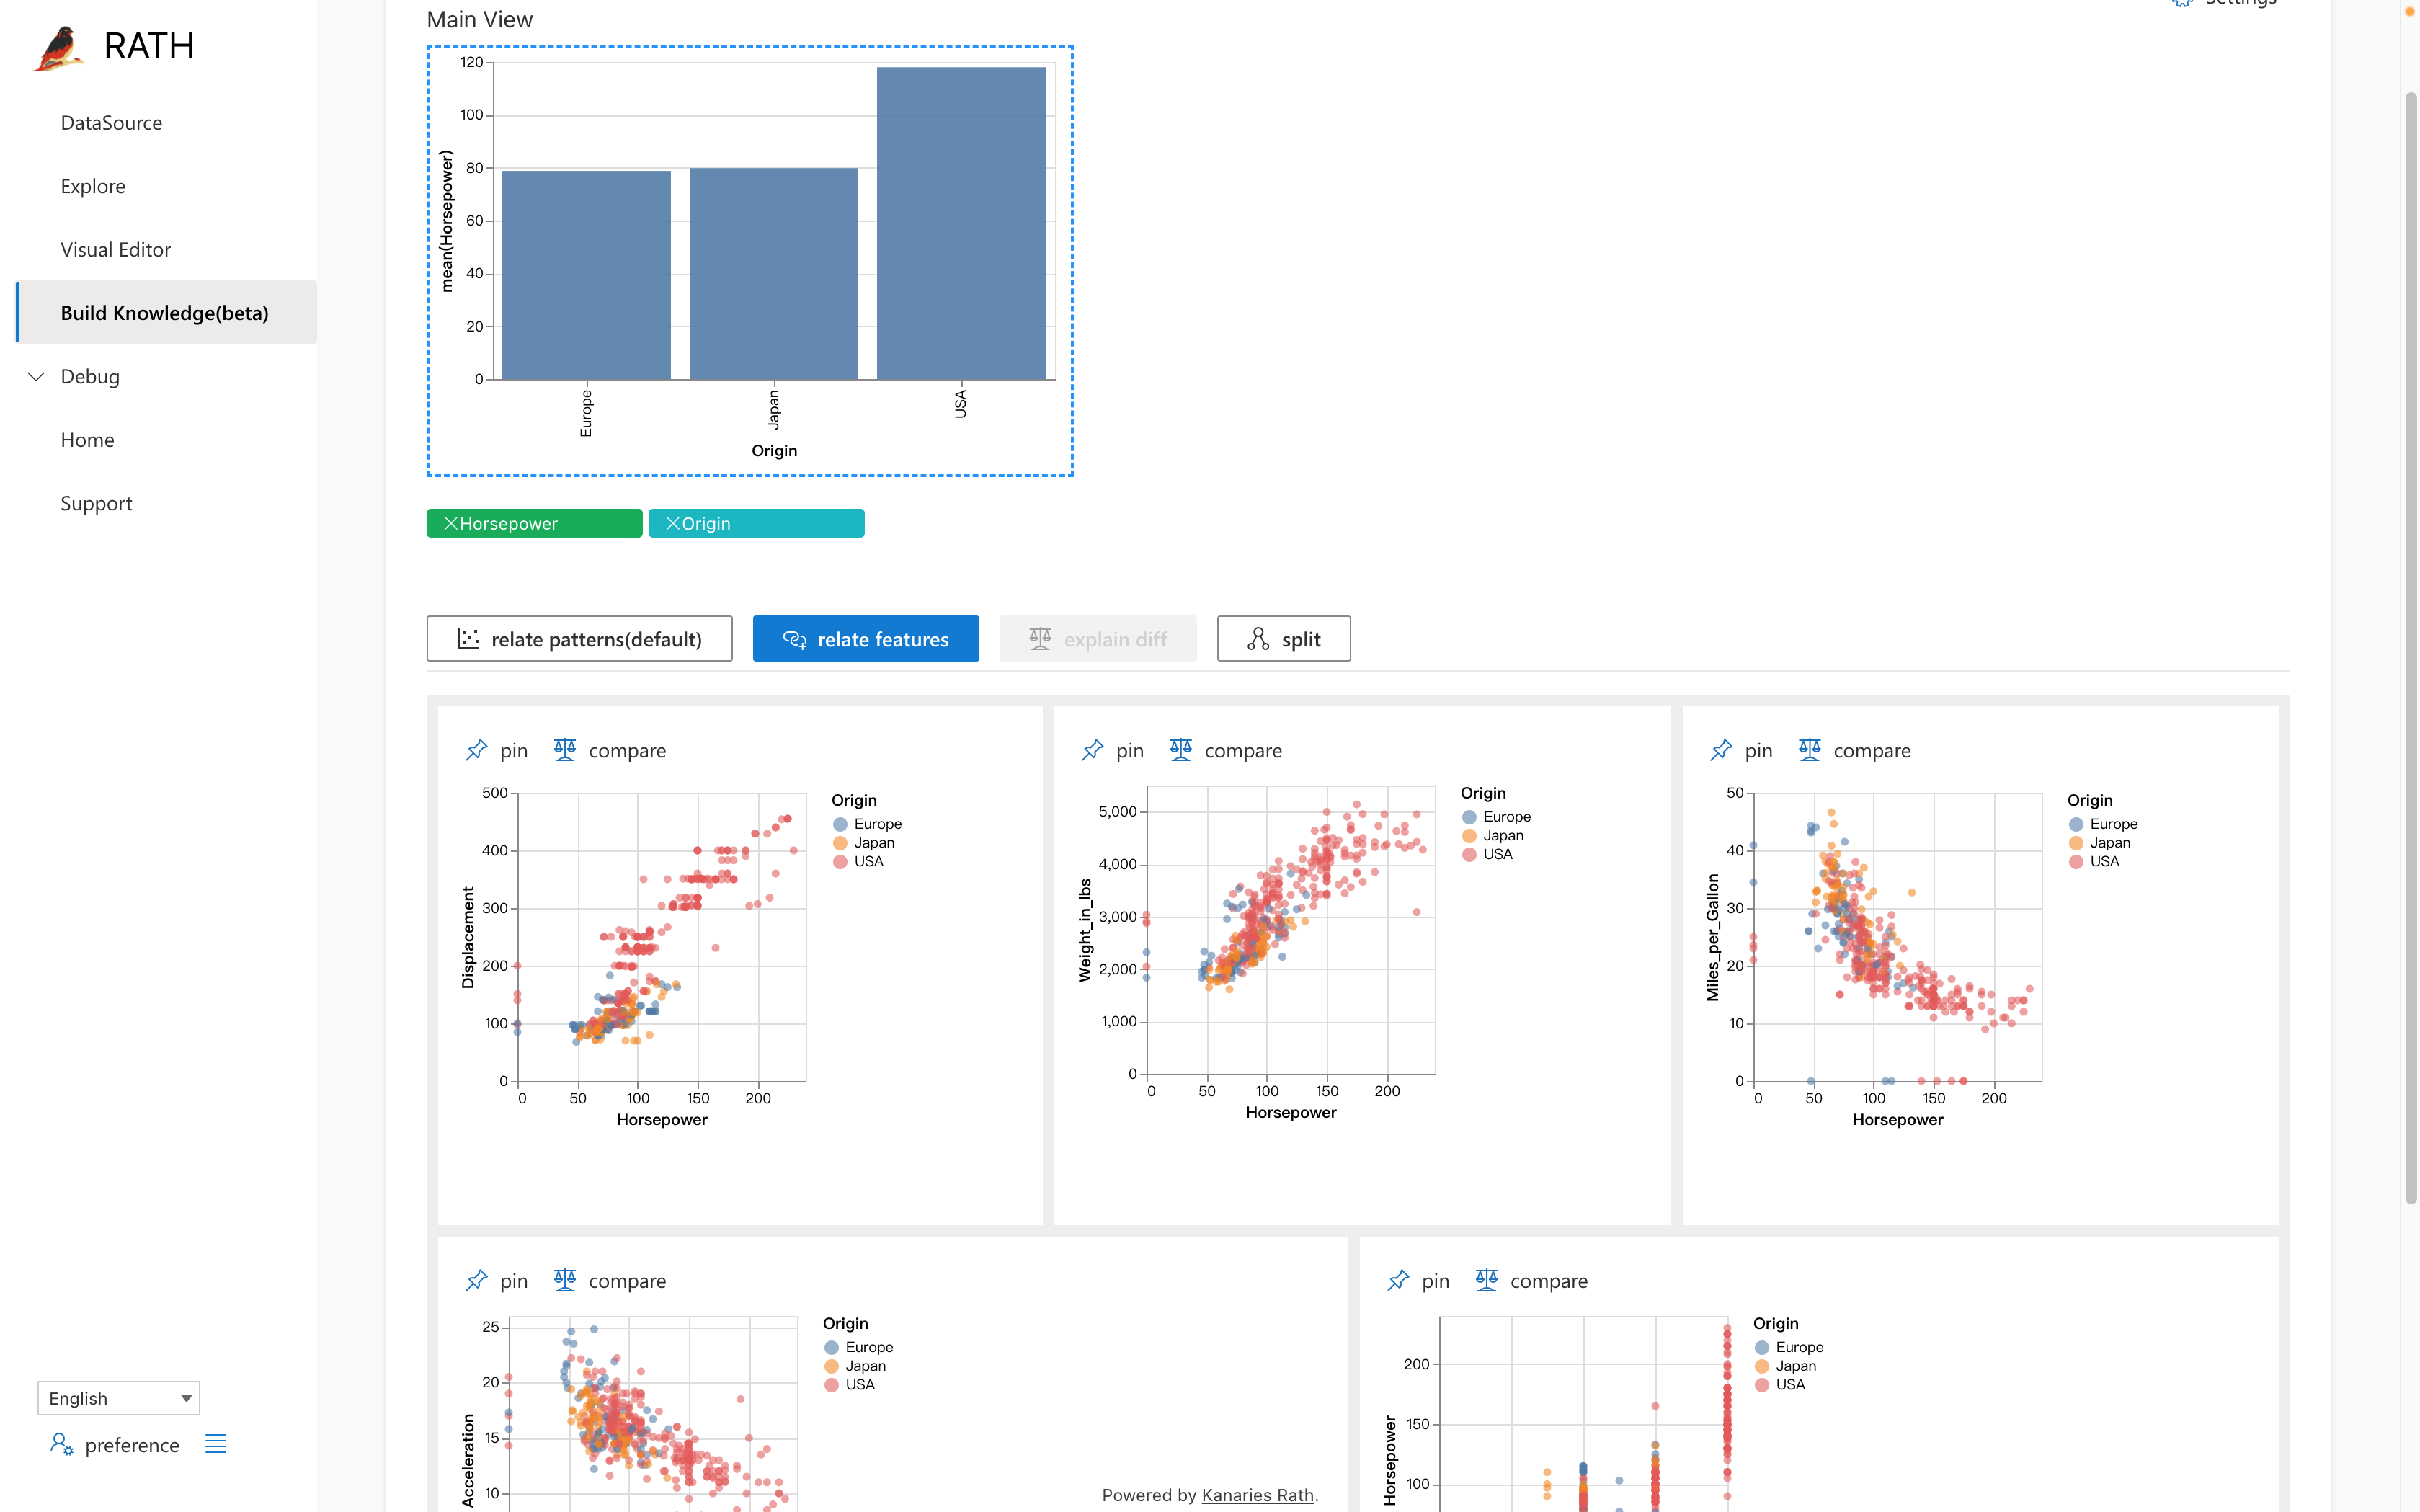
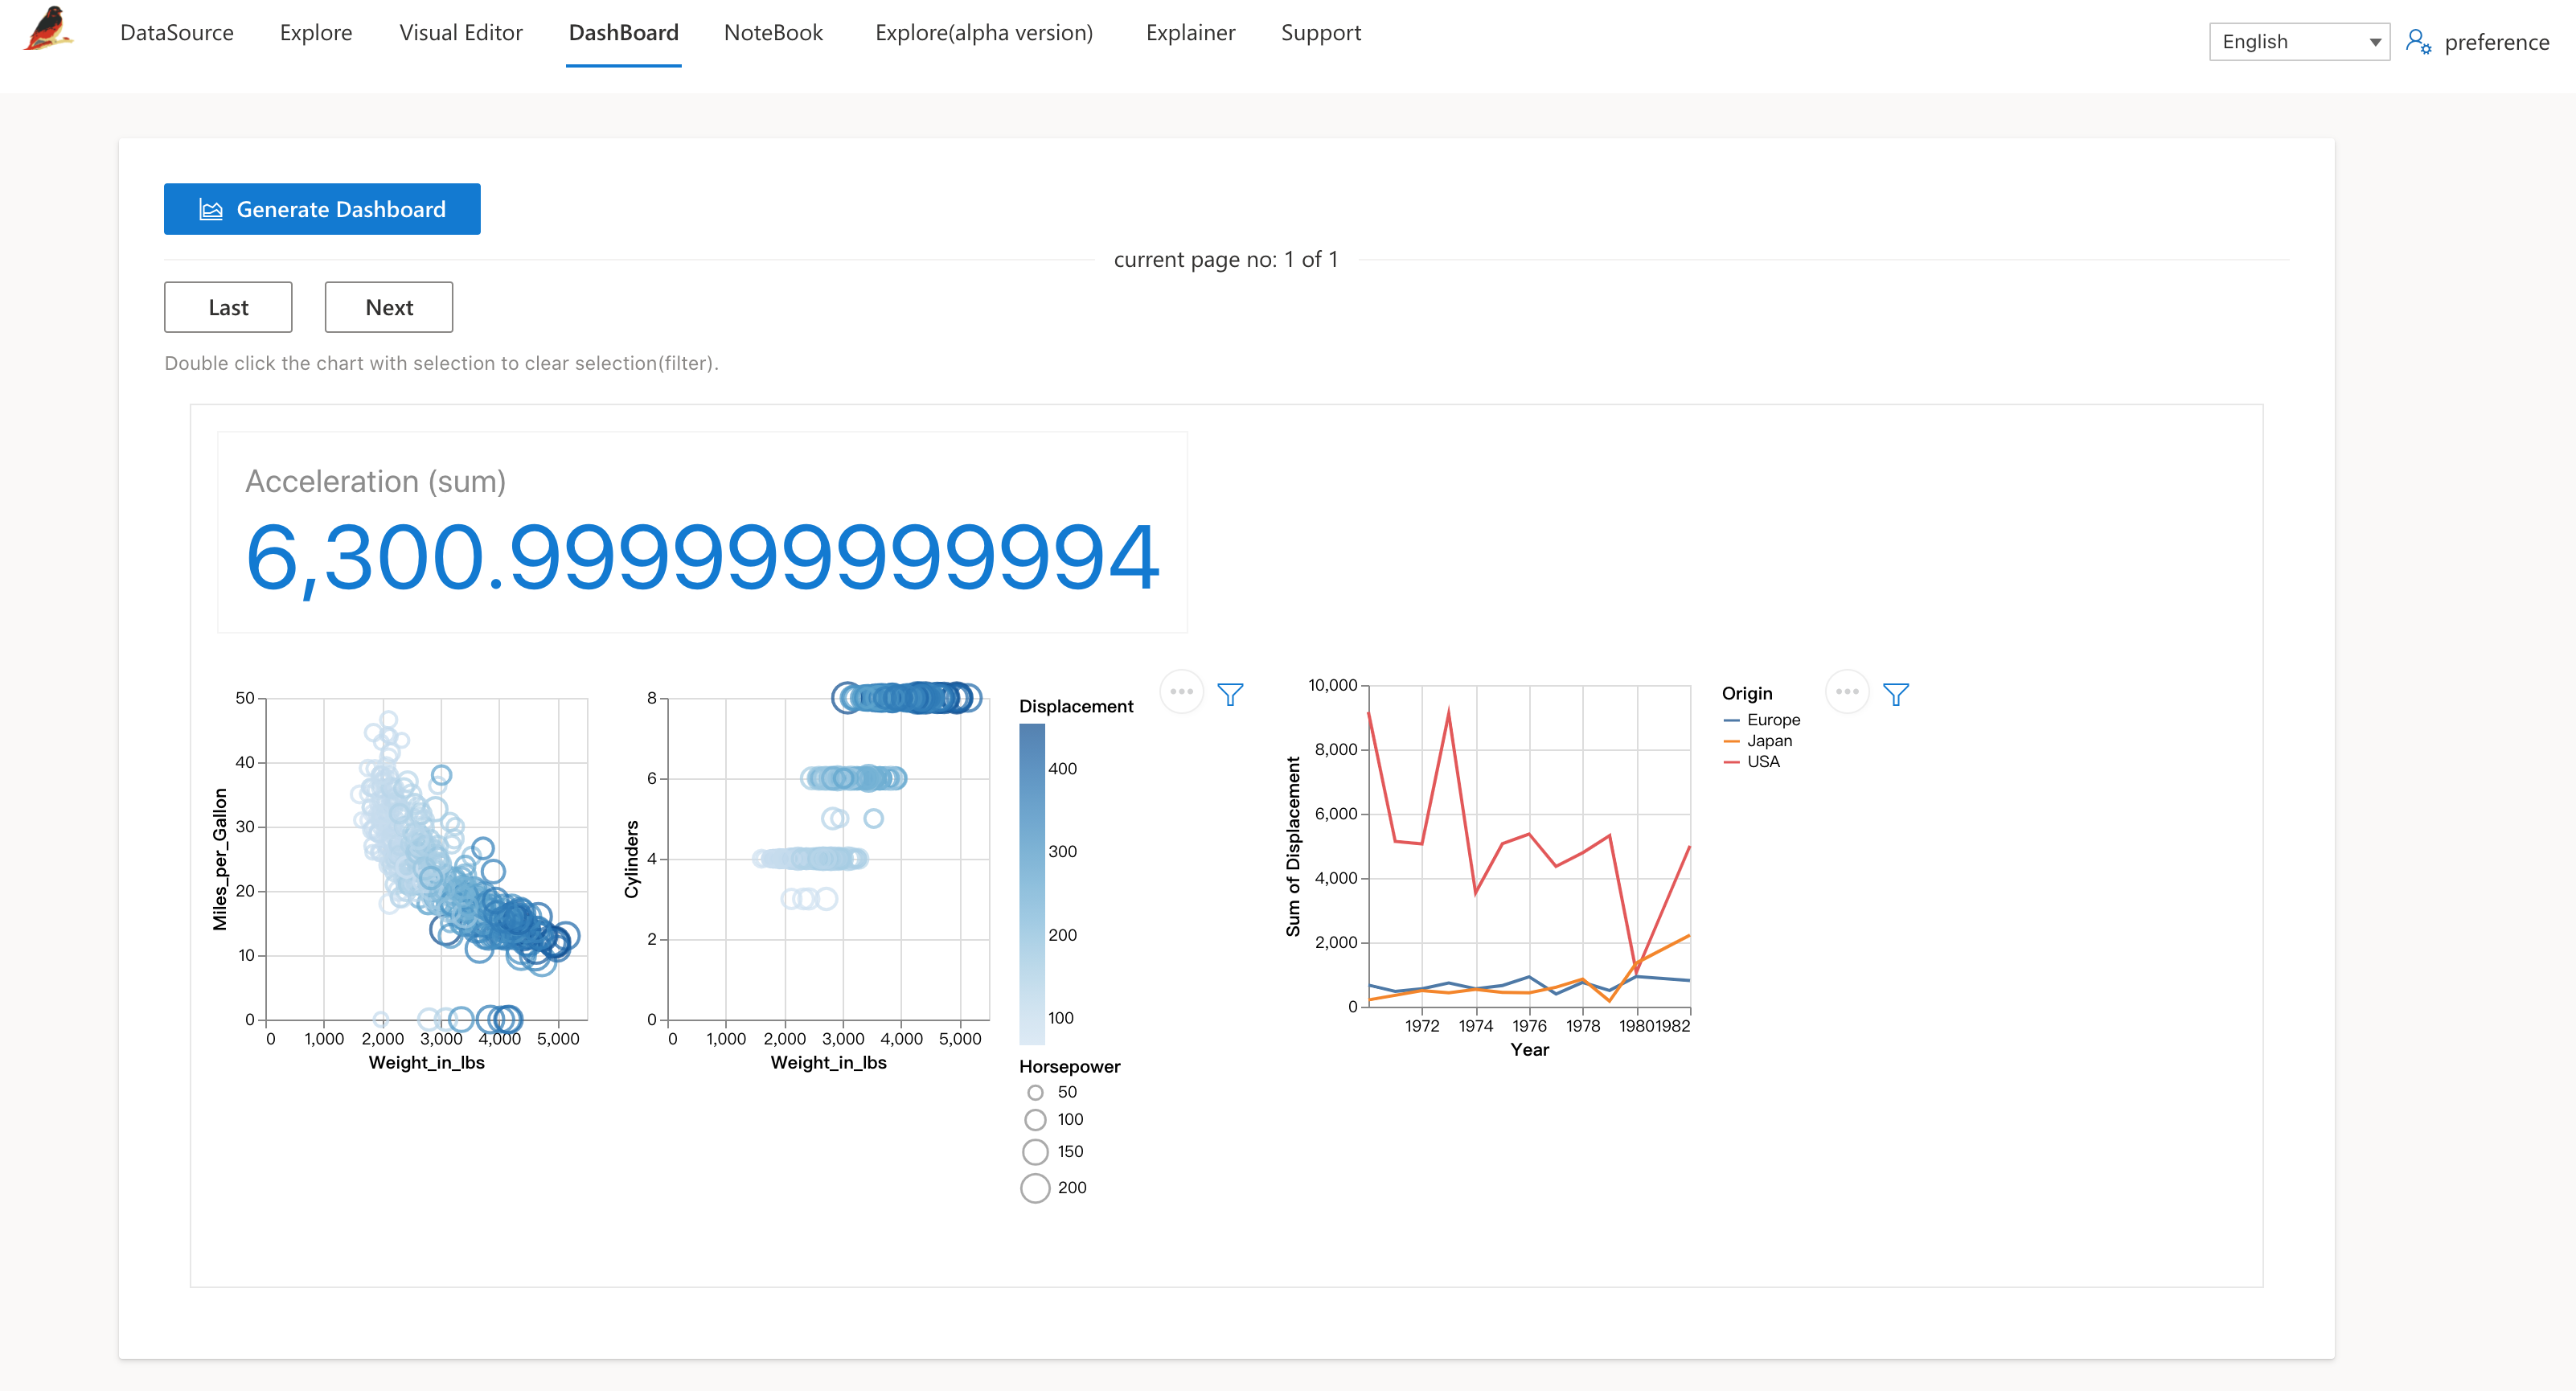
Generate interactive dashboards for your. Rath will figure out sets of visualizations of which contents are connected to each other and can be used to analysis a specific problem.
Notebook is a board for user to know what happened in the automatic analysis process and how rath uses visual-insights. It shows how decisions are made by the application and provide interactive interface to adjust some of the parameters and operators used by the algorithm.
Explainer uses several insight discovery algorithm to detect what is the specific insight type is shown in a visualization recommended. Explainer is an extension of B. Tang 's Top K insight paper[4].
You can also use Graphic Walker as a lite tableau style analysis app independently. It can be used as an independent app or an embedding module.
more details can be found in README.md in graphic-walker folder.
Details of the test result can be accessed here
Rath now runs all the computation tasks on webworker. For some large dataset, Rath will use indexdb to avoid too much memory cost of browser. For larger dataset(>100MB), Rath can put some of its computation to computation engine support SQL query(such as clickhouse). If you are interested in a server version, check the older version or contact us.
- Tutorial: Using Rath to find deep insight in your data
- doc for reuseable hooks: todos
Rath is an automated data analysis and visualization tool (auto-EDA).
Copyright (C) 2019-now Observed Observer(Hao Chen)
This program is free software: you can redistribute it and/or modify it under the terms of the GNU Affero General Public License as published by the Free Software Foundation, either version 3 of the License, or (at your option) any later version.
This program is distributed in the hope that it will be useful, but WITHOUT ANY WARRANTY; without even the implied warranty of MERCHANTABILITY or FITNESS FOR A PARTICULAR PURPOSE. See the GNU Affero General Public License for more details.
You should have received a copy of the GNU Affero General Public License along with this program. If not, see https://www.gnu.org/licenses/.