What do Cell Painting features mean?
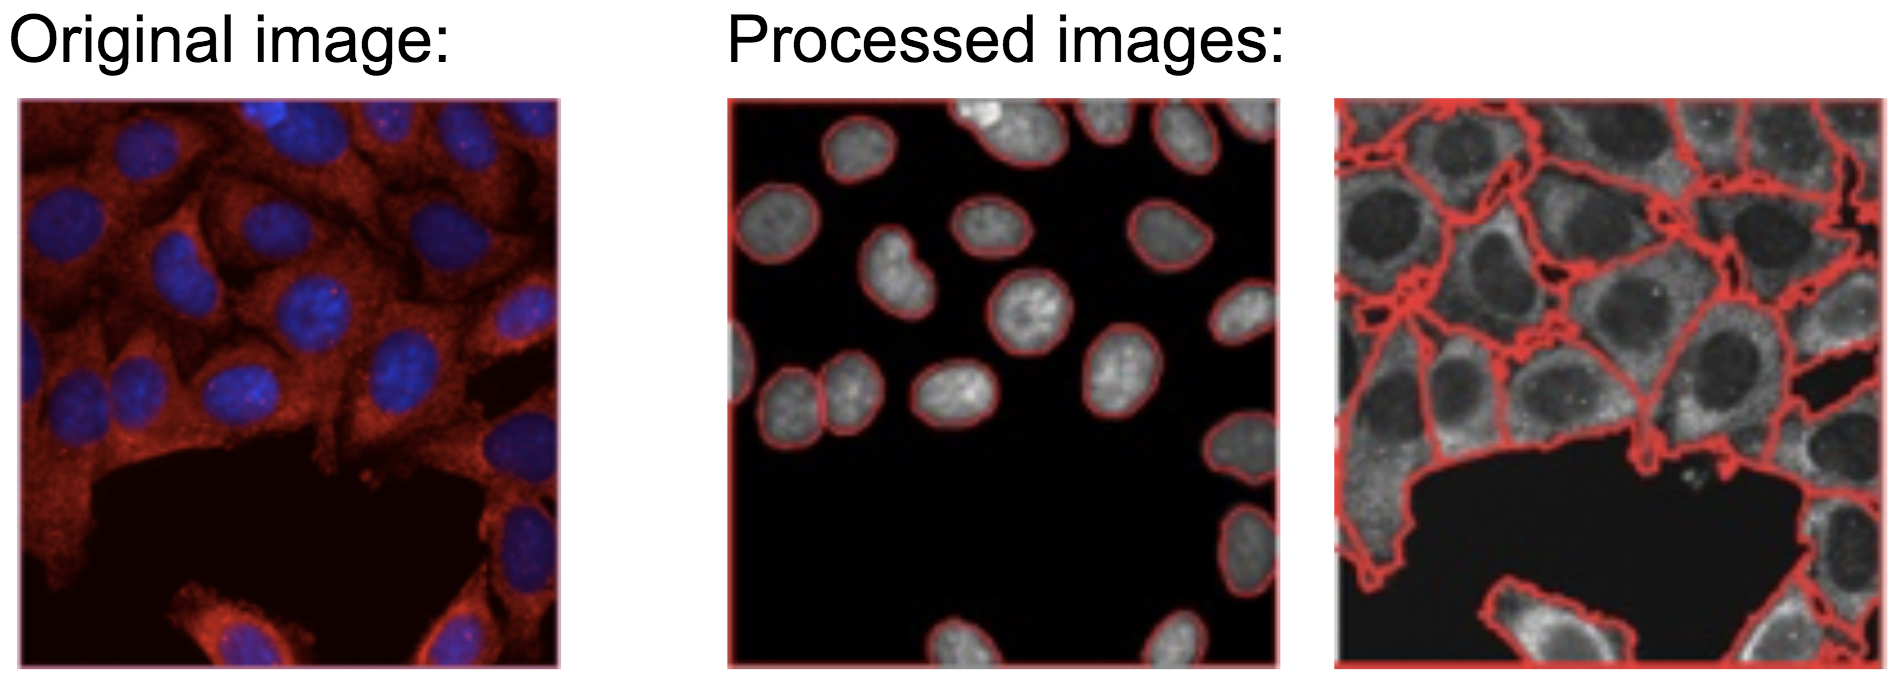
Cellular morphology is quantified by extracting features from images of cells using the CellProfiler software.
Unlike in the 2-color example above, in the Cell Painting assay, there are 5 imaged channels (that is, 5 colors in “Original image”):
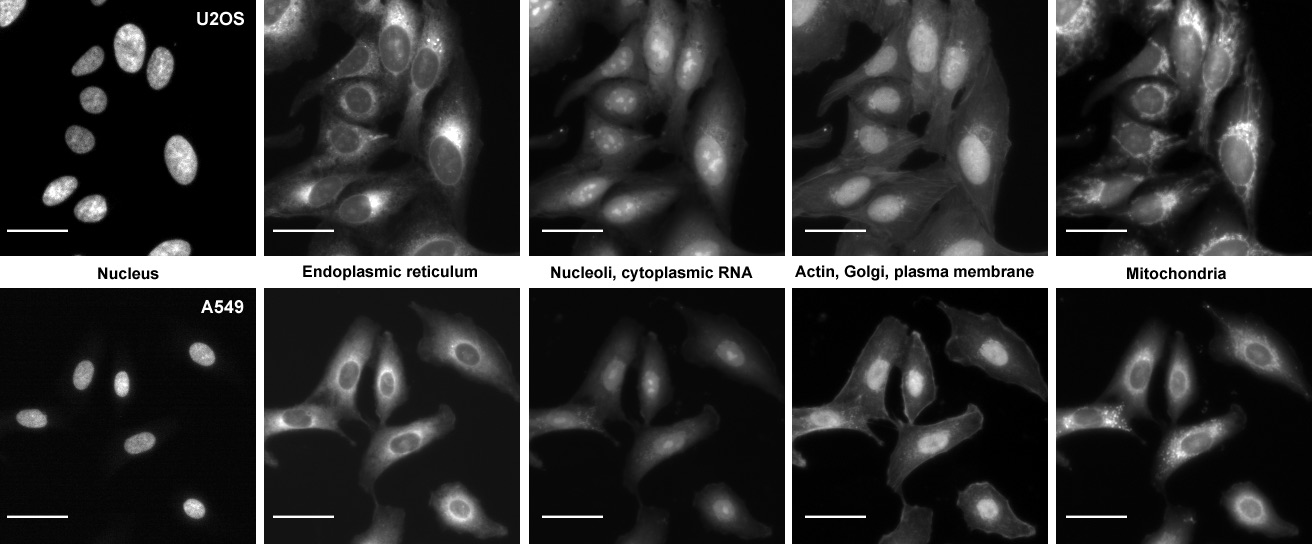
The Cell Painting assay in U2OS and A549 cells. The columns display the five channels imaged in the Cell Painting assay protocol (left to right) as imaged using the ImageXpress XLS microscope: Hoechst 33342 (DNA), concanavalin A (endoplasmic reticulum), SYTO 14 (nucleoli and cytoplasmic RNA), phalloidin (actin) and WGA (Golgi and plasma membrane), and MitoTracker Deep Red (mitochondria). Scale bars, 20 µm. From Bray et al. 2016
Cell Painting feature names take the general form [Compartment]_[FeatureGroup]_[Feature]_[Channel]_[Parameters] (described in the manual section on the topic). Not all features have Channel information e.g. shape features, which relate only to the outlines of the cellular compartments. Few features have Parameters, described in below.
- There are 5 image channels - DNA, RNA, ER, Mito (for mitochondria), AGP (for actin, golgi, plasma membrane)
- Image channels are described here
- The list of Cell Painting 1783 features is here. Here's how the features are distributed across channels. DNA has fewer features because some features are calculated only in the Nuclei compartment.
| Channel | n |
|---|---|
| DNA | 355 |
| AGP | 387 |
| ER | 387 |
| Mito | 387 |
| RNA | 387 |
Note: Because certain feature groups (Correlation) combine pairs of channels, the sum of n in the table above is greater than 1783.
- There are 3 compartments identified using CellProfiler - Cells, Cytoplasm, Nuclei
- Nuclei are identified using the DNA channel (see example above)
- Cells are identified using the RNA channel (see example above)
- Cytoplasm is defined as the compartment obtained by removing the Nuclei from the Cells compartment
- Here's how the features are distributed across compartments.
| Compartment | n |
|---|---|
| Cells | 596 |
| Cytoplasm | 582 |
| Nuclei | 605 |
- There are 7 feature groups - AreaShape, Correlation, Granularity, Intensity, Neighbors, RadialDistribution, and Texture
- Each feature group is measured using a CellProfiler measurement module. See the module documentation for details about the individual features
- AreaShape: MeasureObjectSizeShape
- Correlation: MeasureCorrelation
- Granularity: MeasureGranularity
- Intensity: MeasureObjectIntensity
- Neighbors: MeasureObjectNeighbors
- RadialDistribution: MeasureObjectRadialDistribution
- Texture: MeasureTexture
- "Location" features are generated by
-
MeasureObjectSizeShape (
Location_Center_{X|Y}) -
MeasureObjectIntensity (
Location_Center{Mass|Max}Intensity) -
IdentifyPrimaryObjects or IdentifySecondaryObjects (
Location_{X|Y})
-
MeasureObjectSizeShape (
- Here's how the features are distributed across feature groups
| FeatureGroup | n |
|---|---|
| AreaShape | 144 |
| Correlation | 300 |
| Granularity | 208 |
| Intensity | 225 |
| Location | 66 |
| Neighbors | 21 |
| RadialDistribution | 180 |
| Texture | 630 |
Some features have associated parameters, e.g.
-
Nuclei_AreaShape_Zernike_<p>_<q>: p and q are parameters of Zernike moments -
Cells_Texture_Variance_AGP_<scale>_<angle>: scale and angle are parameters used to calculate the gray level co-occurrence matrix, which in turns is used to calculate Texture features -
Cytoplasm_RadialDistribution_MeanFrac_RNA_<i>of<n>: radial distribution is calculated for each concentric ring. There are n rings in total, and i specifies the index of the ring