##Introduction SHEsisPlus is a open source software package for analysis of genetic association, Hardy-weinberg equilibrium, linkage disequilibrium and haplotype construction at multiallelic polymorphism loci, compatible for both diploid and polyploid species. The web-based version can be accessed via SHEsisPlus web version.
##What's new Compared to previous version of SHEsis, SHEsisPlus is compatitable for haploid, diploid and polyploid species. It can not only analyze case/control data, but also quantitative trait data. It provides various ways of P value adjustments, including Holm step-down, Sidak single-step, Sidak step-down, FDR and permutation tests. All these can be can be performed via the webui.
##Compile To build SHEsisPlus from source code, please first install Boost C++ Library. ###Linux Modify makefile to specify the locations of Boost include files and libs. Then type "make" in the souce code directory. ###Windows: Create a project in Microsoft visual studio. Add all the source files and header files EXCEPT unit test source files (*_test.cpp) to the current project. Modify the project properties and specify the path of Boost includefiles and libs. Then build it.
Note: SHEsisPlus is developed and tested under Linux. Its behaviour under Windows is not guaranteed. If you want to compile it under Windows, we recommand you to build it within Cygwin.
##Input format
###Case/control data
####Sample data for diploid species
id1  G A  C C  1 1  A1 A2
id2  A A  T C  1 1  A2 A2
id3  A A  T T  2 2  A3 A4
id4  0 0  T T  3 3  A5 A3
id5  G G  A A  2 3  A1 A2
id6  A A  C A  0 0  A6 A7
####Sample data for triploid species
id1  A G A  T C C  1 1 1  AA T  TT
id2  A A A  C T C  2 1 1  A  T  AA
id3  G A A  C T T  3 2 2  TT A  T
id4  0 0 0  A T T  3 3 3  AA T  AT
id5  G G G  T A A  1 2 3  TA TT T
id6  G A A  C C A  0 0 0  AA A  A
The first column is sample id. The following columns are genotypes. They should be deliminated by space, comma or tab. Adjacent tokens will be compressed and will be treated as a single token. Genotypes can be any string (e.g. 1,2,3,4, or A,T,G,C , or A1,A2,A3,A4, or anything else) except 0, which is the coding for missing genotypes.
The above shown is sample data for diploid and tripolid species. For diploid species, the columns correspond to: sample id, site1-allele1, site1-allele2, site2-allele1, site2-allele2, .... For triploid species, the columns should be: sample id, site1-allele1, site1-allele2, site1-allele3, site2-allele1, site2-allele2, site2-allele3, ...
###Quantitative trait data
####Sample data for diploid species
id1  20.6  G A  C C  1 1  A1 A2
id2  25.4  A A  T C  1 1  A2 A2
id3  23.1  A A  T T  2 2  A3 A4
id4  42.4  0 0  T T  3 3  A5 A3
id5  11.0  G G  A A  2 3  A1 A2
id6  5.5   A A  C A  0 0  A6 A7
####Sample data for triploid species
id1  1.1  A G A  T C C  1 1 1  AA T  TT
id2  3.2  A A A  C T C  2 1 1  A  T  AA
id3  14   G A A  C T T  3 2 2  TT A  T
id4  4.3  0 0 0  A T T  3 3 3  AA T  AT
id5  24   G G G  T A A  1 2 3  TA TT T
id6  4.49 G A A  C C A  0 0 0  AA A  A
The format for quantitative trait data is similar to that for case/control data except that the second column is the quantitative trait. The quantitative trait should be numeric.
##Arguments
###Allowed options:
  --help                produce help message
  --input arg           path for the input file containing both cases and
                        controls, can be specified for multiple times
  --input-case arg      path for the input file containing cases, can be
                        specified for multiple times
  --input-ctrl arg      path for the input file containing controls, can be
                        specified for multiple times
  --snpname-file arg    path for file that contains names of snps
  --snpname-line arg    snp names are as arguments
  --output arg          prefix of output files
  --report-txt          report results in plain-text format. By default,
                        results will be reported in html.
  --ploidy arg          number of ploidy
  --hwe                 perform Hardy-Weinberg disequilibrium test
  --assoc               perform association test, case/control analysis by
                        default. To perform quantitative trait loci analysis,
                        please specified together with --qtl.
  --qtl                 input phenotype is quantitative traits. input file
                        should be specified with --input, the second column of
                        the input file is the quantitative trait
  --permutation arg     times for permutation
  --haplo-EM            perform haplotype analysis using expectation
                        maximization algorithm
  --haplo-SAT           perform haplotype analysis using SAT-based algorithm
  --mask arg            mask of snps for haplotype analysis, comma delimited.
                        eg. mask=1,0,1 to use 1st and 3rd SNPs when there are 3
                        SNPs in all.
  --lft arg             lowest frequency threshold for haplotype analysis
  --ld-in-case          perform Linkage disequilibrium test in cases
  --ld-in-ctrl          perform Linkage disequilibrium test in controls
  --ld                  perform Linkage disequilibrium test in both cases and
                        controls
  --adjust              adjust p-value for multiple testing
  --webserver           Internal use for webserver
###example
./SHEsisPlus --input-case case.txt --input-ctrl ctrl-txt --snp-line "rs1,rs2,rs3" --output out --ploidy 2 --hwe --assoc --permutation 1000 --haplo-EM --mask "1,1,0" --ld-in-case --adjust
./SHEsisPlus --input qtl.txt --qtl --ploidy 3 --hwe --assoc --ld --haplo-SAT --lft 0.01 --permutation 10000
##Interpret output
###Binary phenotype
####Association test
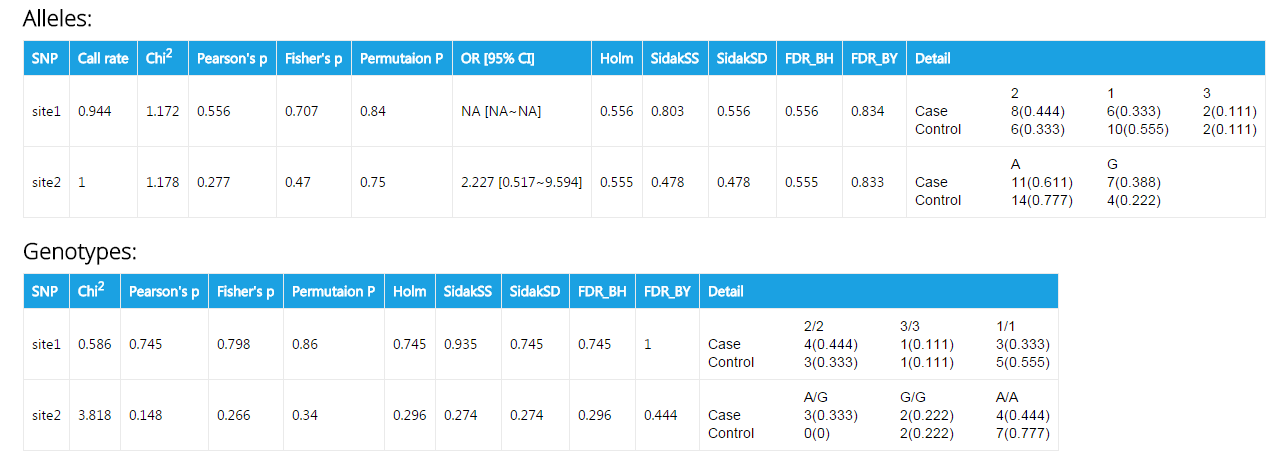
This is an exmple of output for case/control association analysis. The fileds are:
| Header | Explanation |
|---|---|
| SNP | Names of SNPs. Your can specify the them in the textfiled Marker names. If you don't provide them, or your input is invalid, SNP names will default to site1, site2, site3 ... |
| Call rate | The percentage of individuals with nonmissing genotypes |
| Chi2 | χ2 in Pearson's Chi square test |
| Pearson's p | p value calculated from Pearson's Chi square test |
| Fisher's p | p value calculated from Fisher's exact test |
| Permutation p | p value acquired from permutation test |
| OR [95% CI] | Odds ratio [95% confident interval]. Please note that this value is only presented when a site has two allele types. |
| Holm | Holm (1979) step-down adjusted p-values for strong control of the family-wise Type I error rate (FWER) |
| SidakSS | Sidak single-step adjusted p-values for strong control of the family-wise Type I error rate (FWER) |
| SidakSD | Sidak step-down adjusted p-values for strong control of the family-wise Type I error rate (FWER) |
| FDR_BH | adjusted p-values for the Benjamini & Hochberg (1995) step-up FDR controlling procedure |
| FDR_BY | adjusted p-values for the Benjamini & Yekutieli (2001) step-up FDR controlling procedure |
| Detail | The counts and frequencies of a specific genotype or alleles |
####Hardy-weinberg equilibrium test
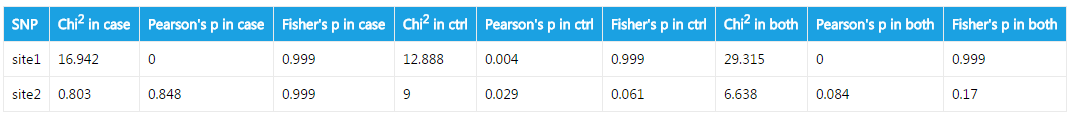
The output is straightforward. Hardy-weinberg equilibrium is calculated in cases, in controls, and in both cases and controls. Both Pearson's chi square test and Fisher's exact test are performed.
####Haplotype analysis
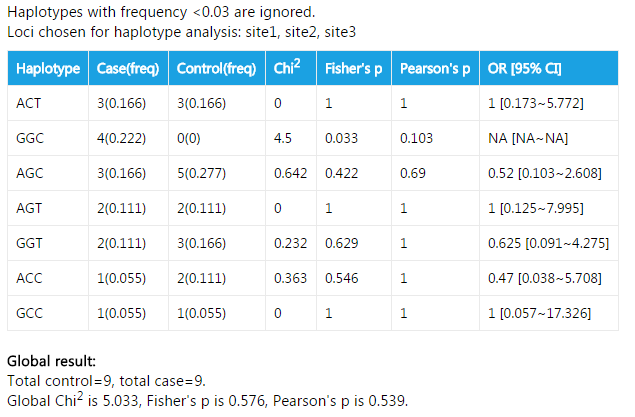
In this example, haplotypes with frequency <0.03 are discarded. 0.03 is the default value. You can change this value by option --lft. The fields in the table are also easy to understand. Apart from association test for every single haplotype, a global result is also given. This result shows if the haplotype distribution is different between cases and controls.
####Linkage disequilibrium analysis
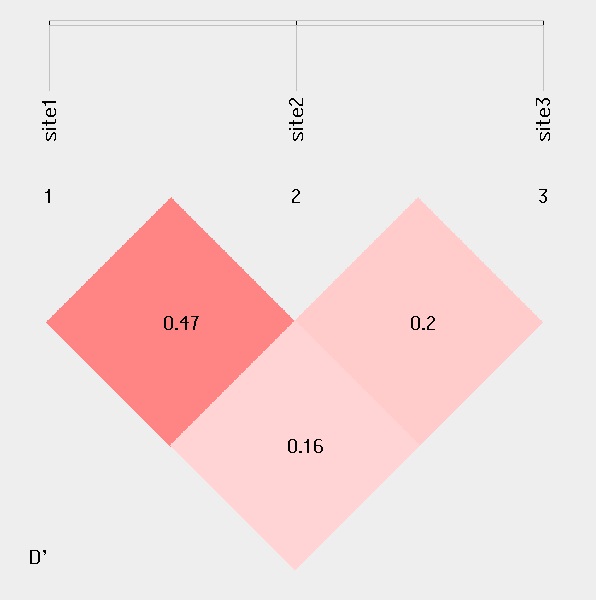
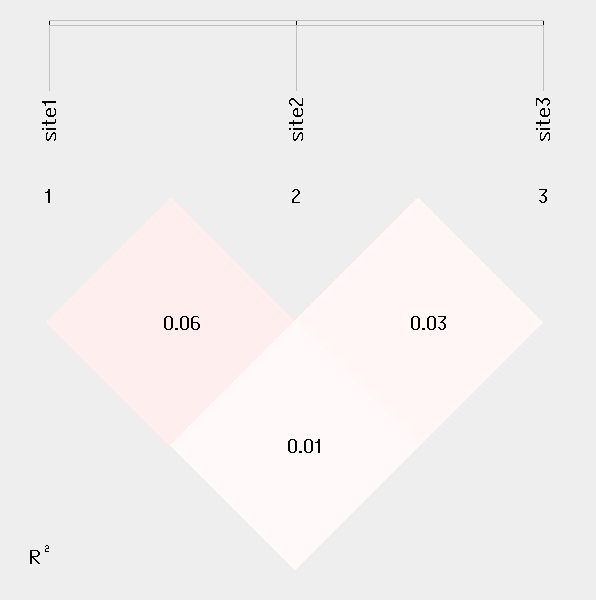
For linkage disequilibrium analysis, pair-wise D' and R2 are calculated. The higher two loci are in linkage disequilibrium, the darker the color will be.
###Quantitative trait
####Association test
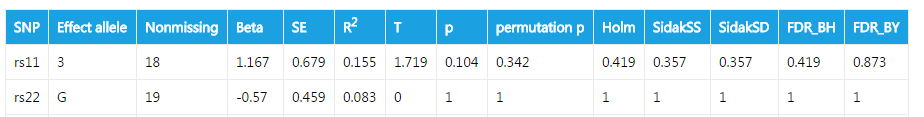
This is an exmple of output for case/control association analysis. The fileds are:
| Header | Explanation |
|---|---|
| SNP | Names of SNPs. Your can specify the them in the textfiled Marker names. If you don't provide them, or your input is invalid, SNP names will default to site1, site2, site3 ... |
| Effect allele | Contributing allele. For biallelic species, the effect allele is the minor allele. For multiallelic species, the effect allele is the allele that gives the lowest p value. |
| Nonmissing | Number of non-missing individuals included in analysis |
| Beta | Regression coefficient |
| SE | Standard error |
| R2 | Regression r-squared |
| T | Wald test (based on t-distribtion) |
| p | Wald test asymptotic p-value |
| permutation p | p value acquired from permutation test |
The following fields have been described before.
####Hardy-weinberg equilibrium test
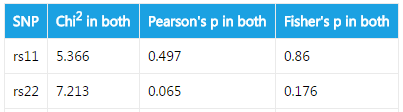
For quantative trait, Hardy-weinberg equilibrium test in all samples are carried out.
####Haplotype analysis
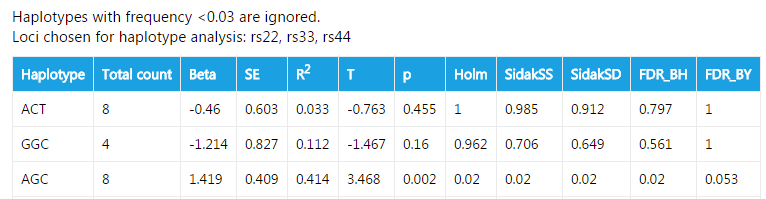
For quantitative trait, linkage disequilibirum is calculated in all samples. The results are similar to that of case/control data.
##References:
[1] Neigenfind J1, Gyetvai G, Basekow R, Diehl S, Achenbach U, Gebhardt C, Selbig J, Kersten B.Haplotype inference from unphased SNP data in heterozygous polyploids based on SAT. BMC Genomics 2008 Jul 30;9:356. doi: 10.1186/1471-2164-9-356.
[2] Purcell S1, Neale B, Todd-Brown K, Thomas L, Ferreira MA, Bender D, Maller J, Sklar P, de Bakker PI, Daly MJ, Sham PC.PLINK: a tool set for whole-genome association and population-based linkage analyses. Am J Hum Genet 2007 Sep;81(3):559-75. Epub 2007 Jul 25.
[3] Hedrick PW. Gametic disequilibrium measures: proceed with caution. Genetics 1987 Oct;117(2):331-41.