Purpose: use weather data from stations geographically located nearby major U.S. cities to forecast stock market returns of various industries' companies.
Weather data source: GHCN-daily database by the NOAA (ftp://ftp.ncdc.noaa.gov/pub/data/ghcn/daily)
Before downloading ftp data make sure to review Bash scripts and envirnonment setup.
$ cd data
$ for i in {1980..2014}; do wget ftp://ftp.ncdc.noaa.gov/pub/data/ghcn/daily/by_year/$i.csv.gz; doneEach YYYY.csv has the following comma-delimited schema:
Station, YYYYMMDD, Data_Type, Data_Value(s)
The mngr, pivotfile, scripter, and dataMaker scripts all transform this data into individual csv files per station separated by tab with the following pivoted schema:
YYYY-MM-DD, TMAX, TMIN, SNOW, SNWD, PRCP
These correspond with the five core elements of ghcn-data:
- TMAX = Maximum Temperature (tenths of ºC)
- TMIN = Minimum Temperature (tenths of ºC)
- SNOW = Snowfall (mm)
- SNWD = Snowdepth (mm)
- PRCP = Precipitation (tenths of mm)
Prepare the station location file:
wget ftp://ftp.ncdc.noaa.gov/pub/data/ghcn/daily/ghcnd-stations.txt
grep "^US" ghcnd-stations.txt > stations.txt
Download the pyscript haversine in and setup environment
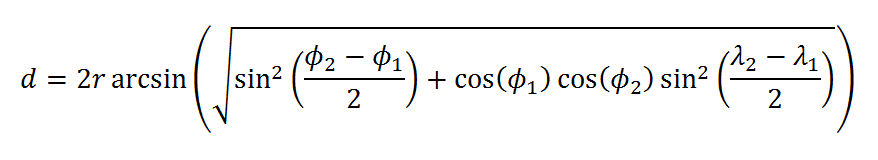
We use the haversine distance formula to calculate approximate distance between stations and the major cities. The haversine formula takes longitude and latitude of locations to estimate distance using the radius of the earth as a weight.
These are the coordinates:
- New York City = 40.65, -73.78
- Chicago = 41.98, -87.90
- San Francisco = 37.62, -122.38
- San Diego = 32.73, -117.17
- Los Angeles = 33.93, -118.40
- Atlanta = 33.65, -84.42
Use the scripts in the geography repo for easy preparation. After running the wrapper each city's stations are compiled in a folder corresponding to that city's abbreviation. This process also creates a new station location file that includes the station's distance to city in miles.
Currently we are using Pandas Dataframes in IPython notebooks to load station data as side-by-side columns in a city frame. But as of now there are too many stations for accurate analysis. Right now we are working on using various conditions to filter through stations per city. These parameters include:
- Missing data per date (NaN)
- Scrappy data (TMIN & TMAX = 0)
- Number of rows per station (indicates number of weather readings)
Stock Data Source: Historical Quotes
(http://finance.yahoo.com)
Using the same pandas dataframe process as the weather data loading, we included the stock data per file in a dataframe with the following schema: Date, Open, High, Low, Close, Volume
We use correlation matrices to determine the relationship between each station corresonding to a particular city.
The correlations depict whether particular station(s) were not similar to their peer stations.
For a full set of correlation matrices, check out the "Correlation Matrices~" file
Within the scripts page of the document, we provide an example IPython notebook of our design. Starting with ETL, we use scikit modules of GridSearch and various regressors to determine the optimal regression. We hope our sample code will illuminate our conceptualization more!