
1. Introduction
2. Classifier
3.2 Model Efficiency
6. Validation
7. Reference
8. Misc
8.1 Demo
8.3 To-do List
8.4 Updates

Fig.1 Flow Chart of Rainfall Camera
- Model Description:
The model built for classifying rainfall images is SVM, which in general, seperate datapoints with hyperplanes. The reason why we build a relatively light model is for the sake of computational time. The simplest and robust way is what we seek for.
- Data Acquisition:
To build such machine-learning model, we still need information to train it. With four categories we want to specify, 100 images inside each category are selected from the streaming videos. Image size to train is confined with (300,300).
- Information to support:
With data, how can we translate image into useful information that we can feed into SVM? By considering the characteristics during night, rainy days, heavy rainfall and sunny days, I came up with five informative descriptions: contrast, brightness, sharpness, hue and saturation.
- Return:
After implementing this classifier, we are able to get a assigned probability of each category for single image.
Follow the pipeline, we emphisize on how to extract the rainfall intensity. In this method we describe, we feed the classified rainy image denoted as R into 4 times pretrained recurrent neuron network to get the original de-rained image O. By simple substracting and binary thresholding, we are able to get rainfall streaks S for analysis. But according to experiment, some images still quite messy under the condition that the moving trees and some hight pixel values give a false signal. In order to safeguard the following calculation process, we need to provide more accurate rainfall streaks. By achieving this, we decompose S with PCA and analyse the morphology of rain streaks etc. the shape of rain streak, the width of the rain streak, the orientation of the rain streak. With provided constraints, the output purified image will eventually put into Allamano algorithm.

Fig.2 Pipeline of normal rainfall process
1. RNN

Fig.3 Overview of RNN model (Progressive Image Deraining Networks: A Better and Simpler Baseline)
2. Allamano Algorithm
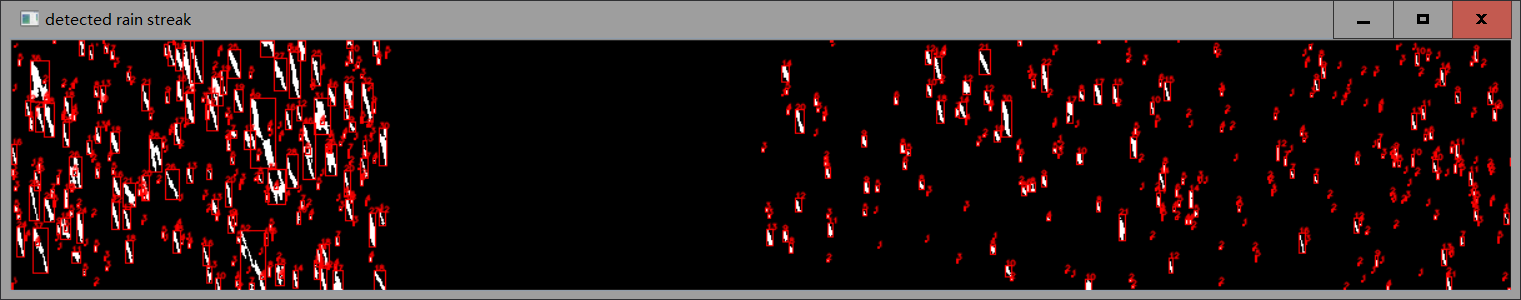
Fig.4 Example of delineated rain streaks
Allamano Algorithm is used for evaluating the rainfall intensity, the philosophi behind is control volume approach to count rain drops inside the defined bounding box, and calculate rainfall terminal velocity etc.
an event on 2018.12.08 demonstrates the accuracy of this series of images.

Fig.5 Event 2018.12.12 at H2i, Singapore
| Object | Total Elapsed Time | Average Elapsed Time per Image | GPU_CPU | Cores or Threads |
|---|---|---|---|---|
| 2018.04.01 | 1.12 hours | 1.30 seconds | GPU | 8 |
| 2018.12.08 | 0.45 hours | 0.91 seconds | GPU | 8 |
| 2018.12.11 | 0.71 hours | 1.03 seconds | GPU | 8 |
| 2018.12.12 | 1.15 hours | 1.34 seconds | GPU | 8 |
So far, we are limited by the data available to supervise a model towards the "correct" path
will add once more data can be aquired
Some modern techniques goes here.
We have three data sources to validate our camera accuracy, first are three radars located in the northern, eastern and western part of Singapore. Another sources are 83 rain gauges densely distributed in Singapore. To bear in mind, the nearest rain gauges is still 300 meters away, and radar averages surroundings by 700 meters by 700 meters median filter. These two biases indicate that none of the two are convincible, and no updates will be given before some in-site measurement is placed right with camera.

Fig.6 Time Series Plot of One Event

Fig.7 Cumulative Time Series Plot of One Event

Fig.8 Time Series Plot of One Event

Fig.9 Cumulative Time Series Plot of One Event

Fig.10 Time Series Plot of One Event

Fig.11 Cumulative Time Series Plot of One Event

R. Dongwei, Z. Wangmeng etc. (2019) Progressive Image Deraining Networks: A Better and Simpler Baseline
R. Martin and M. Frank (2008.) Classification of Weather Situations on Single Color Images
P. Allamano, A. Croci, and F. Laio1 (2015) Toward the camera rain gauge
In the api folder, there is a simple demo classifying an image and extract the rainfall intensity with built Flask backend
python api.py a local server should be set up at port 8000, in your browser, enter in localhost:8000, then the interface will pop up as

Fig.5 Snapshot of the local server
A real time model is running with in local network. During the experiment, the latency between calculation and real situation is around 10 seconds in a rainy event on CPU, while 2-3 seconds on local GPU (Nvdia GTX 960M). in a rain-free day, it is nearly running real-time without latency for classification.
I made SMS alert when heavy rain approaches because we need data to build the regression model. Now we are scarce of heavy rainfall data.
- build dask task manager
- add classifier
- Flask server
- Host on cloud
- add regression model for heavy events with raw local radar rain rate
- night image processing
- GUI
- add visualization
- add computational time table
- GPU version(convert all dask array to torch array and hard code torch version SVM)
- Validation with radar and rain gauges
- regression model for low-resolution video
2019.6.19 add three validation events
2019.4.24 Optimize codes to speed up.
2019.4.22 Flask local server to classify image
2019.4.19 add visualization.py
2019.4.18 optimized code and retrained model
2019.4.17 dask implementation
2019.4.15 trained a classifier model