This project is a fork of code available here.
The aim of this project is to provide a simple method for designing and deploying optical mark recognition for automatically reading form data from surveys, exams and other paper objects with checkboxes.
To run the software you will need to know how to run a python script (see below installation instructions) but don't really need coding skills beyond that.
We found that making a new template for each survey was a messy and difficult process that required lots of editing of JSON files, which most people don't get on with.
To address this, we've created a generic template that has 510 target boxes in a grid. By simply removing specific questions from the singles block of the template.json file, the system will scan all 510 boxes, but save only ones that map to where you specify.
In the inputs/generic folder, you'll find an example where the system scans and saves all results from fields 01-510
In the inputs/generic2 folder, the system scans all 510 fields, but saves only the ones linked to the boxes on the example form about school meals and menstruation. In the outputs/generic_example folder, you'll find a csv file with the results. The headers relate to the coordinates of the original 510 field grid, so to decode which column is which, you'll need to keep a key file such as the one in the templates/ folder.
To do this, we recommend using something like Affinity Designer, which is awesome and costs only about $50
Open the template to see where boxes can go. As you can see, the numbering runs from Q1 (top left) going down the columns and then right until Q510 (bottom right).

In the generic example, shown below, we use only some of the boxes so have deleted the ones we didn't want from the template file. You can add a load of text and images but
- don't put text or images too close to the edge marks
- or in lines of sight from one edge mark to another
- don't put any text or imagery inside the checkboxes that you want to use

the boxes in this survey relate to specific boxes on the template

and to tell the template.json only to capture those boxes, we simply add only those questions to the 'singles' section, leaving the rest of the JSON file as it was
  "Singles": [

"Q31",
"Q61",
"Q91",
"Q121",
"Q273",
"Q333",
"Q274",
"Q334",
"Q10",
 "Q11",
 "Q12",
 "Q13",
 "Q14",
 "Q15",
 "Q16",
 "Q17",
 "Q18",
 "Q19",
 "Q20"

  ],
Finally we can create a dummy 'complete' form and run the software to capture data

As you will see in the outputs folder, the software still scans all 510 positions and detects darker areas (i.e. marks) in non-relevant sections of the form (look around the photo)

but it captures only the ones we want in the csv file

Note that these results are sorted by question name and the column headers don't tell you which question is which box. You'll need to rename variables using a decode file (like the list above).
Here, Q12 is positive. Looking at our decode list, that tells us that it is week 3. Q61 is positive, meaning that the subject ate little today. Q273 is positive,
Note also that the way this works is that a field is either TRUE or NA. In downstream software (i.e. R) you'll want to replace NAs with FALSE. You may also need to do some funky stuff with variables. In the example we have four possible answers to the 'have you eaten today?' question, but the responses are stored in four separate answers. You'll need to mutate the data set to get a new variable that summarises which of the four answers are given. In R this would involve
- binding the variable names on to the generic question IDs
- using
case_whento mutate the data appropriately
The overall approach we've taken puts very little emphasis on fiddling around with the JSON files for the OMR stage and instead requires you to perform all the munging and data sanity stuff in more familiar software like R.
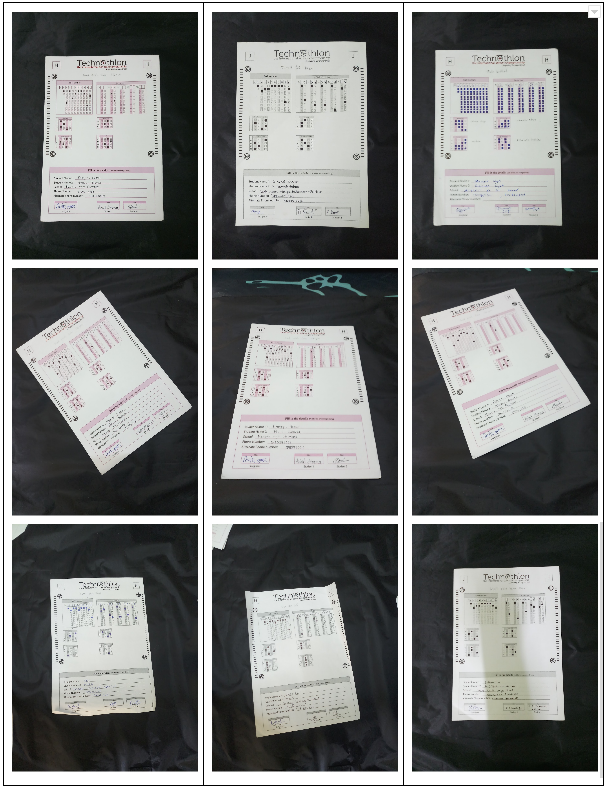
Once you configure the OMR layout, just throw images of the sheets at the software; and you'll get back the graded responses in an excel sheet!
Images can be taken from various angles as shown below-

See step by step processing of any OMR sheet:
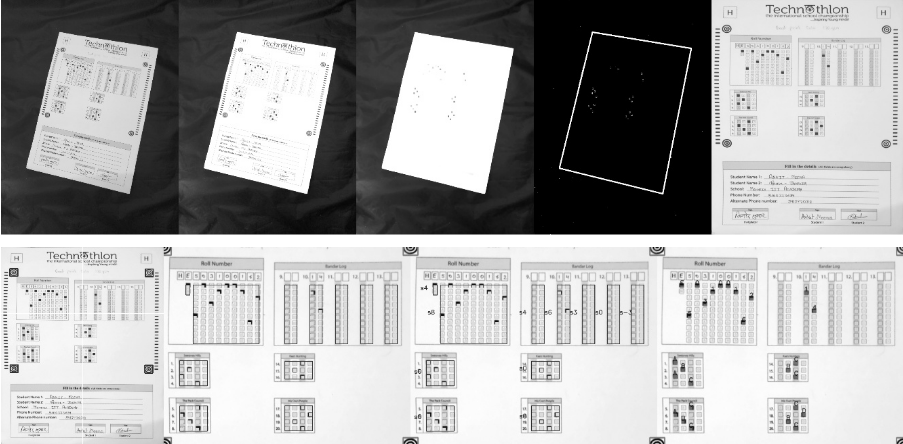
*Note: This image is generated by the code itself!*
Get a CSV sheet containing the detected responses and evaluated scores:
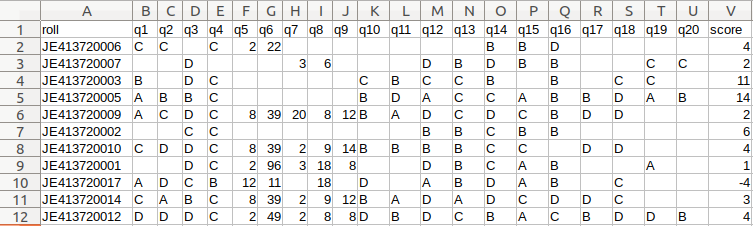
There are many more visuals in the wiki. Check them out here!
Operating system: OSX or Linux is recommended although windows is also supported currently.
Note: To get a copy button for below commands, use CodeCopy Chrome | CodeCopy Firefox.
Install opencv (Any installation method is fine.)
python3 -m pip install --user --upgrade pip
python3 -m pip install --user opencv-python
python3 -m pip install --user opencv-contrib-python
More details on pip install openCV here.
Installing missing libraries(if any):
Windows users may skip this step.
On a fresh computer, some of the libraries may get missing in event after a successful pip install. Install them using following commands(ref):
sudo apt-get install -y build-essential cmake unzip pkg-config
sudo apt-get install -y libjpeg-dev libpng-dev libtiff-dev
sudo apt-get install -y libavcodec-dev libavformat-dev libswscale-dev libv4l-dev
sudo apt-get install -y libatlas-base-dev gfortran
# Shallow clone - takes latest code with minimal size
git clone https://github.com/Udayraj123/OMRChecker --depth=1
Note: Contributors should take a full clone(without the --depth flag).
# cd OMRChecker/
python3 -m pip install --user -r requirements.txt
Friendly Note: If you face a distutils error in pip, use --ignore-installed flag in above command.
- First copy and examine the sample data to know how to structure your inputs:
cp -r ./samples/sample1 inputs/
# Note: you may remove previous inputs (if any) with `mv inputs/* ~/.trash`
# Change the number N in sampleN to see more examples
- Run OMRChecker:
python3 main.py
Each example in samples folder demonstrates different ways in which OMRChecker can be used.
- First create your own template.json.
- Configure the tuning parameters (help needed for documentation!).
- Run OMRChecker with appropriate arguments (See full usage).
python3 main.py [--setLayout] [--noCropping] [--autoAlign] [--inputDir dir1] [--outputDir dir1] [--template path/to/template.json]
Explanation for the arguments:
--setLayout: Set up OMR template layout - modify your json file and run again until the template is set.
--autoAlign: (experimental) Enables automatic template alignment - use if the scans show slight misalignments.
--noCropping: Disables page contour detection - used when page boundary is not visible e.g. document scanner.
--inputDir: Specify an input directory.
--outputDir: Specify an output directory.
--template: Specify a default template if no template file in input directories.
The template.json file describes the data collection form in a way that allows the software to look for marks in the right places, then to interpret them correctly as checked/unchecked.
The overall structure of the template is as a series of blocks or lists
"Dimensions": []
Describes the dimensions of the original form in pixels
"BubbleDimensions": []
Describes the dimensions of the checkboxes used in the form
"Options": {}
Tells the form whether to look for an edge marker and describes the width ratio between edge marker and form dimensions, for correct scaling.
"Concatenations": {}
Tells the form how to name and handle questions that should be saved in concatenated form
"Singles": []
Tells the form how to name and handle questions that have a single answer
"QBlocks": {}
Tells the form how to draw the various question blocks that will capture the marks
The dimensions of the original form, between the centres of the edge markers should be given in the form w,h
For a form with dimensions w = 1846, h = 1500 this would take the form
 "Dimensions": [
    1846,
    1500
  ]
The dimensions of the checkboxes should be given in the form w,h
For a form with boxes of dimensions w = 20, h = 30 this would take the form
 "Dimensions": [
    20,
    30
  ]
Stuff inside this block will put together data from multiple data-entry boxes on the form
format. For instance, the following will assign data to variable FOO by concatenating what's calculated from bar1, bar2 and bar3, all of which might look across several checkboxes.
"FOO": [
	"bar1",
	"bar2",
	"bar3"
	]
Stuff inside this block will put grab a single datum from a single data entry box, or from one of several boxes
For instance, the following will assign vairables called bar1,bar2 and bar3, then assign a datum from matching Qblocks defined later.
"FOO": [
	"bar1",
	"bar2",
	"bar3"
	]
The QBlocks tell the software where to look and what to look for.
Each QBlock has the basic format
  "Woo": {
      "qType": "AQUESTIONTYPE",
      "orig": [
        208,
        205
      ],
      "bigGaps": [
        115,
        11
      ],
      "gaps": [
        59,
        46
      ],
      "qNos": [
        [
          [
            "Medium"
          ]
        ]
      ]
    }
where
Woo is an arbitrary name for the QBlock
AQUESTIONTYPE maps to a predefined question type in the file template.py.
orig is the origin of the question boxes
gaps is the spacing between the left/upper edges of boxes of a single question the form w,h. i.e. add box size + gaps
qNos maps the boxes to a variable name in the concatenation or singles block.
bigGaps determines the gaps between the Qblocks
The basic format for defining a question is
    'QTYPE_FOO': {
        'vals': ['E', 'H','D'],
        'orient': 'V'
    }
where QTYPE_FOO is an arbitrary name that will be called from within the template.json file. See AQUESTIONTYPE above
orient determines whether the boxes map vertically (V) or horizontally (H)
vals is the list of values, i.e. mapping one-to-one with the boxes on the survey
Basic options here are for
discrete values
'vals': ['Yes','No','Unknown']
a range of n numerical values
'vals': range(10)
In the templates folder you'll find a template generic_form_with_edge_markers in a variety of formats.
The generic template provided is based on a survey form with dimensions of w210 x h297 mm (A4, portrain) and resolution of 72 dpi This is 2480.3 x 3507.9 px
The edge marker (target icons) are 100 x 100 px
Overall width ratio of the paper to edge marker is 2480.3/100 = 24.83
On the template.json file, the SheetToMarkerWidthRatio variable should be set to 24.83
The edge markers are oriented from the top left corner [0,0] and centres are positioned at
*top left [150,150] *top right [2280,150] *lower left [150,3350] *lower right [2280,3350]
The total workspace is therefore
w2130 x h3200 px
This project was born out of a student-led organization called as Technothlon. It is a logic-based international school championship organized by students of IIT Guwahati. Being a non-profit organization, and after seeing it work fabulously at such a large scale we decided to share this tool with the world. The OMR checking processes still involves so much tediousness which we aim to reduce dramatically.
We believe in the power of open source! Currently, OMRChecker is in an intermediate stage where only developers can use it. We hope to see it become more user-friendly as well as robust from exposure to different inputs from you all!

OMRChecker can be forked and modified. You are encouraged to play with it and we would love to see your own projects in action!
The only requirement is disclose usage of this software in your code.
It is published under the GPLv3 license.
This is a fork of work found here.
Most of the code was written by Udayraj Deshmukh and other people who are cited in the original project's readme doc. Props respect to the clever people who made this thing real.

Copyright © 2019-2020 Udayraj Deshmukh
OMRChecker : Grade exams fast and accurately using a scanner 🖨 or your phone 🤳
This is free software, and you are welcome to redistribute it under certain conditions;
For more details see LICENSE.