Created By Charunthon Limseelo, Microsoft Learn Student Ambassadors

This repository contains the code for the visualizations in David Spiegelhalter's "The Art of Statistics" book. The code is written in Python and I used some libraries that applies on my code on Jupyter Notebook, such as:
These libraries are the most used libraries in Data Science and Machine Learning. I used them to visualize the data and to make some statistical analysis. In this repository, I will try to visualize the data in the book and make some statistical analysis on it. Since the original visualization in the book is made by R, I will try to make the same visualization using Python and compare how the visualization looks like from what I made and from the book.
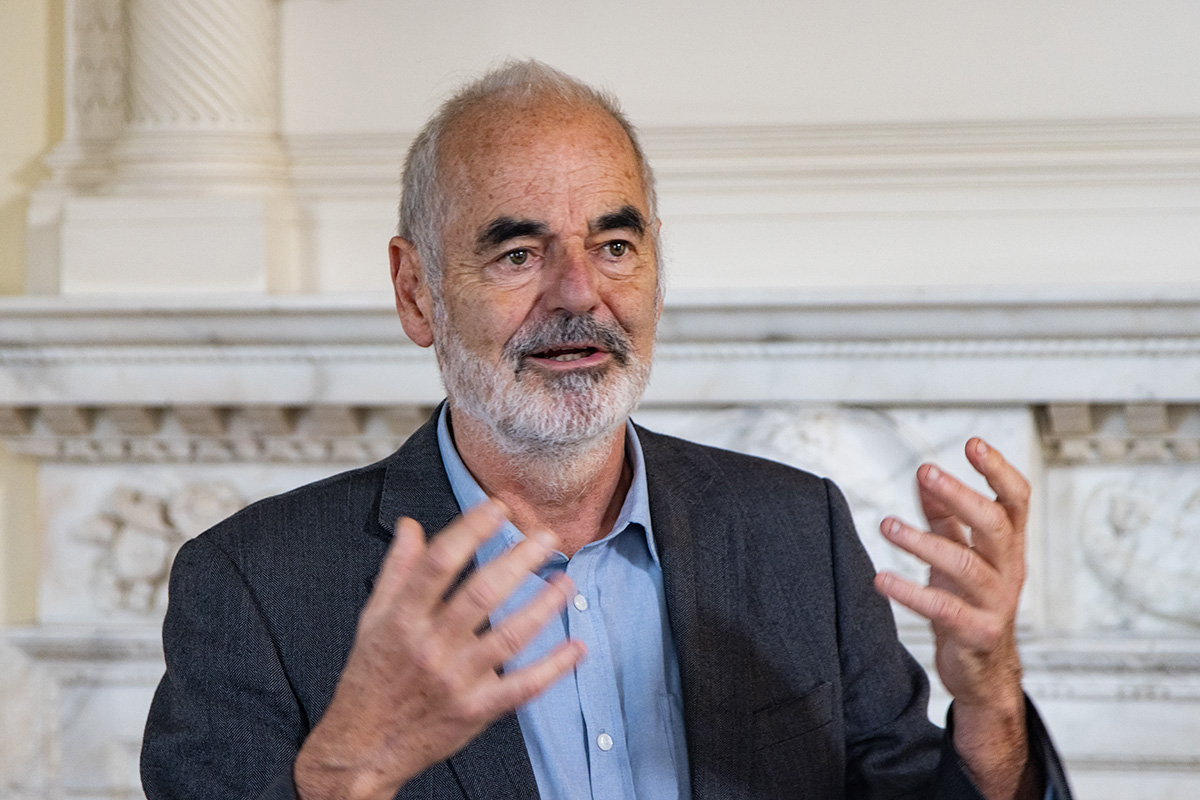
Sir David John Spiegelhalter OBE FRS (born 16 August 1953) is a British statistician and a Fellow of Churchill College, Cambridge From 2007 to 2018 he was Winton Professor of the Public Understanding of Risk in the Statistical Laboratory at the University of Cambridge. Spiegelhalter is an ISI highly cited researcher.
He is currently Chair of the Winton Centre for Risk and Evidence Communication in the Centre for Mathematical Sciences at Cambridge. On 27 May 2020 he joined the board of the UK Statistics Authority as a non-executive director for a period of three years.
This repository is divided into 2 parts:
- The code for the visualization, which is in ipynb file
- The data for the visualization, which is from .csv file
The code for the visualization is written in Jupyter Notebook. You can open the notebook using Jupyter Notebook or Jupyter Lab. If you don't have Jupyter Notebook or Jupyter Lab installed on your computer, you can install it by following the instructions here.
If you don't want to install Jupyter Notebook or Jupyter Lab, I will provide the link of Google Colab for each notebook so you can open it on Google Colab, in this coming soon.
For the original visualization in the book, you can visit on Sir David Spiegelhalter's GitHub repository here
I would like to send the appreciation for anybody who teaches me on various things that I used in this repository, even about mathematics, statistics, and programming. I would like to thank to:
- Sir David Spiegelhalter, for writing the book and for the original visualization in the book.
- Sirisa Kornnawawat, for giving me the inspiration to make this repository, and the pathway of learning data science and data engineering.
- Microsoft Learn Student Ambassadors, for giving me the opportunity to learn more about data science and data engineering.