- Update to CesiumJS 1.95
- Power and Confidence range sliders have been updated to reflect data output by the KrakenSDR software.
- Ellipse parameters are now automatically calculated. You can still adjust them if you want, but the auto-calculation works exceptionally well.
- For previous changes see the Change Log.
- Please see the Quickstart Guide
- Python >= 3.6
- numpy
- scikit-learn
- python-geojson
- czml3
- pip3 now has the proper version of czml3! Version should be >= 0.5.4
Cesium Ion TokenCreate a single line file namedaccesstoken.txt- Turns out you can use a public token, you just can't use Cesium Assets. Most people don't need to use assets.
- The token is optional with --access_token=accesstoken.txt
- Preferred: KrakenSDR Software
- Alternatively: Extended XML KerberosSDR Software
- This is available for both Qt4 (original version) and Qt5 (Ubuntu 20.04+). Just check out the appropriate branch.
- -d FILE, --database=FILE
- Name of new or existing database to store intersect information.
- If a database doesn't exist one is created.
- Post processing math is done against the entire database.
-
-r FILE, --receivers=FILE
- List of receiver URLs
- Do not include quotes. Each receiver should be on a new line.
-
-g FILE, --geofile=FILE
- GeoJSON Output File
- Conventional file extension: .geojson
-
-e Number, --epsilon=Number or "auto"
- Max Clustering Distance, Default "auto".
- 0 to disable clustering.
- Point spread across a larger geographical area should require a smaller value.
- Clustering should be disabled for moving targets.
-
-c Number, --confidence=Number
- Minimum confidence value, default 10
- Do not compute intersects for LOBs less than this value.
-
-p Number, --power=Number
- Minimum power value, default 10
- Do not compute intersects for LOBs less than this value.
-
-m Number, --min-samples=Number or "auto"
- Minimum samples per cluster. Default "auto"
- A higher value can yield more accurate results, but requires more data.
-
--plot_intersects
- Plots all the intersect points in a cluster.
- Only applies when clustering is turned on.
- This creates larger CZML files.
-
-o, --offline
- Starts program with receiver turned off.
- Useful for looking at stored data when you can't connect to receivers.
-
--ip=IP ADDRESS
- IP Address to serve from. Default 127.0.0.1
-
--port=NUMBER
- Port number to serve from. Default 8080
-
--debug
- Does not clear the screen. Useful for seeing errors and warnings.
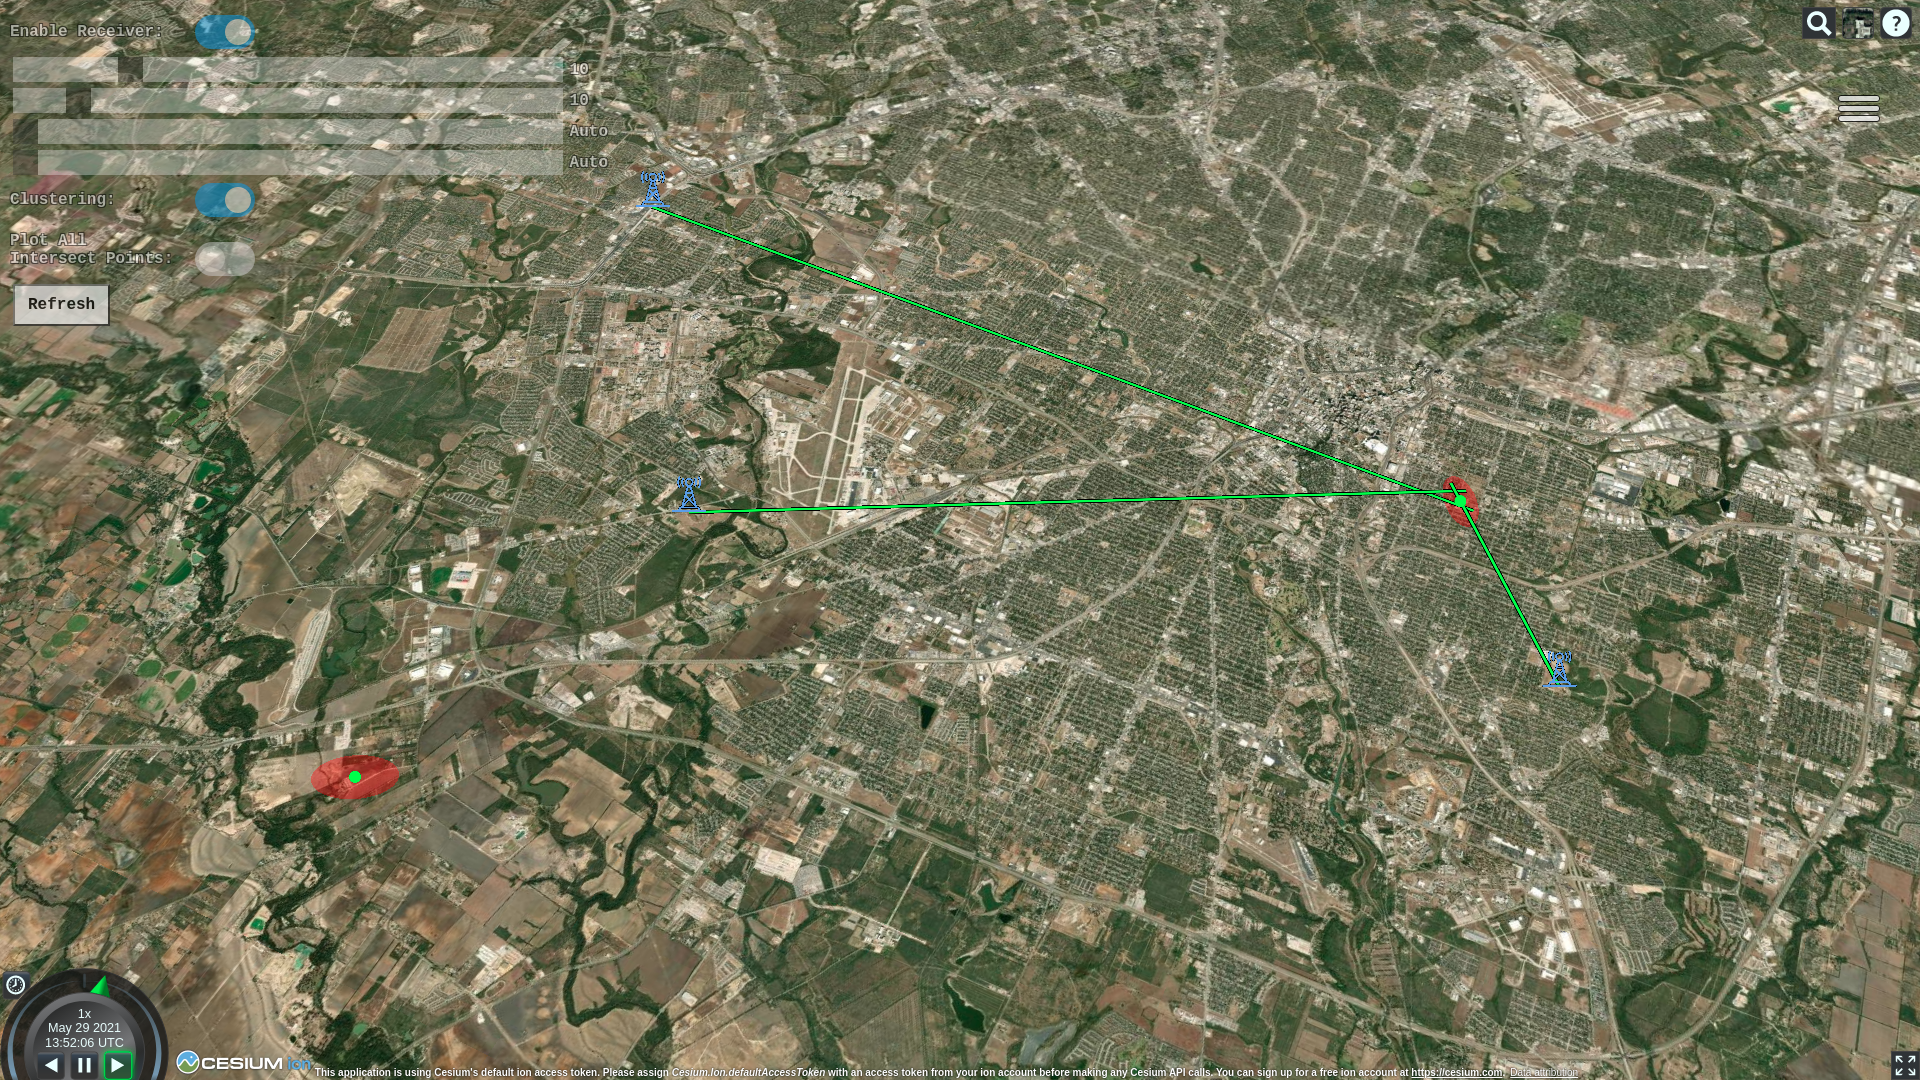
Once the program is running, browse to 127.0.0.1:8080 or whatever IP/Port Number you specified.
- A red ellipse represents the significant majority of the intersections in a particular cluster. It makes up the full area where the transmitter is most certainly located.
- The large green dot at the center of the ellipse is the likely location of the transmitter. It is simply computed as the mean of all intersections in that cluster.
- The smaller dots, if turned on vary in color from red to green. These dots are the individual intersections. The color represents the age relative to the full data set. Red is older, green is newer. This is very helpful for following moving targets.
- LOBs can either be red, orange, or green.
- Red means neither power nor confidence are above threshold.
- Orange means either power or confidence, but not both are above threshold.
- Green means power and confidence are above threshold.
Tower and car icons made by Freepik from www.flaticon.com