![]()
YouTube has become a significant source of income for many content creators, and they are always looking for the best way to grow their channel. When a YouTube video gets more views, the Content Creator makes more money. The purpose of our project is to analyze the significance of the various features of a YouTube preview thumbnail that can contribute to a video’s success. We believe that there are features in YouTube thumbnails that can be extracted and used to identify what makes a video more appealing to potential viewers.
Our research question is what YouTube thumbnail features, if any, have an effect on the amount of views that the video gets. Our hypothesis is that the more popular videos will likely have more provocative thumbnails that grab that attention of viewers. We believe that popular thumbnails will have more contrast, brightness, engaging subject matter, or just general attractiveness to potential viewers. We used YouTube’s Data API (v3) to create a data set that’s sourced from a YouTube search for “Fortnite”. We scrape the first 200 query results, and then scrape the first 100 videos from each unique channel, resulting in around 10,000 videos. Then we create a gamut of statistics from the metadata to best assess how well the video is doing according to YouTube. Because our data is from YouTube, which is an ever changing ecosystem, our results are only indicative of the data we scraped on April 16th, 2020. The thumbnails were created by YouTube content creators and/ or their thumbnail designers, while video metadata was provided by YouTube. We think our analysis is an interesting investigation because YouTube is a very prominent cultural influence, and so being able to better attract a larger audience would be of general interest to anyone pursuing a YouTube-based career. Because of the recent monetization of YouTube on a large scale, more and more people are trying to make a living off of YouTube. We hope that our results will help give any potential YouTuber insight into what features are most relevant in a thumbnail. In addition, as avid YouTube viewers, we have an intuition that thumbnails play a factor in YouTube’s recommendation algorithm. We hoped to learn more about this rather vague recommendation system and figure out what factors help in a video’s success, if any.
The features we will use to address our question are a combination of metadata and image features. For the metadata features, we use the view count of the YouTube video as well as a z-scored view count, calculated by taking fortnite videos from the same channel within the same month, that way we can compare channel to channel through the z-scores. For our image features, we are using image brightness, saturation, hue, unique_rgb_ratio (number of unique rgb values divided by the number of pixels), and the number of faces present (using DeepFace). For our metadata features, we used the YouTube Data API (v3) to get our metadata such as views. For the image features, we used the skimage library to extract image brightness, saturation, hue, and rgb values. For face recognition, we used DeepFace from DLib. We computed our own extracted features such as unique_rgb_ratio and z-score views. The analytical techniques we are using are as follows. For initial eda, we computed the correlation between each image feature column and the z_views column. This way we can see if there is any correlation between a specific image feature and the amount of views the video got (relative to similar videos from the same channel). For a deeper analysis, we wanted to combine images features to see if a certain combination of image features would attract more viewers. To do this, we first tried feeding all image feature columns into a random forest regressor and gradient boosted regressor. Then we plotted the predicted values vs. the real values to see any patterns in the predictions. We also multiplied sets of two/three/four features together to make higher level features, then trained a linear regression model with these features. We also looked at the predictions for this model to see any patterns in the predictions. We did not use a neural net to generate features for regression as the generated high level features are not clear enough to make a distinction between which image features have impact on the video views.
The results of our deep dive into how image features of thumbnails relate to video views are that there is no strong correlation between our thumbnail image features and video views. To show this, we’ve selected a couple visualizations to help see these results.
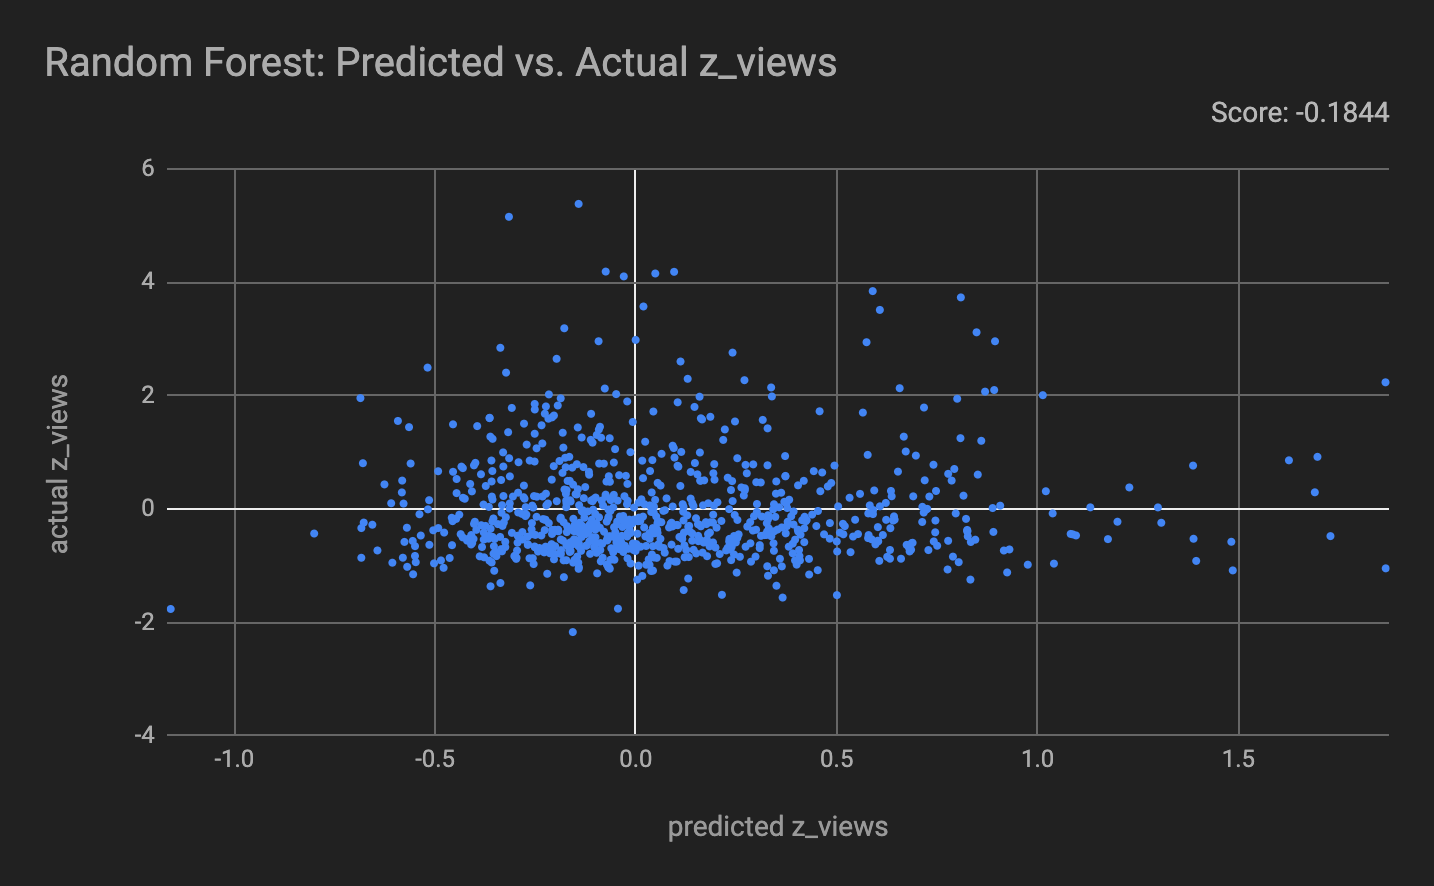
Figure (1): Random Forest Regression on the z-score for video views

Figure (2): Gradient Boosted Regression on the z-score for video views
The first two charts we chose to include are scatterplots of the predicted z_views vs the actual z_views. These predictions were obtained by training a random forest regressor and a gradient boosted regressor on the numerical image features gathered from our image processing ('unique_rgb_ratio','mean_hue', 'mean_saturation','mean_brightness', 'contrast', 'edge_score', numFaces’). The purpose of this graph is to show the lack of correlation between the predictions and the real values, which is shown by the score (coefficient of determination R2) for each being close to 0. A score of 0 is achieved by always predicting the mean value of z_views, making these regressors worse than the most naive approach. This shows the lack of relationship between the image features we used and the value of z_views that the video gets.

Figure (3): Thumbnail image statistics
The third visualization we chose to include is a combination of bar charts comparing the good performance videos (z_views > 1) and the poor performance videos (z_views < -1). We plot the values of the standard descriptive statistics to give a summary of values for the selected numerical image features. The adjacent bars allow for easy comparison for the different subsets of videos. This represents a conditional subset approach we used. By splitting up the data and looking at videos that did “well” and videos that did “poorly” , we are able to see some promising differences in thumbnail image features. Looking at the image features “unique_rgb_ratio” and “mean_hue”, we see consistent higher values for good videos than bad videos. This sheds light on the theory that more colorful thumbnails see greater success. We also see consistent differences in “contrast” and “edge_score”, this time the poorly performing videos having higher values. This alludes to “busier” thumbnails seeing less success. However, these differences are slight and not statistically significant, but we have hope that these features will direct some future analysis.
For all models, the predictions scored worse than predicting the mean for all values, indicating no such patterns exists, alluding to a lack of correlation between our image features and video views. The score for each model is either negative or very close to 0. According to SKLearn’s documentation, a score of 0 would be achieved by predicting the mean of the target column for all values. Because our models scored around 0 while trained on thumbnail features, we cannot say that there is any significant correlation between our thumbnail features and video views. We think this result is likely due to the relative importance of the thumbnail to the content of the video. We additionally looked at the correlation of the individual image features and video views, and found no significant correlation.
Since there are so many aspects that go into whether someone watches the video such as title, thumbnail, video duration, and most importantly, the contents of the video, it makes sense that there would not be a strong correlation between thumbnail image features and video views. It is also worth noting that these results are specifically for Fortnite Gaming videos uploaded in March/April 2020, and our image features were relatively basic. If the scope of this project was larger, we could look at more genres and more videos per genre, along with more advanced image features. We still think that video thumbnails affect video views, but we lack the quantifiable results to say so.
With the growth of social media platforms such as YouTube, the job title of ‘content creator’ has become a more common and financially viable occupation. As such, our work on YouTube thumbnails will help creators put numbers to the trends they inherently sense in the ever changing YouTube thumbnail meta, allowing them to make changes to their thumbnails with less guesswork and backed with more relevant data. Besides the impact on those creating thumbnails, our work also explores how audiences of specific genres of videos react to different types of thumbnails because thumbnails are the front cover of a video and holds the potential to attract millions of users who aren’t already followers.
Our approach takes advantage of the digital format as we were able to scrape and process mass amounts of data which wouldn’t have been easy to do manually which enabled us to acquire and work with a substantially larger dataset. Since we parameterized our work, it is very flexible and can be configured to analyze different genres of Youtube videos which could be useful for a Youtuber as it would provide them with a snapshot of the current YouTube thumbnail meta and act as a soft guide when they are making their own. We could expand our project scope in the future by looking at other video games in the YouTube Gaming category or even other YouTube categories (such as make-up videos or VLOGS). Another direction is creating a live thumbnail meta analysis. We suspect that certain features in thumbnails rise and fall in popularity similar to fashion, so having a live trend analysis of thumbnails could prove useful. For instance, if faces in the thumbnail start becoming less popular, YouTubers might want to stay away from putting their face on a thumbnail. However, they might use the thumbnail meta analysis as a way to go against the meta which would make their thumbnails stick out.
To run the main pipeline, run the command “python run.py” in the repository’s root directory. To run this command you also need a youtube API key. The key can be obtained by following this guide: (https://developers.google.com/youtube/v3/getting-started). Once obtained, you need to create a file named “api_key.json” in the root directory of the repo. It needs to have one key called “api_keys”, which is a list of API keys as strings. You can include as many keys as you’d like to gather more datasets, as the youtube API has a daily limit. Additionally, the command “python run.py test-project” can be run, which runs the analysis on a curated test dataset. This is good for a quick option that does not require fiddling with configuration parameters or creating an API key.
When running this pipeline locally, 5 output files will be generated in the “data/local/selected-game/video_data/” directory. The first file is the “scrape_MM_DD_YY.json” file, which represents a dataset of video_ids returned by the search result, and for each video_id, includes the specified number of video_ids from that channel that also match the selected-game. The second file is “selected-game_full_features_MM_DD_YY.csv”, which represents the dataset of metadata features, basic image features, and advanced image features for all videos in the dataset created on the date in the filename. The third file is “selected-game_full_metadata_MM_DD_YY.csv”, which contains only the metadata features for the dataset gathered on the specified date. The fourth file is “selected-game_requests.json”, which contains the massive amount of data returned by the youtube api for each video_id. This is constantly updated for any new videos that are scraped, which is why it does not have a date in the filename. The last file is “selected-game_summary_metadata_MM_DD_YY.csv”, this contains just the metadata for only the videos that appear in the search results, and not the videos within the channels that are contained in “selected-game_full_features_MM_DD_YY.csv”.
Once the pipeline has been run, further analysis of the data gathered can be found in the notebook “notebooks/eda/cwynne_combined_analysis.ipynb”. In the third cell of the notebook, specify which dataset that the analysis should be done on, usually selecting one of the generated output files mentioned above. The variable “data_path” should be set to the desired dataset. The target columns can also be changed in this cell, although it is recommended that the defaults are used.
The run.py script will access the configuration file stored in “config/config-scraping.json”. This json file contains different parameters that allow you to change what data is scraped / analyzed. Below are the parameters in further detail.
- selected-game: this key represents what keyword will be used to search for videos. This does not have to be a game, but can be any keyword of your choosing.
- thumbnail-qual: This key holds a dictionary which can be thought of as a switch, put a 1 in any quality that you want a dataset of thumbnails for.
- test-videos-dir: This is the filepath of the test video folder, which contains files such as the video ids and metadata of the test subset.
- test-thumbs-dir: This is the filepath of the directory of thumbnails for the test dataset.
- api-service-name: This generally should not change, if the youtube api changes this argument, then this should be changed.
- api-version: This is the version of the API, currently the most updated version is “v3”, but this could be changed to use later or earlier versions, however the code has not been tested on different api versions.
- videos-dir: This is the location of the currently scraped video data directory. Files in this folder are scraped based on the keyword and include the csv of video ids in the dataset and metadata information. This is only a local directory and is used for anything that is not the test dataset
- full-metadata-csv-write-path: This is the filepath to write the metadata for all videos that were scraped. This includes the search result videos and the specified number of videos per channel by the key “videos-per-channel”).
- summary-metadata-csv-write-path: This is the filepath to write only the initial search result videos and not the extra channel videos.
- requests-dic-read-path: This is the file path for a local json of request data that could exist from a previous run of this pipeline. If nothing is provided it will create a new file using “requests-dic-write-path” that can be used for reruns of the pipeline. This is to prevent re-requesting the same info for videos and making unnecessary API calls.
- requests-dic-write-path: This is the path where the requests data json file is written for quicker reruns or saving of new requests data.
- num-recent-videos: This is the number of search results that will be gathered based on the “selected-game” keyword being searched with the youtube api.
- videos-per-channel: This is the videos per channel that are scraped, based on the different channels that uploaded videos in the search result for our keyword.
- scrape-write-dir: This is the directory that all of our scraped video data gets written to. This includes the dataset of video ids, and the metadata dataset for these videos. This changes based on the “selected-game” keyword.
- full-features-write-name: This is the name of the file that contains metadata, basic image features, and advanced image features. It is stored in the directory specified by “videos-dir”
- overwrite: if set to true, it will overwrite any previously scraped data that was scraped on the same calendar date. If set to false, it will simply add a number to the end of the new requests data file.
Louise Myers 2019, accessed April 6, 2020,
https://louisem.com/198803/how-to-youtube-thumbnails
EmpLemon 2020, accessed May 4, 2020,