Dimensional charting built to work natively with crossfilter rendered using d3.js.

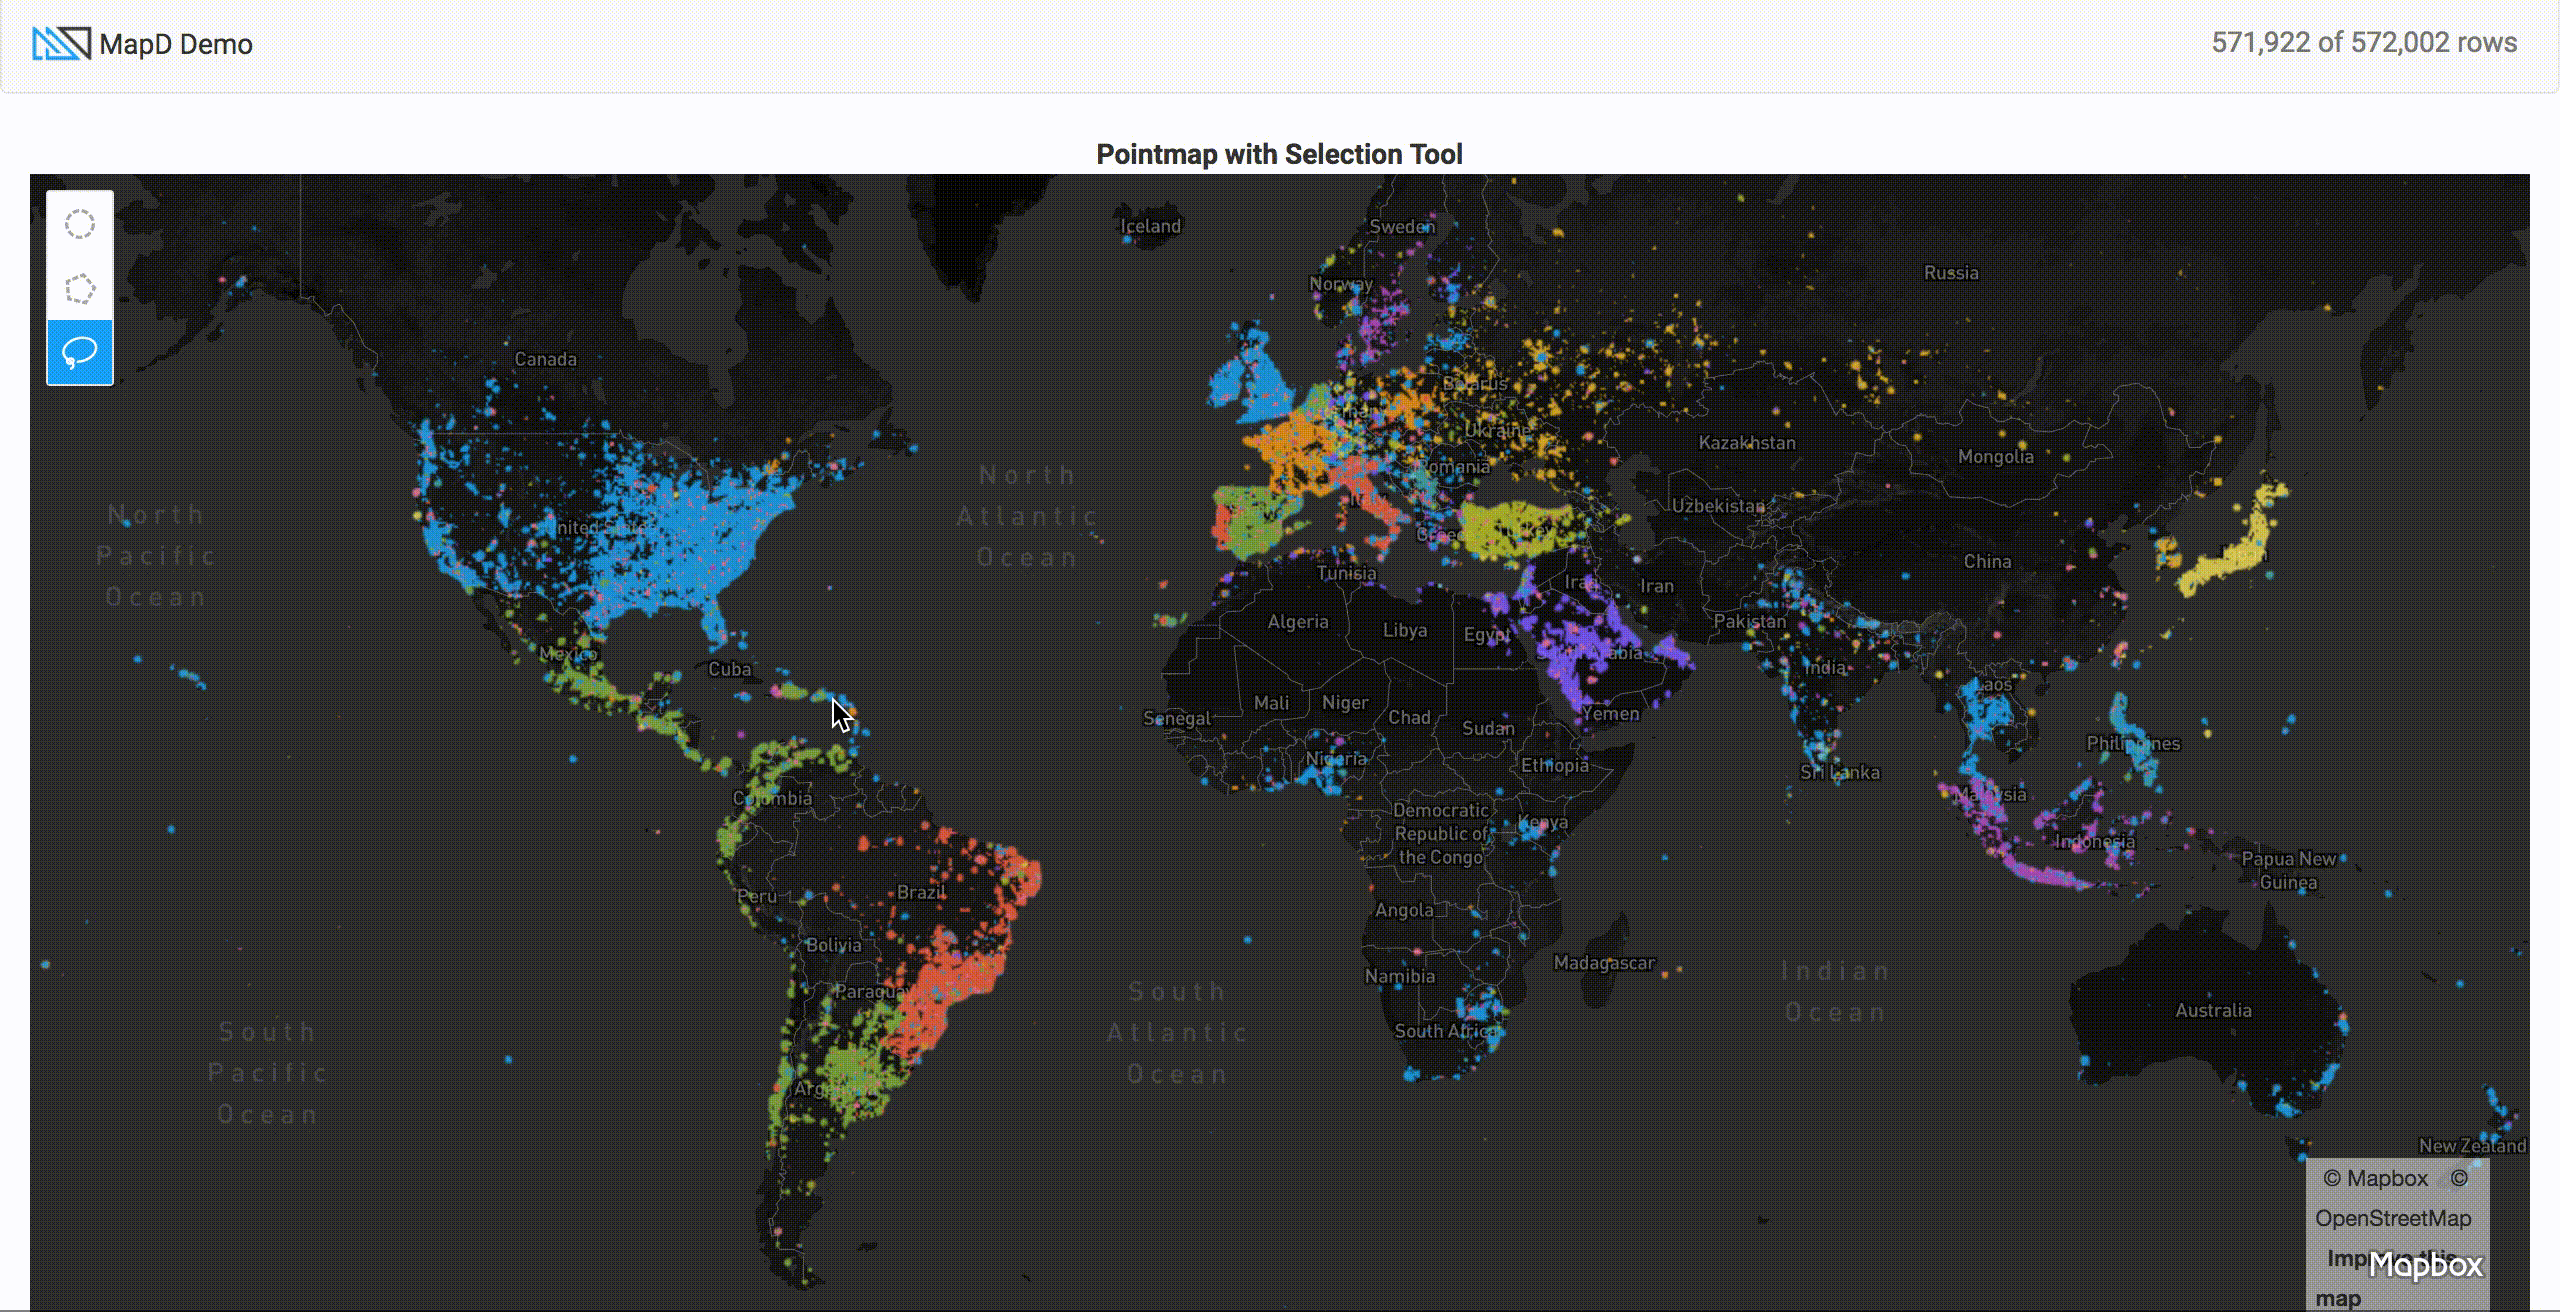
Tweets Dataset: Brushing on timeline and hovering on Pointmap datapoint which displays row information

Visit our examples page for ideas of what can be created MapD Charting
npm install #downloads all dependencies and devDependencies
npm install mapbox-gl@https://github.com/mapd/mapbox-gl-js/tarball/9c04de6949fe498c8c79f5c0627dfd6d6321f307 #downloads mapbox peer dependencynpm run startMapD-Charting is a superfast charting library that works natively with crossfilter that is based off dc.js. It is designed to work with MapD-Connector and MapD-Crossfilter to create charts instantly with our MapD-Core SQL Database. Please see examples for further understanding to quickly create interactive charts.
Our Tweetmap Demo was made only using MapD-Charting.
Visit our API Docs for additional information on MapD Charting
New components in MapD-Charting should be unit-tested and linted. All tests will be in the same folder as the new component.
+-- src
|   +-- /mixins/new-mixin-component.js
|   +-- /mixins/new-mixin-component.unit.spec.js
The linter and all tests run on
npm run testTo check only unit-tests run:
npm run test:unitPlease lint all your code in mapd-charting/. The lint config file can be found in .eslintrc.json. For new components, please fix all lint warnings and errors.
| Command | Description |
|---|---|
npm run start |
Copies files for examples and then serves the example |
npm run build |
Runs webpack and builds js and css in /dist |
npm run docs |
Creates and opens docs |
npm run test |
Runs both linting and unit tests |
npm run clean |
Removes node modules, dist, docs, and example files |
The charting library uses documentation.js for API documentation. Docs can be built and viewed locally with the npm run docs command.
Interested in contributing? We'd love for you to help! Check out Contributing.MD
Community members have written several blogs about installing MapD Charting on different platforms. Their experiences may help you if you encounter any problems.
- Mac OS X
- Linux Ubuntu 17.04
- Windows 10
- node v6.11
- Mac OS X 10.12.5 (probably doesn't matter)
- Xcode and associated tools
Smooth. No problems
- node 5.12.0 (did not work with node 7.10.0)
- requires bash to run script
npm run start(which you probably have installed with git bash) - Windows SDK 8.1 (you need this version, not Windows 10 SDK)
- Node 7.x or below (not node 8, which is the most recent version)
- Python 2.7x 64 bit (not Python 3.x, the most recent Python)
- install node-gyp globally (You'll see it in the warnings.
npm install -g node-gyp) - install node-sass manually (
npm install node-sass)