BrainBrowser는 Python의 Plotly Dash를 사용하여 제작한 Web-based visualize software로, 사용자와의 상호작용을 통해 즉각적인 시각화 결과물을 확인할 수 있습니다.

웹 애플리케이션을 설계한 구조는 위와 같습니다.
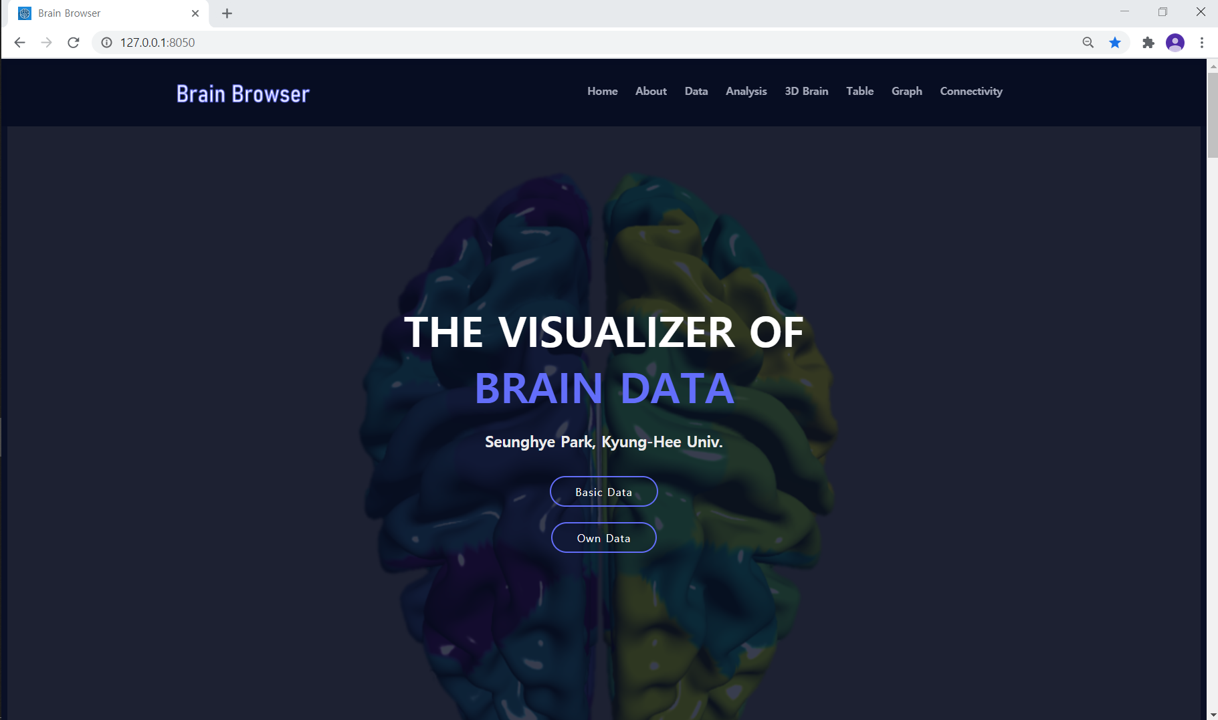
Intro Section에서는 두 개의 버튼과 상단의 네비게이션을 확인할 수 있습니다.
네비게이션을 통해 원하는 위치로 바로 이동할 수 있습니다.
- Basic Data 버튼을 클릭시 프로그램 자체에서 고유적으로 가지고 있는 파일을 사용하여 바로 툴을 사용해볼 수 있도록 Analysis section으로 연결됩니다.
- Own Data 버튼을 클릭시 사용자가 가지고 있는 파일을 적용하여 툴을 사용해볼 수 있도록 파일을 업로드하는 Data Section으로 연결됩니다.
Intro Section 아래에는 툴에 대한 설명이 짧게 들어가는 About Section이 등장합니다.
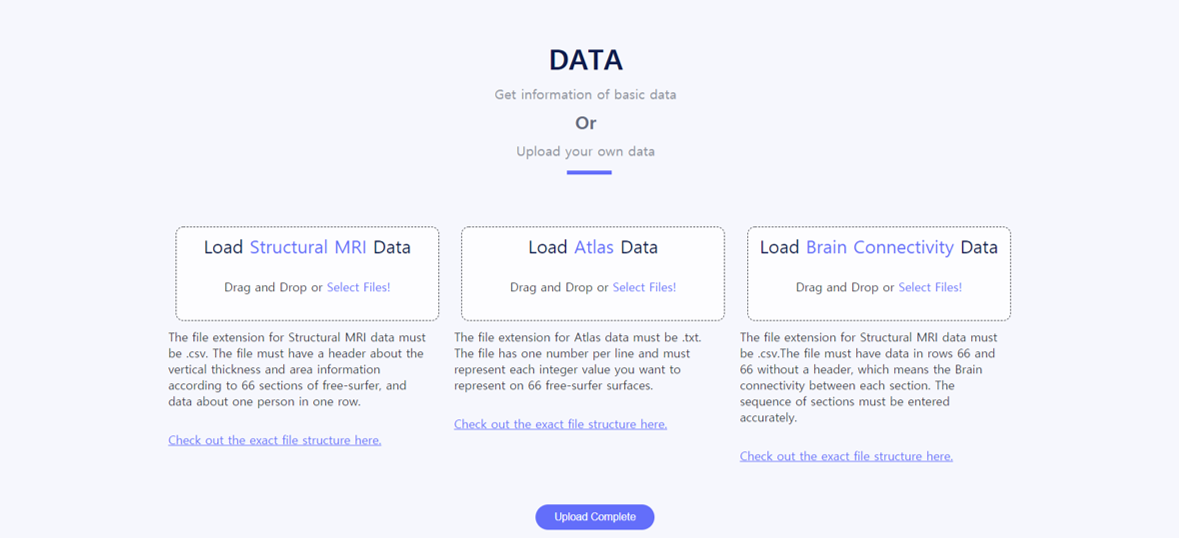
Data Section에서는 세 종류의 파일을 업로드할 수 있습니다.
- Structural MRI Data : Analysis와 Table, Graph Section에서 사용되는 데이터입니다. 데이터는 성별, 나이를 포함하여야 하며 Free-surfer으로 구분되는 66가지 뇌영역에 대한 thickness와 area 정보를 가져야합니다. 파일의 확장자는 csv이어야 합니다. 정확한 데이터 형식은 이곳에서 확인하세요.(위에서 언급한 정보 외의 정보는 없어도 무관합니다.)
필수 데이터 열 명칭 확인하기
- Age : 나이
- Sex : 성별
- BrainSeg_Vol : 전체 부피
Free-Surfer : 이하 모든 구역들은 명칭 앞에 L_ 또는 R_을 붙여 좌우를 구분하고, 명칭 뒤에 Thck와 Area를 붙여 사용합니다.
- Bankssts
- Caudalanteriorcingulate
- Caudalmiddlefrontal
- Cuneus
- Entorhinal
- Fusiform
- Inferiorparietal
- Inferiortemporal
- Isthmuscingulate
- Lateraloccipital
- Lateralorbitofrontal
- Lingual
- Medialorbitofrontal
- Middletemporal
- Parahippocampal
- Paracentral
- Parsopercularis
- Parsorbitalis
- Parstriangularis
- Pericalcarine
- Postcentral
- Posteriorcingulate
- Precentral
- Precuneus
- Rostralanteriorcingulate
- Rostralmiddlefrontal
- Superiorfrontal
- Superiorparietal
- Superiortemporal
- Supramarginal
- Frontalpole
- Temporalpole
- Transversetemporal
- Insula
- Atlas Data : 3D Brain viewer의 표면에 나타낼 정보를 의미합니다. 66가지의 Free-surfer 영역마다 하나의 정수 값을 가지며, 이는 txt 파일에 한 줄에 하나의 정수씩 총 66줄이 입력되어있어야 합니다. 정확한 데이터 형식은 이곳에서 확인하세요.
- Brain Connectivity Data : Connectivity Section에 나타낼 정보를 의미합니다. (66,66) shape의 행렬 데이터를 갖는 csv파일이며, 각 행/열에 해당하는 영역간의 연관성 값을 갖도록 합니다. Header는 갖지 않습니다. 정확한 데이터 형식은 이곳에서 확인하세요.
데이터 순서 확인하기(Atlas와 Brain Connectivity는 같은 데이터 순서를 가집니다.)
- Bank of the superior temporal sulcus
- Caudal anterior cingulate cortex
- Caudal middle frontal cortex
- Cuneus
- Entorhinial cortex
- Frontal pole
- Fusiform gyrus
- Inferior parietal cortex
- Inferior temporal cortex
- Isthmus of the cingulate cortex
- Lateral occipital cortex
- Lateral orbitofrontal cortex
- Lingual gyrus
- Medial orbitofrontal cortex
- Middle temporal cortex
- Paracentral lobule
- Parahippocampal cortex
- Pars opercularis
- Pars orbitalis
- Pars triangularis
- Pericalcarine cortex
- Postcentral gyrus
- Posterior cingulate cortex
- Precentral gyrus
- Precuneus
- Rostral anterior cingulate cortex
- Rostral middle frontal cortex
- Superior frontal cortex
- Superior parietal cortex
- Superior temporal cortex
- Supramarginal gyrus
- Temporal pole
- Transverse temporal cortex
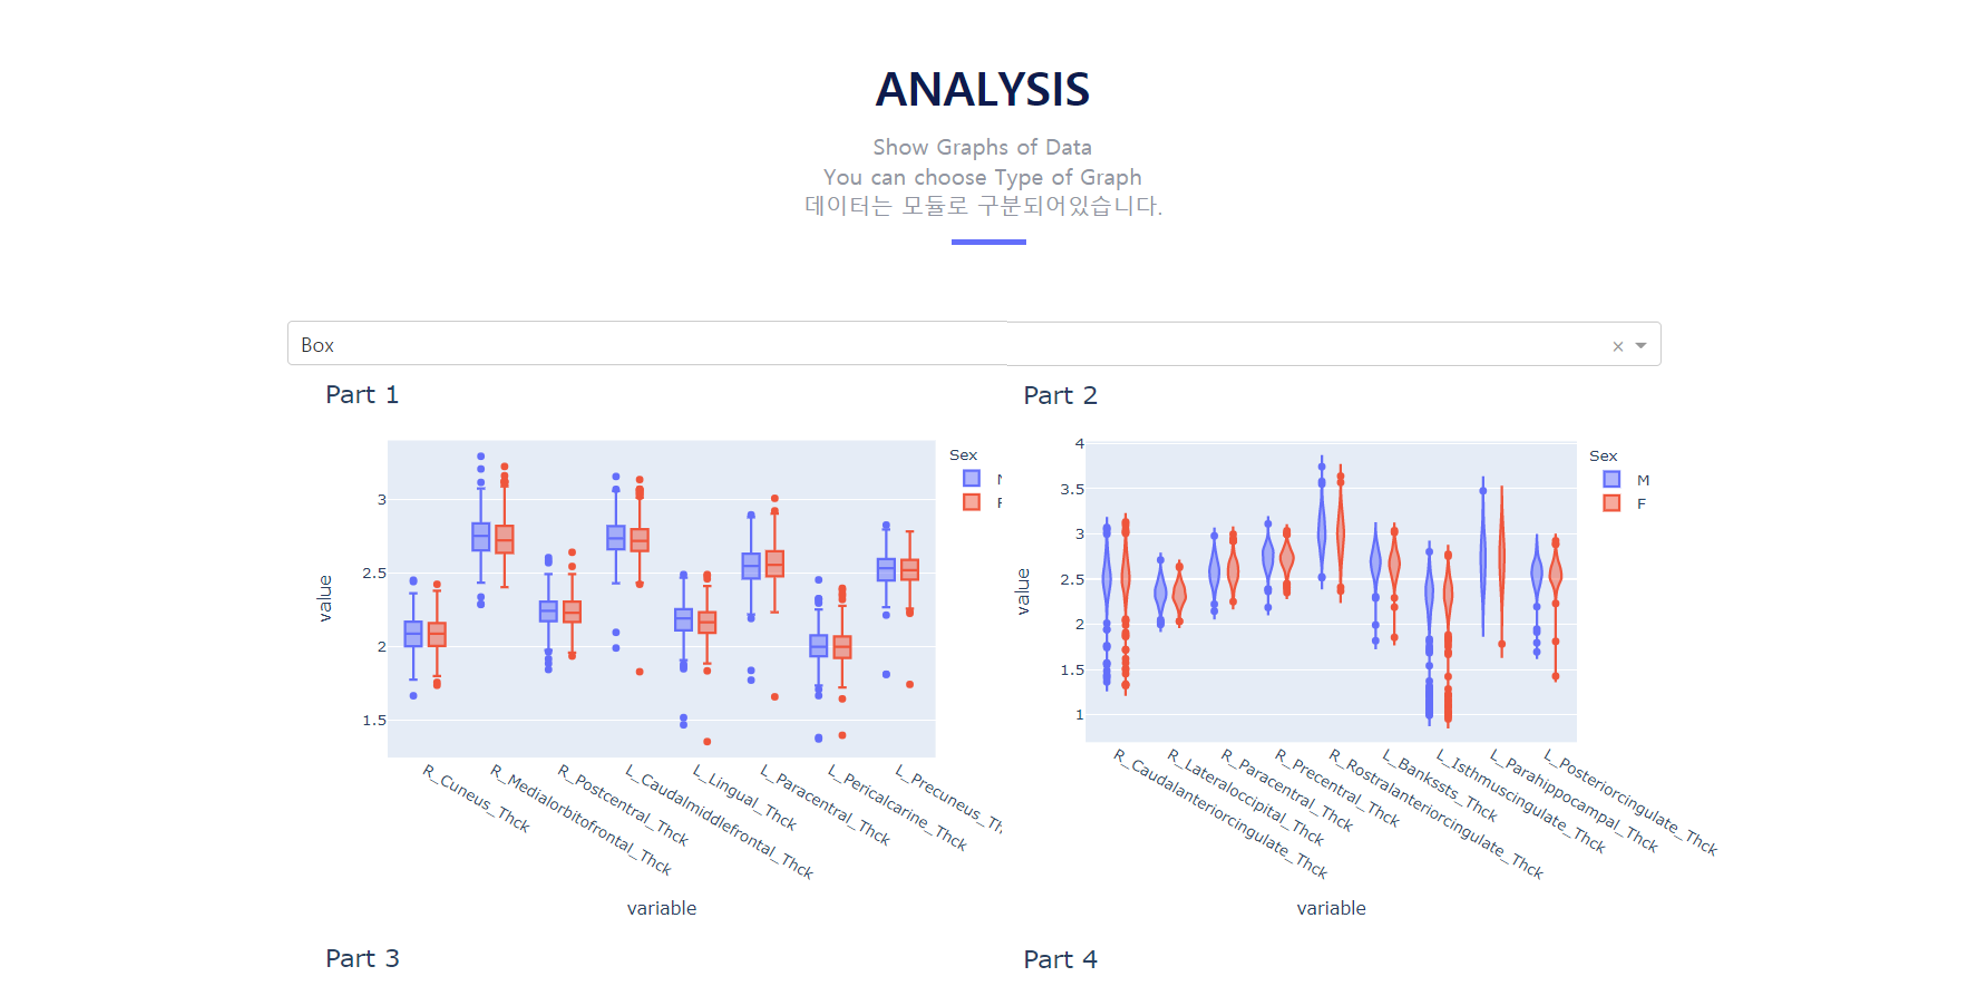
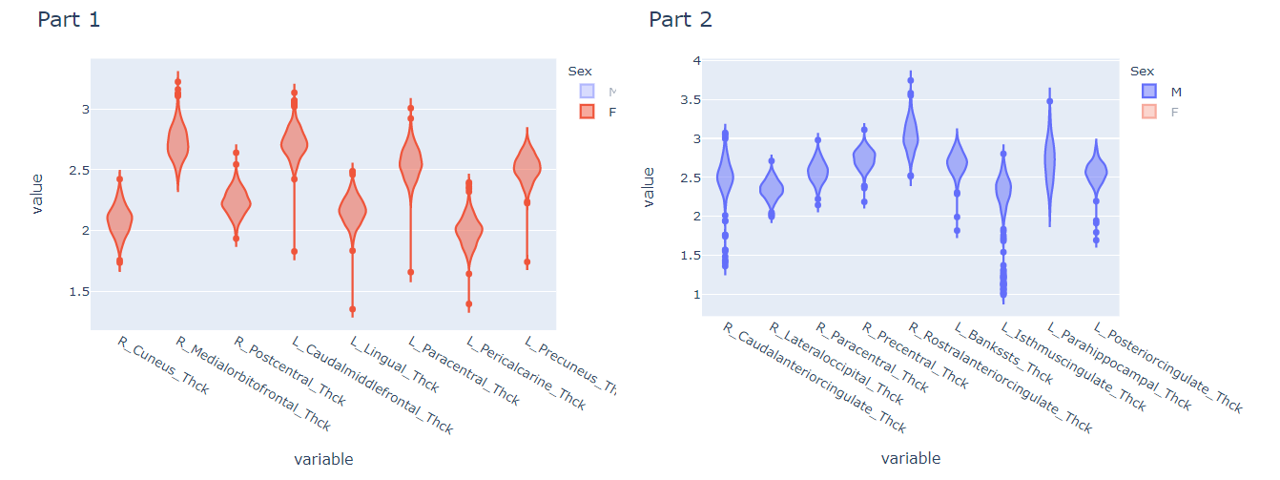
Analysis Section에서는 Thickness data에 대한 정보를 모듈별로 보여줍니다. dropdown을 사용하여 Box와 Violin 중 원하는 그래프를 선택할 수 있습니다.
필요에 따라 원하는 성별만을 선택하여 확인할 수 있습니다. 그래프 위에 마우스를 올리면 구체적인 정보를 알 수 있습니다.
모듈 정보
각 영역의 축약명에 대한 정보는 이곳에서 참고하세요.
| Module Number | Member Regions(LH) | Member Regions(RH) |
|---|---|---|
| 1 | lCUN, lLING, lPARH, lPCAL, lPCUN, | rCUN, rLING, rPCAL |
| 2 | lCAC, lISTC, lPARC, lPC, | rCAC, rISTC, rPARC, rPC, rPCUN |
| 3 | lBSTS, lENT, lFUS, lIP, lIT, lLOCC, lMT, lPSTC, lSP, lST, lSMAR, lTP, lTT | |
| 4 | rBSTS, rENT, rFUS, rIP, rIT, rLOCC, rMT, rPARH, rPSTC, rSP, rST, rSMAR, rTP, rTT | |
| 5 | lCMF, lFP, lLOF, lMOF, lPOPE, lPORB, lPTRI, lPREC, lRAC, lRMF, lSF | |
| 6 | rCMF, rFP, rLOF, rMOF, rPOPE, rPORB, rPTRI, rPREC, rRAC, rRMF, rSF |
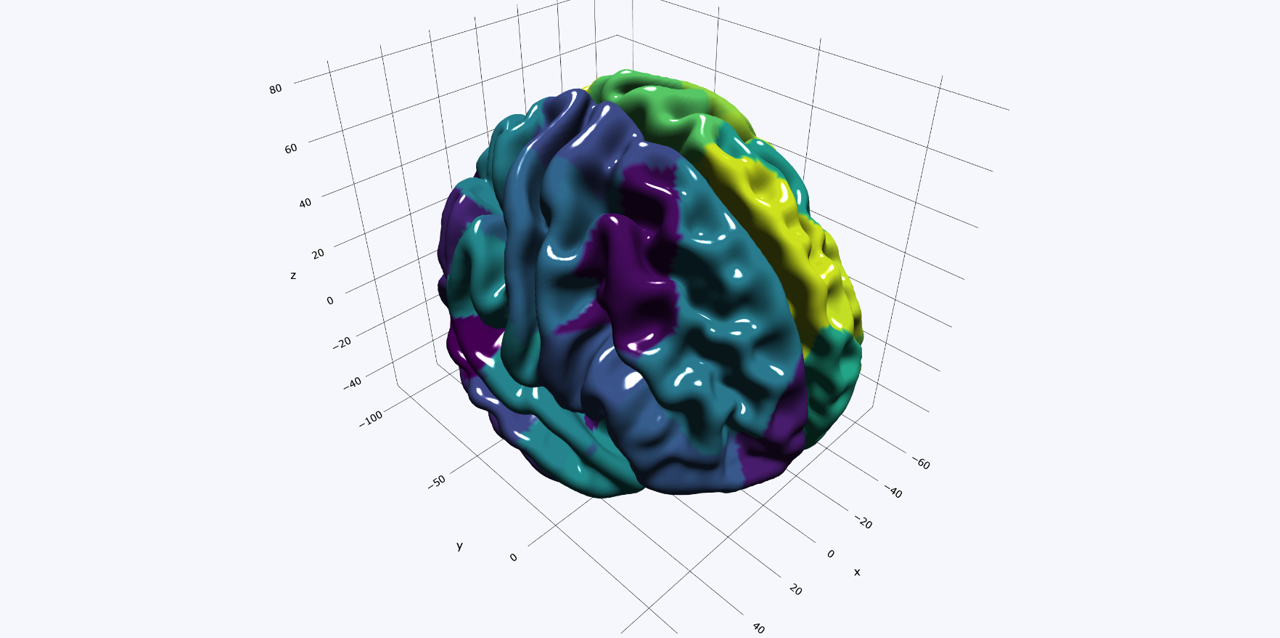
3D Brain Section에서는 뇌의 표면을 시각화하여 보여줍니다. 표면을 클릭하면 클릭한 영역에 대한 정보를 아래의 Table, Graph, Connectivity에서 표시합니다. 위 시각화 방법은 BrainBrowser - MCGILL CENTRE for INTEGRATIVE NEUROSCIENCE에서 참고하여 구현하였습니다.
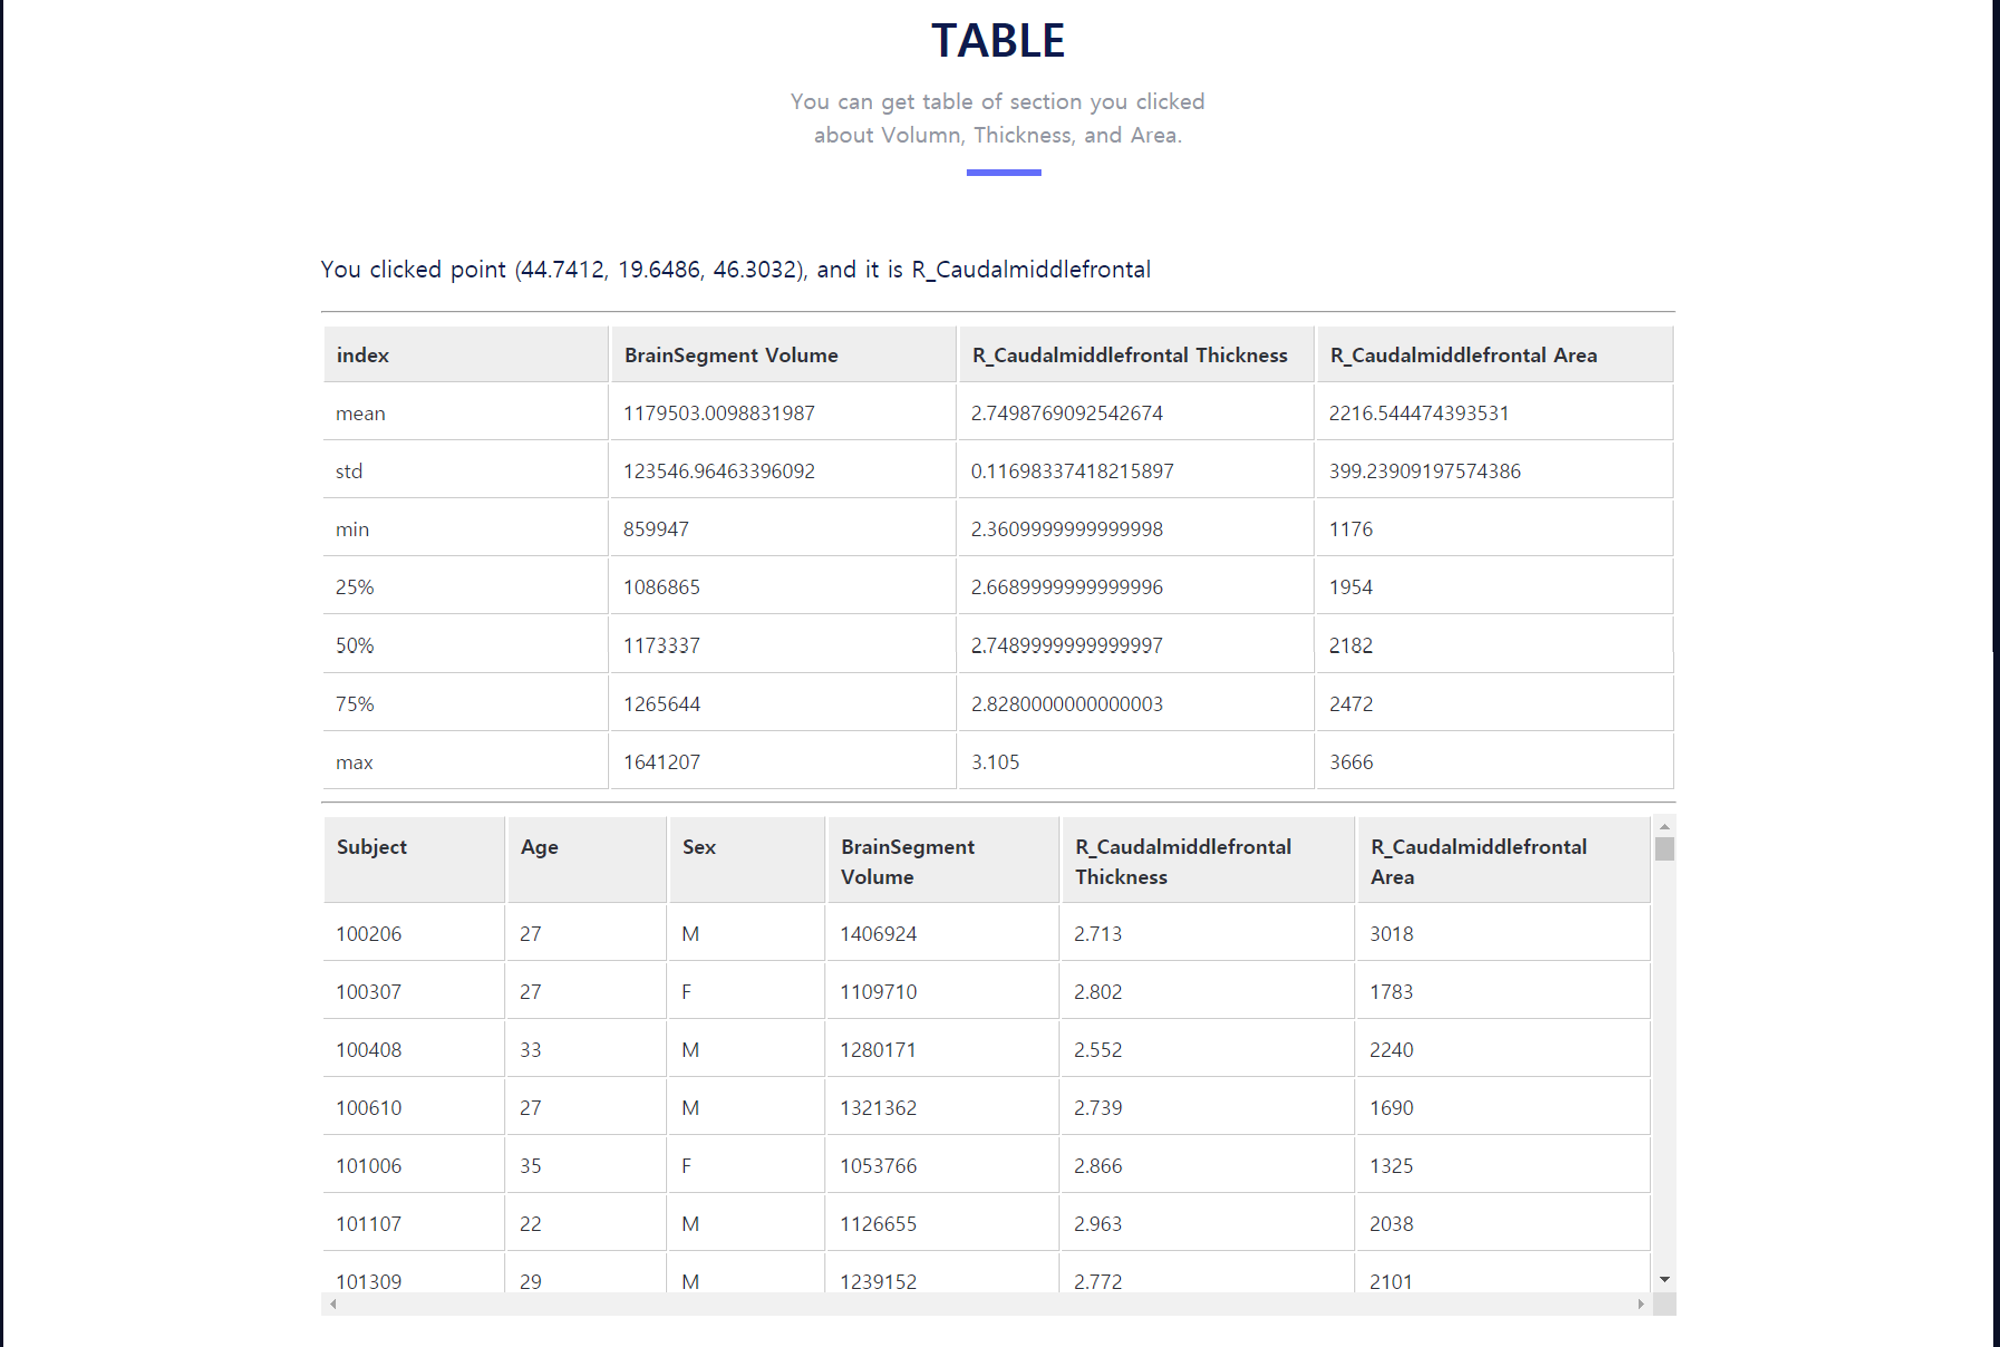
Table Section에서는 클릭한 위치 좌표와 해당 영역의 명칭을 알려줍니다. 클릭한 위치의 데이터들에 대한 수치적인 정보와, 그 아래에 모든 data들을 보여줍니다.
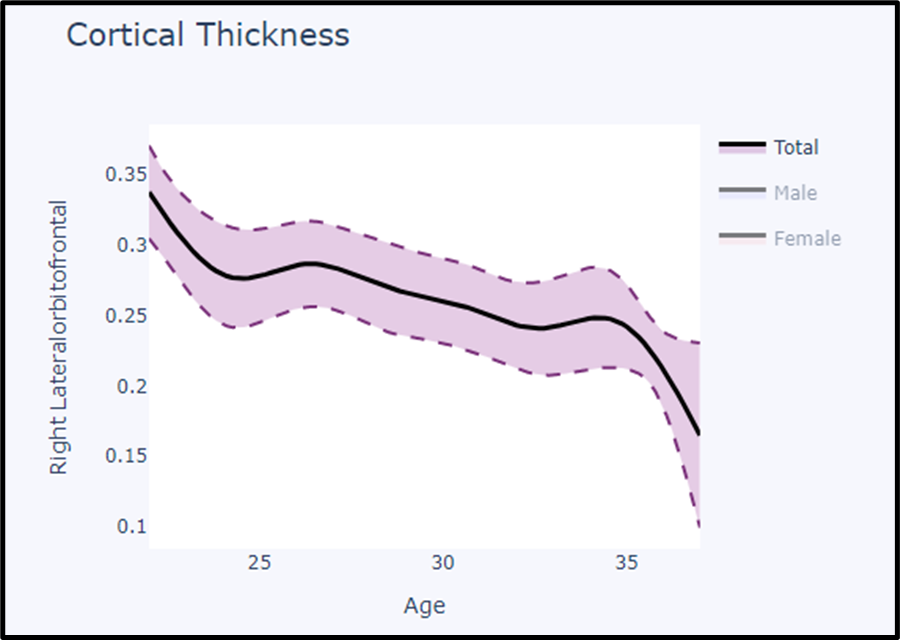
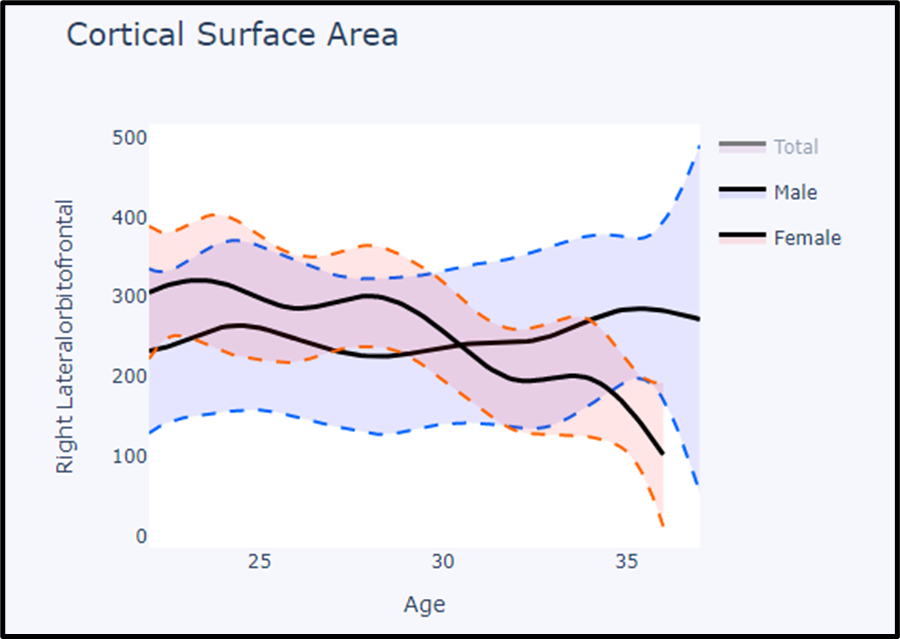
Graph Section에서는 Table에서 보여준 data들을 plot하여 보여줍니다. 여기서는 나이에 따른 정보를 확인할 수 있으며, 나이에 따른 회귀곡선도 함께 표현됩니다.
Plot의 종류는 Dropdown을 통해 scatter와 Box 중에서 선택할 수 있습니다.
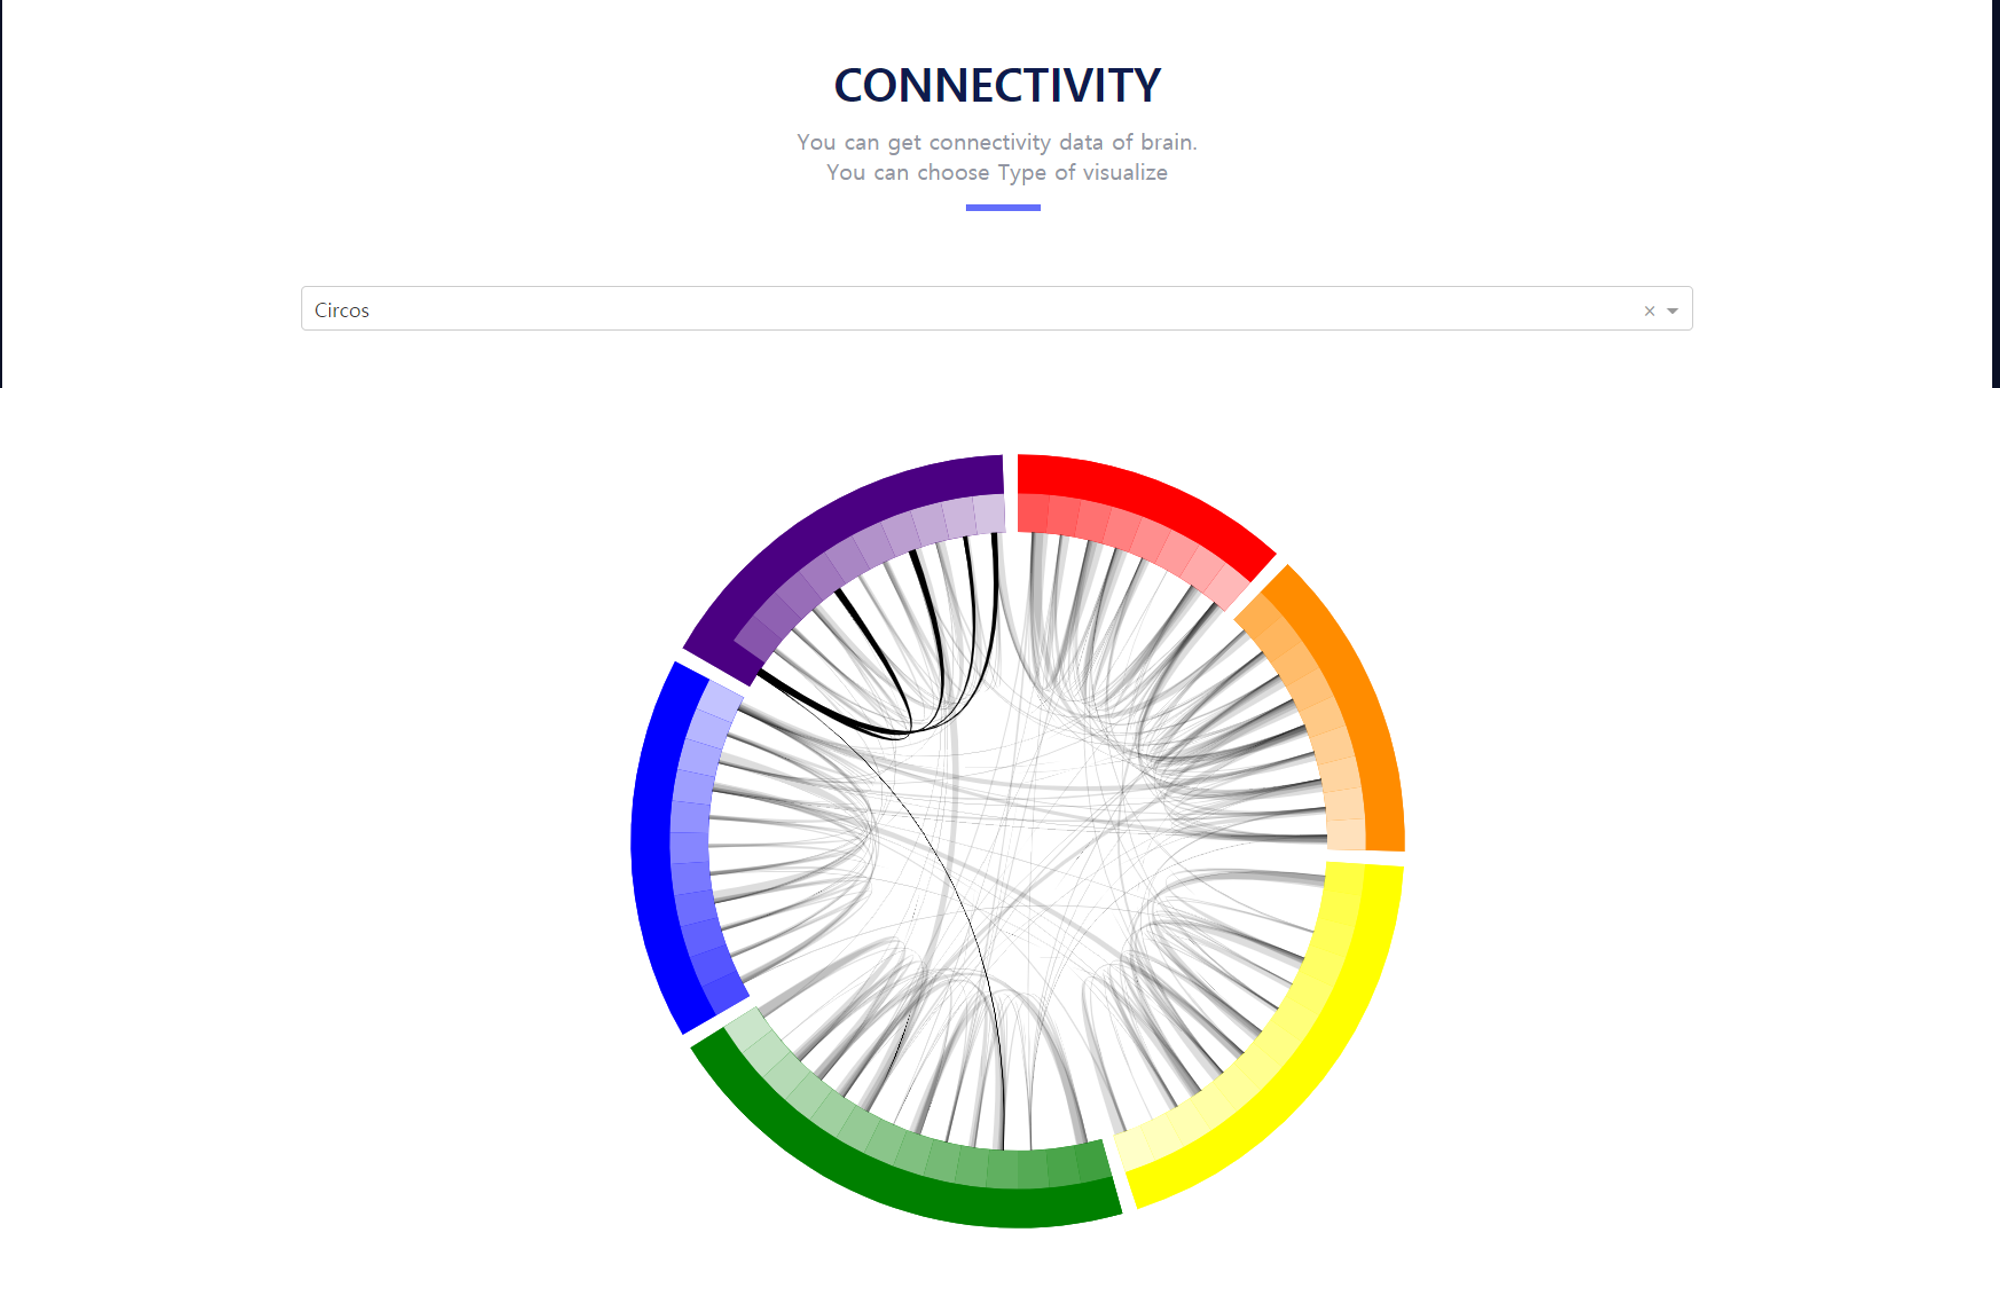
Circos 그래프는 클릭된 영역과 연관된 연결선들을 표시해줍니다. 안쪽 원 위에 커서를 올리면 해당 영역의 명칭을 확인할 수 있습니다.
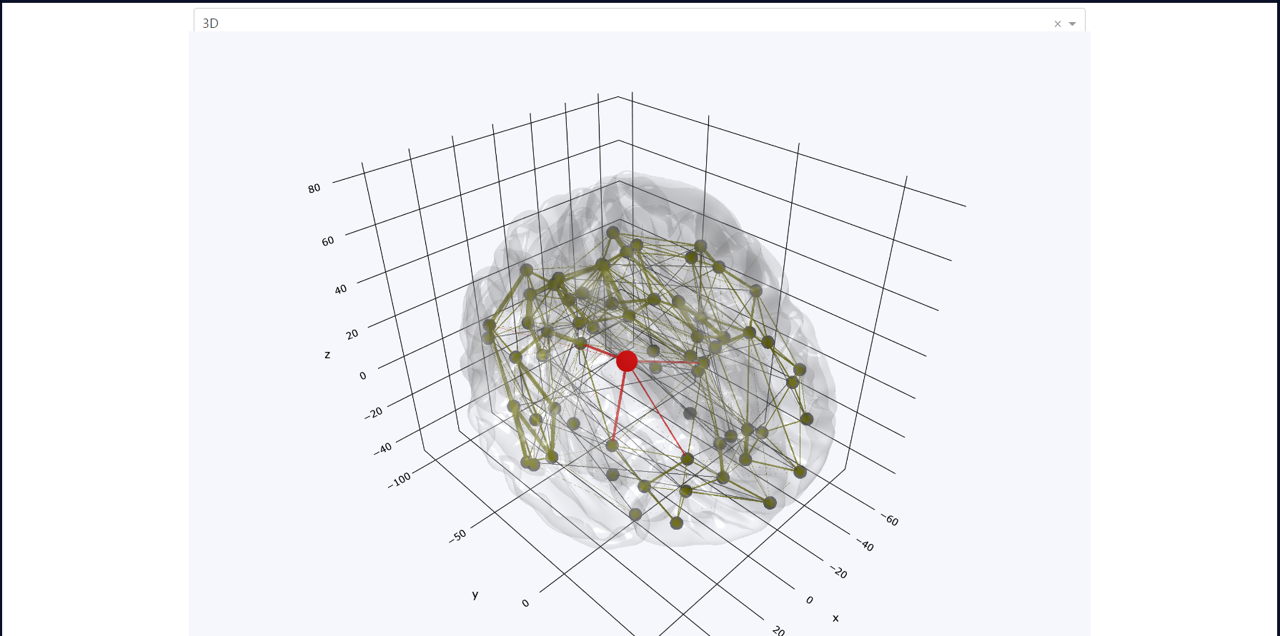
3D connectivity는 마찬가지로 선택된 영역과 그에 연결된 연결선들을 표시해줍니다.
-
파일을 다운받아 다음과 같은 폴더 구성을 만듭니다.
ProjectFolder
├─ assets
│ ├─ img
│ │ ├─ about-bg.jpg
│ │ ├─ intro-bg.jpg
│ │ └─ logo.png
│ ├─ bootstrap-grid.css
│ ├─ favicon.ico
│ ├─ main.js
│ └─ style.css
├─ data
│ ├─ connectivity.csv
│ ├─ connectivity.mat
│ ├─ free_surfer_data.csv
│ ├─ fs-atlas.txt
│ ├─ Hagmann_66regions.xlsx
│ └─ human_brain.obj
├─ app.py
├─ datas.py
├─ index.py
└─ utils.py
.py 외의 파일들은 없어도 무관합니다. -
CMD 또는 PowerShell 등에서 index.py를 실행시킵니다.
cd (index파일 directory)
python index.py
- 127.0.0.1:8050/에서 실행 결과물을 확인할 수 있습니다.
- dash==1.16.1
- dash-bio==0.4.8
- dash-bio-utils==0.0.5
- dash-bootstrap-components==0.10.7
- dash-colorscales==0.0.4
- dash-core-components==1.12.1
- dash-html-components==1.1.1
- dash-renderer==1.8.1
- dash-table==4.10.1
- numpy==1.18.3
- pandas==1.0.3
- plotly==4.9.0
- pygam==0.8.0