Database pinned to 100% CPU after a few hours of running #6589
Comments
|
Do you have statistics enabled on your Postgres instance? Can you try running some of these queries to get a sense of where the bottleneck is: https://github.com/concourse/concourse/wiki/Schema-Inspection-Queries#show-in-flight-queries |
|
We're seeing similar, where Concourse is causing much higher CPU usage on our DB since upgrading to 7.0: in-flight queries grouped by query, showing longest-running time currently active running queries size and number of hits for each index |
|
@kurtmc @wduncanfraser Thanks for the schema inspection results! I think one really useful inspection query to run would be the slowest avg queries https://github.com/concourse/concourse/wiki/Schema-Inspection-Queries#show-the-top-n-slowest-queries and maybe also altering the query to order by |
|
@kirillbilchenko also reported a very similar problem on discord: https://discord.com/channels/219899946617274369/604330794898554956/819224035161931807 |
|
We are seeing the same issue after upgrading from 6.5.1 to 7.1.0. DB CPU has gone from 20% to 75% and the UI has become very sluggish.
Query insights tells us this query is the culprit. The 95% query time is 12 seconds! SELECT
b.id,
b.name,
b.job_id,
b.resource_id,
b.resource_type_id,
b.team_id,
b.status,
b.manually_triggered,
b.created_by,
b.scheduled,
b.SCHEMA,
b.private_plan,
b.public_plan,
b.create_time,
b.start_time,
b.end_time,
b.reap_time,
j.name,
r.name,
rt.name,
b.pipeline_id,
p.name,
p.instance_vars,
t.name,
b.nonce,
b.drained,
b.aborted,
b.completed,
b.inputs_ready,
b.rerun_of,
rb.name,
b.rerun_number,
b.span_context
FROM
builds b
LEFT OUTER JOIN
jobs j
ON
b.job_id = j.id
LEFT OUTER JOIN
resources r
ON
b.resource_id = r.id
LEFT OUTER JOIN
resource_types rt
ON
b.resource_type_id = rt.id
LEFT OUTER JOIN
pipelines p
ON
b.pipeline_id = p.id
LEFT OUTER JOIN
teams t
ON
b.team_id = t.id
LEFT OUTER JOIN
builds rb
ON
rb.id = b.rerun_of
WHERE
j.id = $1
AND b.id > $2
ORDER BY
COALESCE(b.rerun_of,
b.id) ASC,
b.id ASC
LIMIT
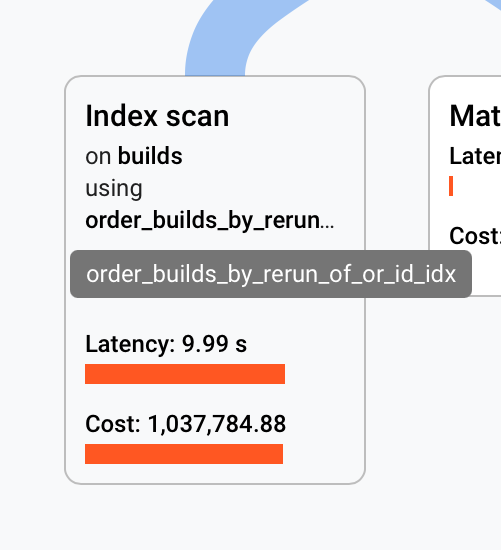
?A sample query plan shows the expensive index scan
|

|
@robwhitby thanks for providing query insights. We too are seeing that query to be periodically very slow on our (fairly) large deployment. Our query insights dashboard (also GCP) tells us that most of this time is spent in IO wait, rather than CPU time - are you seeing something similar? Are there other costly queries by total time (rather than average time)? Also, just to get a sense of the size of your deployment, how many pipelines/jobs/builds are there in total? |
So no IO wait.
|
|
Appreciate those details. Interesting how different our own insights look. One thought - the bigint migrations leaves a ton of bloat in the DB. We ended up running a VACUUM FULL VERBOSE ANALYZE after upgrading, but this takes a long time and exclusively locks the tables. |
Ah, yeah, we forgot to do that after the upgrade. Gonna do a PG upgrade to 13 tonight, will try a vacuum aswell. 👍 |
|
Upgrade to PG13 failed for unrelated reasons, but a |
|
@simonjohansson thanks for checking that - an improvement, but there's probably a bigger culprit (probably that |
|
@aoldershaw yep that query is still the biggest consumer of resources, virtually no difference from the previous image (https://user-images.githubusercontent.com/736248/114151841-d7e2d300-991d-11eb-9db6-e50402861af5.png) Looking at a couple of examples from the query plan samples graph thingy its still 99% index scan on If it helps this is a old installation of Concourse, So I dunno if there is some weird state somewhere from an old Concourse version? |
|
@simonjohansson thanks for confirming. Taking a look into how we can optimize that query. No worries if not, but would you be willing to add a temporary index to your DB to measure the impact it has on that query's performance? It's basically identical to the existing On our fairly large environment, we saw the query time drop from ~25s to ~250ms on a really large job. Note that if you do end up adding the index, make sure you |
|
@simonjohansson Would you also be able to show us the entire string for query in the first row in that table? Thanks! |
|
@aoldershaw sure thing! Ill leave it running for a few hours and update. or perhaps more readable? |
|
Hmm, actually @aoldershaw that index doesnt seem to do much. |
|
@simonjohansson hm, that's unfortunate. @clarafu suggested a better index than the one I gave: This takes the original query that took ~20s down to ~20ms. Would you be willing to give that one a shot instead? Hopefully Postgres will realize it's a more optimal index to use than |
|
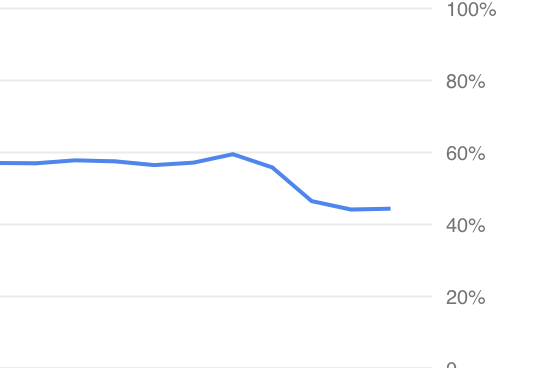
@aoldershaw Thanks! Applied it and
CPU usage down to 44% from ~57%, so an improvement! Still up from ~20% before the upgrade though :) |
|
@simonjohansson Good to know, thanks! Curious to see if that query is still the primary source of slowness after running for a while. Overall, we suspect that builds for checks will contribute a ton of bloat in other places as well, so we're discussing partitioning the builds table to not affect regular operations with the churn of creating/deleting these builds constantly. |
|
Hazzah,
Now the big query is the second, first one is |
Yeah, not sure what we can do about that to be honest. Nice to see the CPU drop a fair bit, but it's odd that it's still up 20% since upgrading, especially considering no other queries look too taxing on the DB. Let us know if you see any queries that seem to be really slow, either by total or average execution time. Also, thanks a lot for helping us debug! |
|
@aoldershaw super 👍 I'll plan it in for next week. |
|
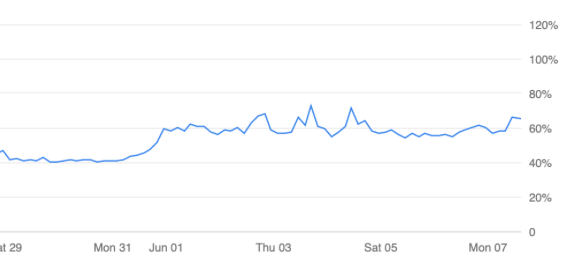
We are facing similar issues but the Our stack has ~500 pipelines. Before the update, running in 6.4.1, we had around 40% cpu usage on our db and some spikes during the day. But since the update, cpu usage is around 60% and are a bit concerned about it.
Here is our slowest query : SELECT
b.id,
b.name,
b.job_id,
b.resource_id,
b.resource_type_id,
b.team_id,
b.status,
b.manually_triggered,
b.created_by,
b.scheduled,
b.schema,
b.private_plan,
b.public_plan,
b.create_time,
b.start_time,
b.end_time,
b.reap_time,
j.name,
r.name,
rt.name,
b.pipeline_id,
p.name,
p.instance_vars,
t.name,
b.nonce,
b.drained,
b.aborted,
b.completed,
b.inputs_ready,
b.rerun_of,
rb.name,
b.rerun_number,
b.span_context
FROM
builds b
LEFT OUTER JOIN
jobs j
ON
b.job_id = j.id
LEFT OUTER JOIN
resources r
ON
b.resource_id = r.id
LEFT OUTER JOIN
resource_types rt
ON
b.resource_type_id = rt.id
LEFT OUTER JOIN
pipelines p
ON
b.pipeline_id = p.id
LEFT OUTER JOIN
teams t
ON
b.team_id = t.id
LEFT OUTER JOIN
builds rb
ON
rb.id = b.rerun_of
WHERE
b.completed = $1 AND b.drained = $2We also have lots of locks since the update to v7: |
|
@xeivieni It looks like you have the Hopping onto that question, do you also think its useful to drain one-off build logs? So for example, if someone ran Thanks! |
|
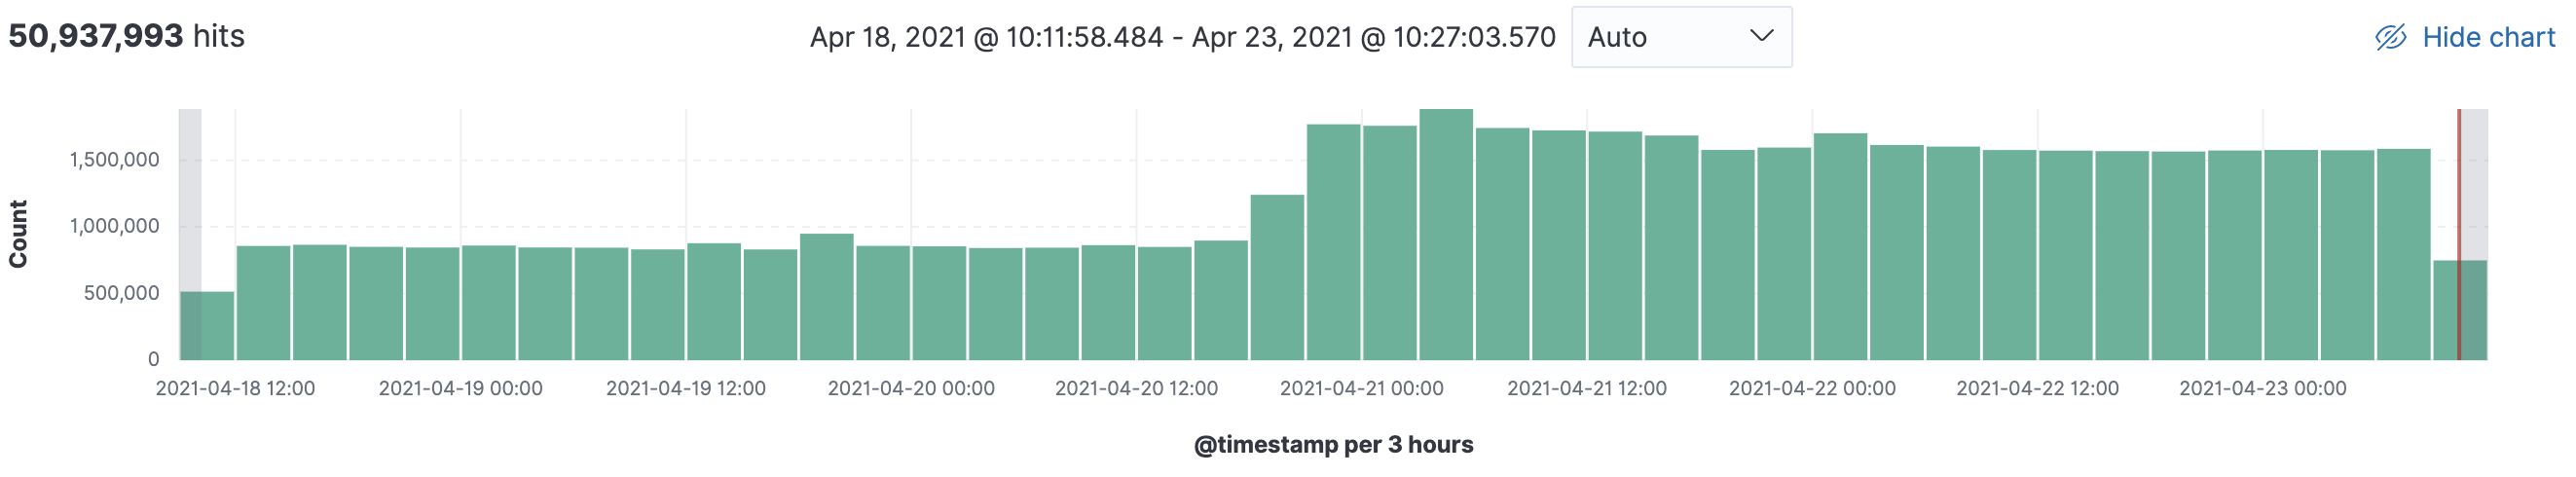
Hi @clarafu thanks for your answer. Indeed, the volume of logs sent to our ELK is way higher since our update : I'm not sure we absolutely need the check build logs to be pushed to our logging platform, but if it can provide information why not keeping it ? Can it have an impact on our database CPU usage or is it just an unrelated question ? |
|
Hi, we also tried to upgrade from 6.7.0 to 7.2.0 this weekend, but ran into the same issue. Cluster information
Notes from the upgrade related to the DB
Queries from Schema Inspection QueriesShow in-flight queries ...grouped by query, showing longest-running time: Show in-flight queries ...currently active running queries: Show the top N slowest queries Show foreign keys without an index Show the size and number of hits for each index AWS RDS Performance Insights:
unrelated to this specific issue, we also found out that For now, we have downgraded back to 6.7 because the environment was unusable. Let me know if theres any other information you need - happy to provide more (if we stored that while 7.2.0 was running :)). |
This is the only place on the entire web I have found so far that mentions this weird "query". If anyone has the slightest idea of what it is, please, share - it's affecting us too. |
Whats the breakdown for you? Currently for us |

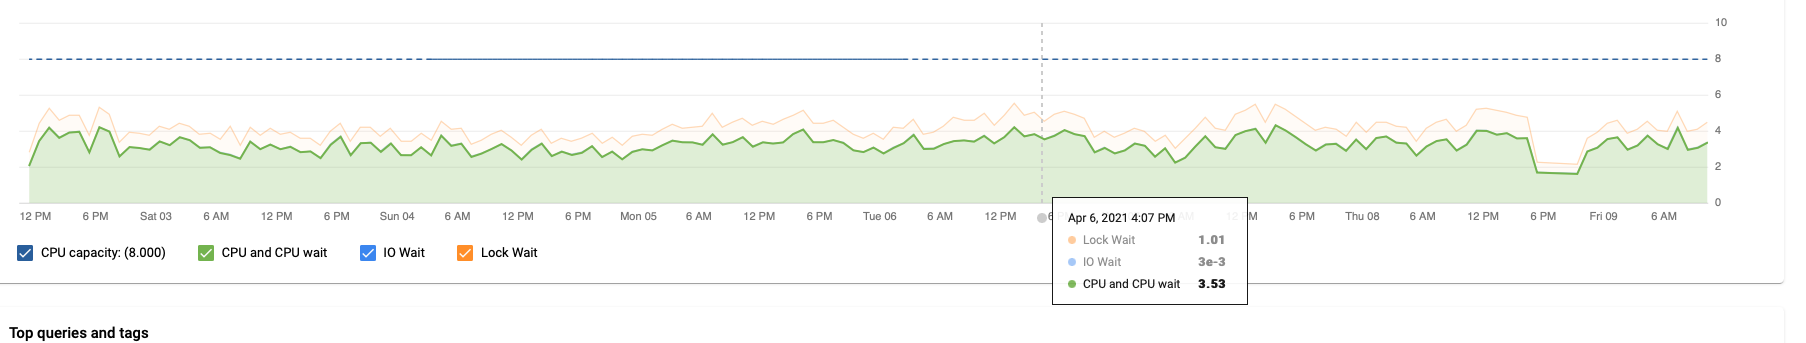
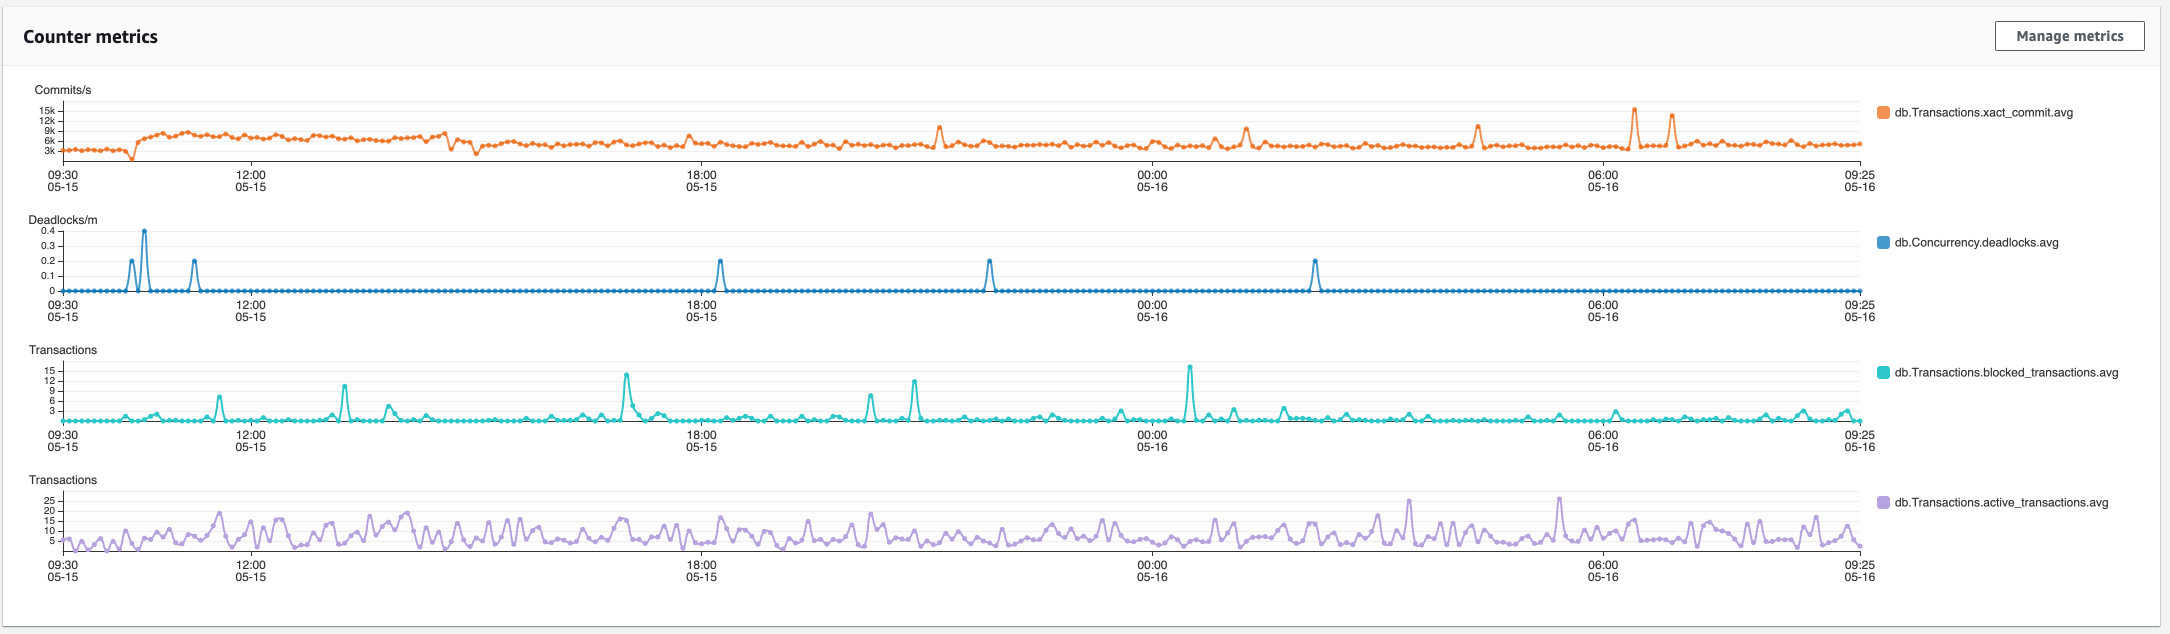
This is our staging instance (unfortunately, we have Query Insights disabled in production, there's currently a bug that makes it cause segfaults) over the last 6 hours. More CPU time than our actual heavy queries, seems to be always creating a background load of 20-30% with nothing else going on. Also, there were many instances in the past where it had a lot of lock wait (not as much as yours but still at least 1/3 of total time), just not this time. (This is a single-core PG 12 instance with 3.75 GB RAM) |

|
I was under the impression that the |
|
A new challenger appears after upgrading too 7.3.1. Running a PG 13 instance with 8 cores and 32GB Ram.
|

|
Did some digging, that query on its own shouldn't be super expensive at least. It's a direct index hit: Update on resource_configs (cost=0.41..8.43 rows=1 width=103) (actual time=0.031..0.031 rows=0 loops=1)
-> Index Scan using resource_configs_base_resource_type_id_so_key on resource_configs (cost=0.41..8.43 rows=1 width=103) (actual time=0.031..0.031 rows=0 loops=1)
Index Cond: ((base_resource_type_id = 5) AND (source_hash = 'x'::text))
Planning time: 0.090 ms
Execution time: 0.056 msIt'll be called every time a check runs but I wouldn't expect that query to be a bottleneck. 🤔 How'd you come across it? I guess just sorting that load by total time column? Would you mind running this query and sharing the results? Could help us get an idea of the scale we're comparing to. SELECT base_resource_type_id, count(1)
FROM resource_configs
GROUP BY base_resource_type_id;Thanks! |
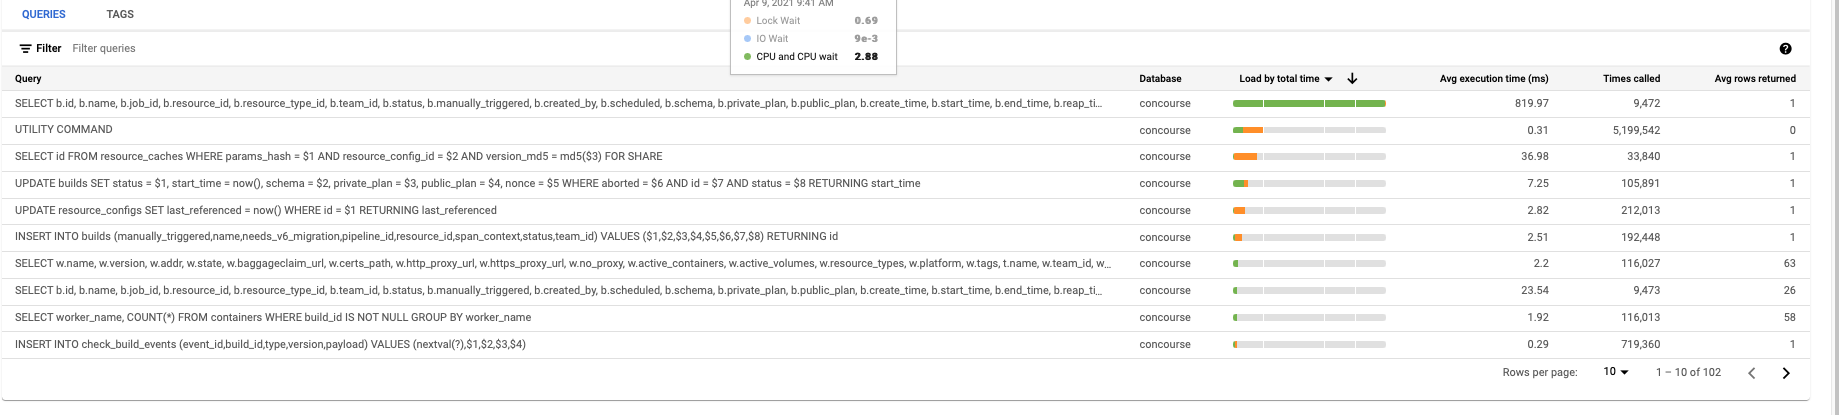
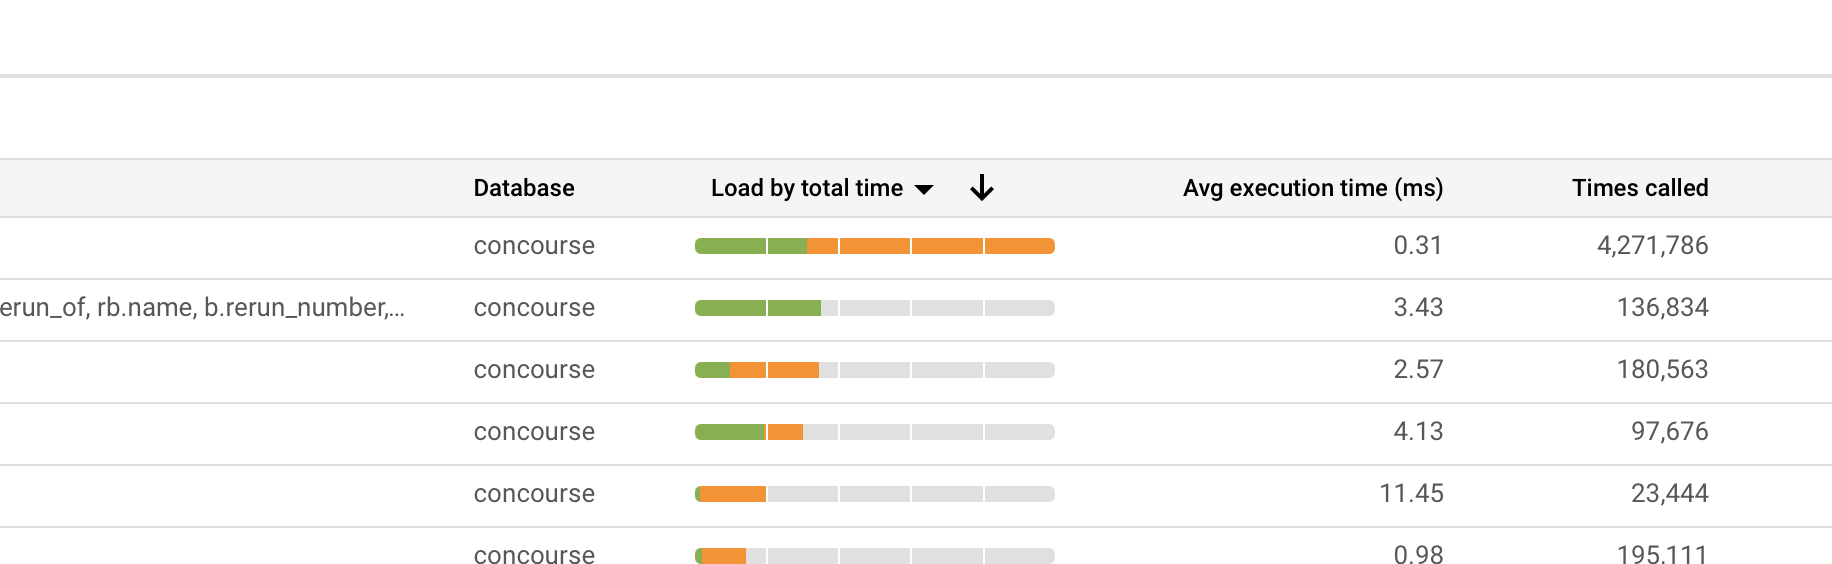
By default the query inspector sorts queries by Load by total time, thats how we found it. Orange colour means Lock Wait, green is CPU and CPU Wait.
|
Neat, good to know - that makes more sense then, so the query itself is doing very little (tiny green segment) but it's spending most of its time waiting around on locks, probably because the query is being run too often (combined with whatever other queries involve locking the table). Maybe we could adjust the query to not update every single time, and instead update when it's halfway or closer to the expiry time (1 hr check timeout + 5 mins by default). That would reduce writes from one per minute (per resource) to one per half hour or so (per resource). |
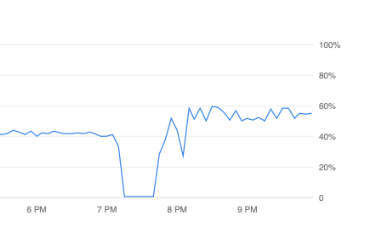
Every bit helps :) Do you know what else might have caused the spike and volatility of the load between 7.2 and 7.3.1?
7.2 was stable around 40% CPU for us and 7.3.1 is a bit all over the place |
|
Are the two queries in this issue related at all? Did anyone here find a workaround for the originally posted query? We'd like to upgrade to Concourse 7, but are still currently blocked by this. If there's any info I can give to help please let me know. |
|
@Rukenshia Admittedly this issue has kind of turned into an all-purpose inefficient database query hunting ground - we could close it with the next couple of fixes. The slowest query reported in your case (the one with the costly
Hmm checking the release history nothing immediately jumps out. I think we're doing the right thing in looking at the query performance. Maybe run the inspection queries again? Thanks everyone for your patience and for providing information that lets us whittle away at these performance issues. The 7.0 release introduced significant architectural changes that simplify the internal codebase, with the tradeoff being that it makes previously warm code paths hotter (namely, more builds are scheduled). The upside is that it has surfaced longstanding issues (e.g. #7120) and led to optimizations that should improve overall build performance, so despite the initial churn we're getting to a better place overall. |
|
Thanks a lot for the update, I really appreciate it and look forward to the fixes! |
Show foreign keys without an indexShow the size and number of hits for each index |
|
@simonjohansson @aoldershaw @VengefulAncient We were also wondering what the |
|
Ah thanks for looking into that @mhindery. In that case, I have a suspicion as to what that might be from, and I think it is something we can possibly improve in Concourse. My guess is that most of the I suggested an alternative approach in #6820 (comment) - basically, rather than running I'm not totally sure if this would improve performance over the current approach of creating a sequence for each build, since this would be a really heavily run query - but it's an idea to optimize the |
Actually, I think that's part of it, but given that there are way more |
|
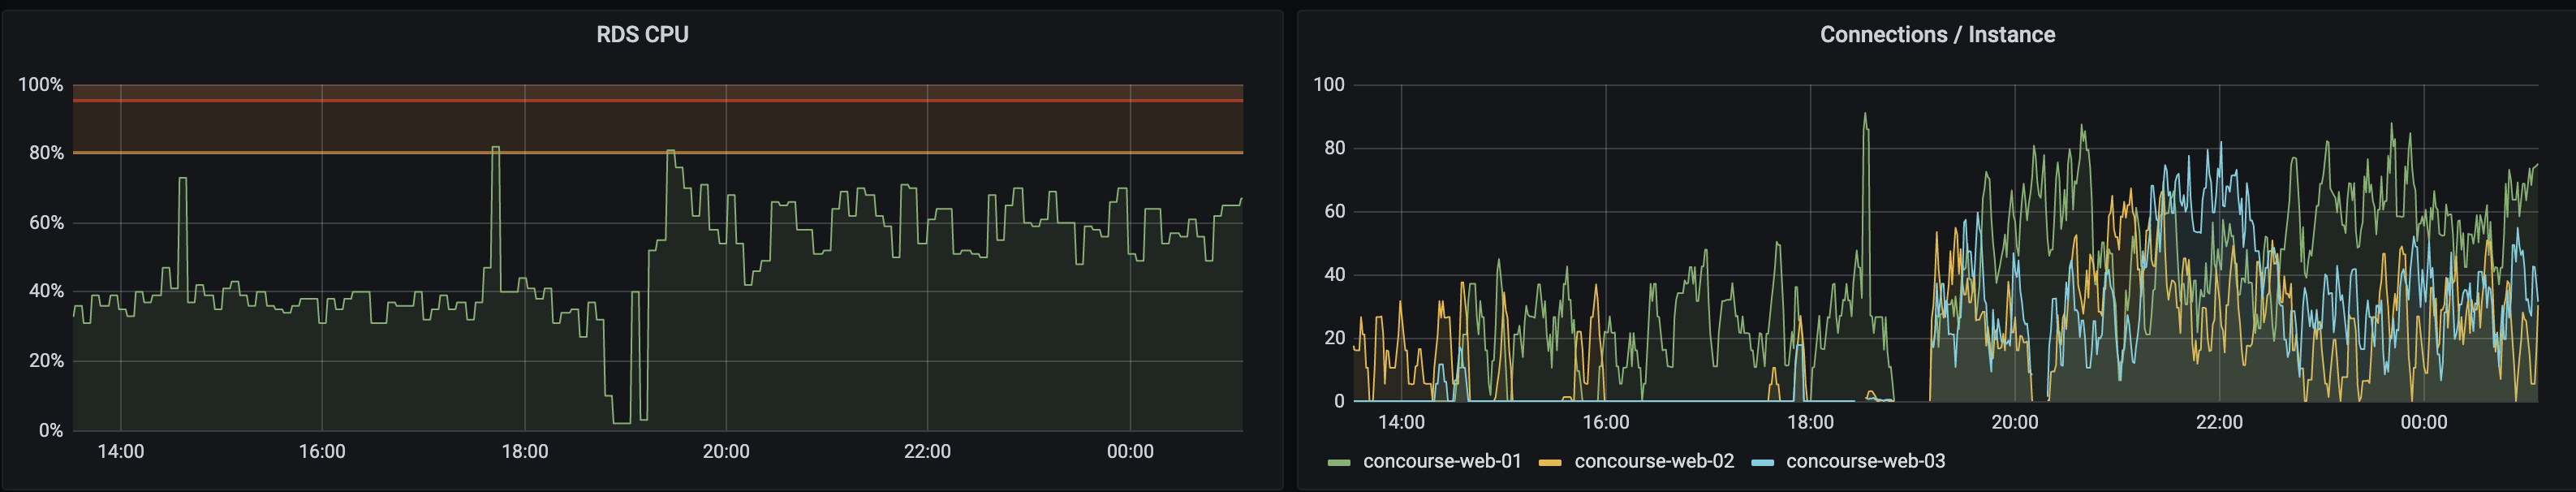
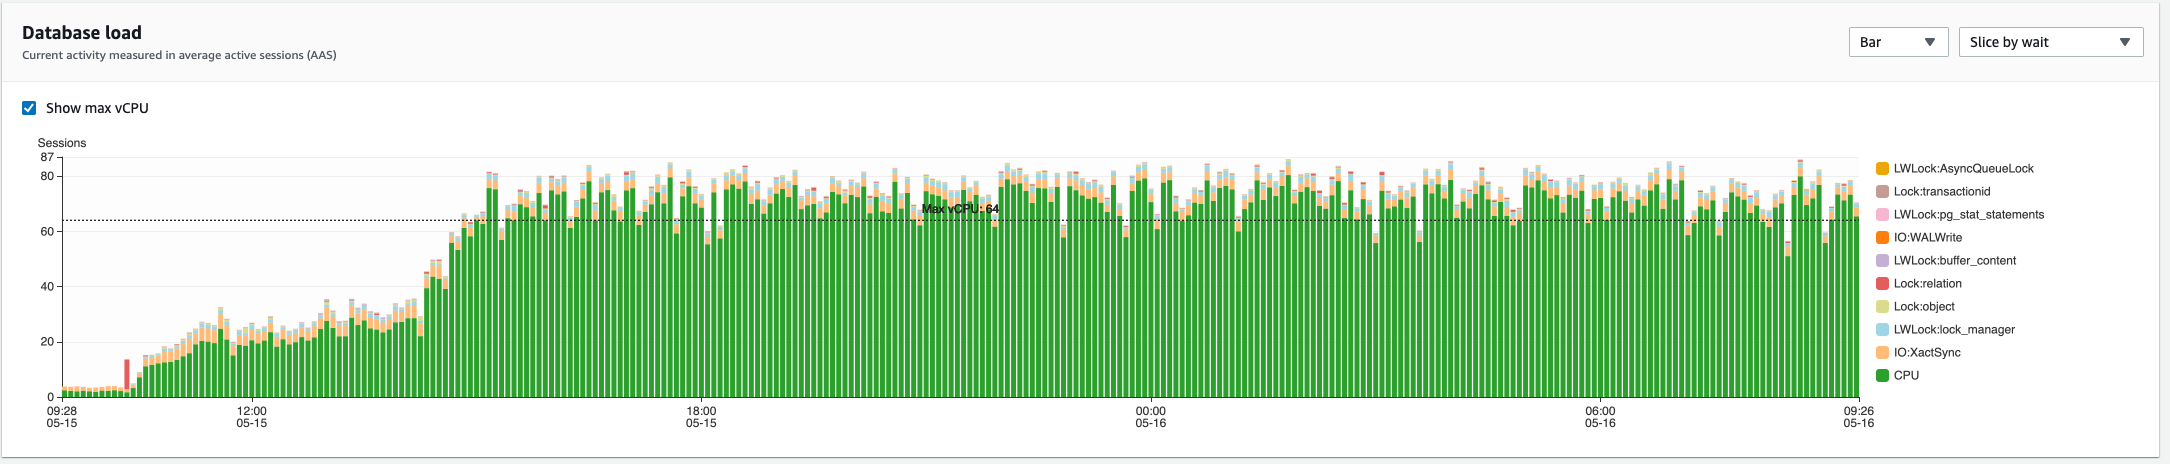
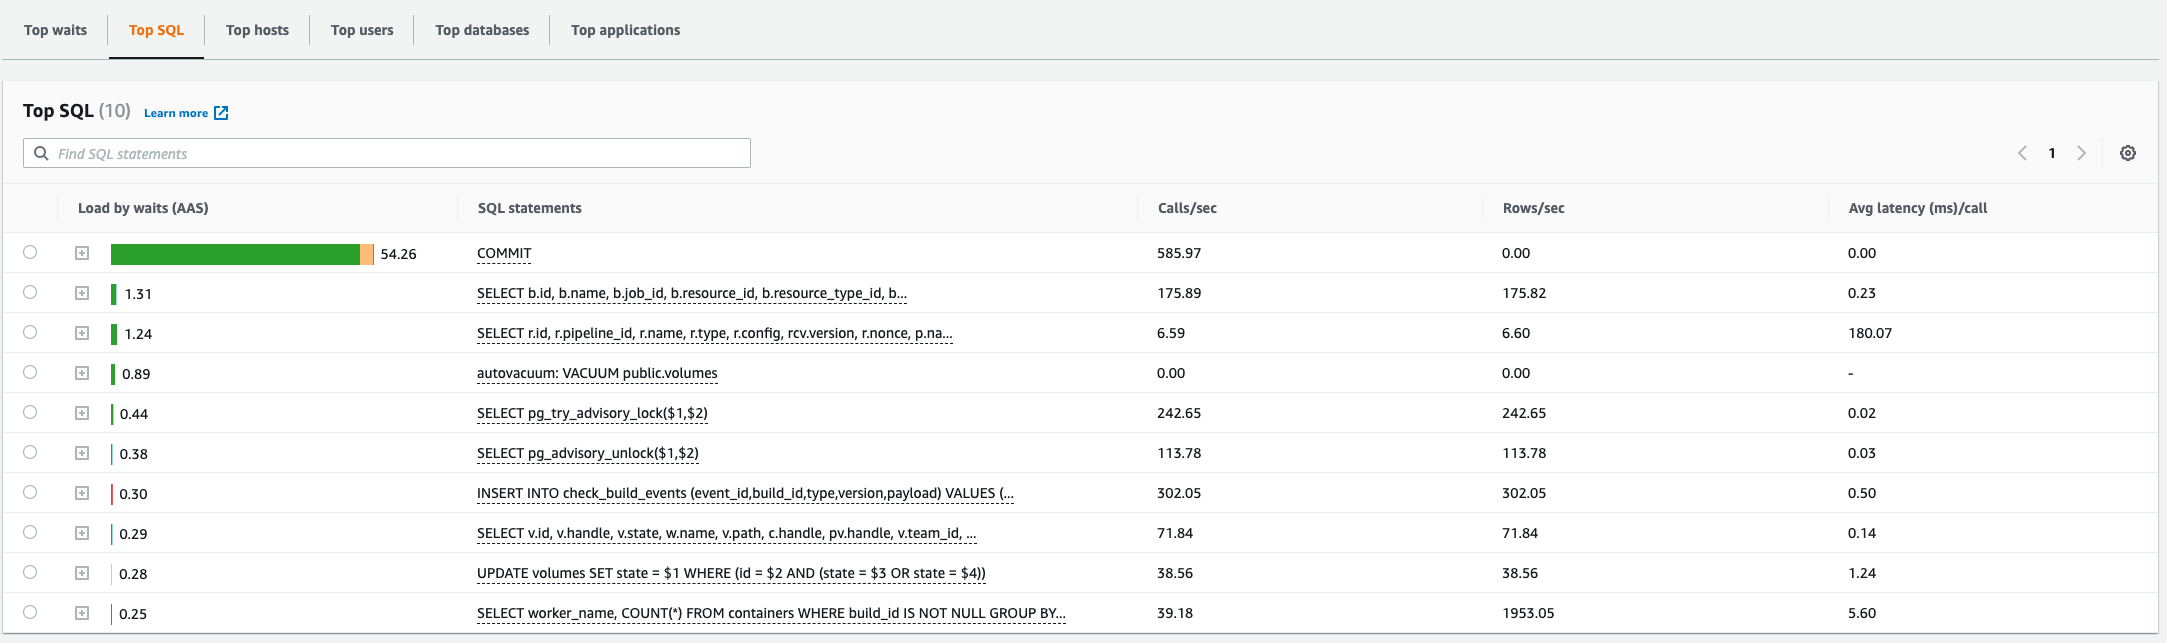
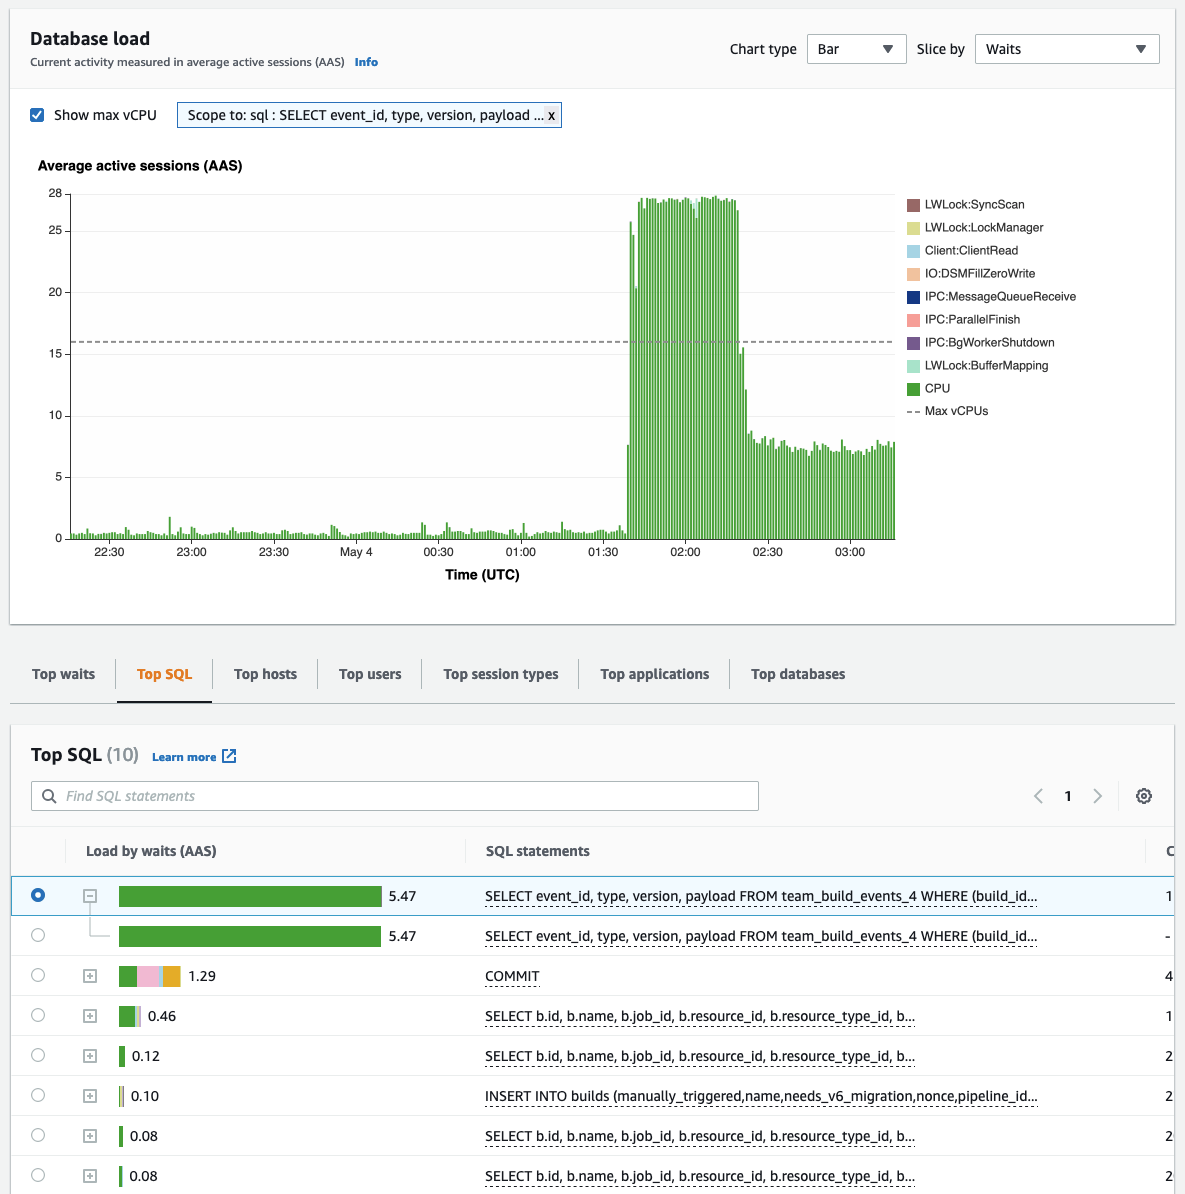
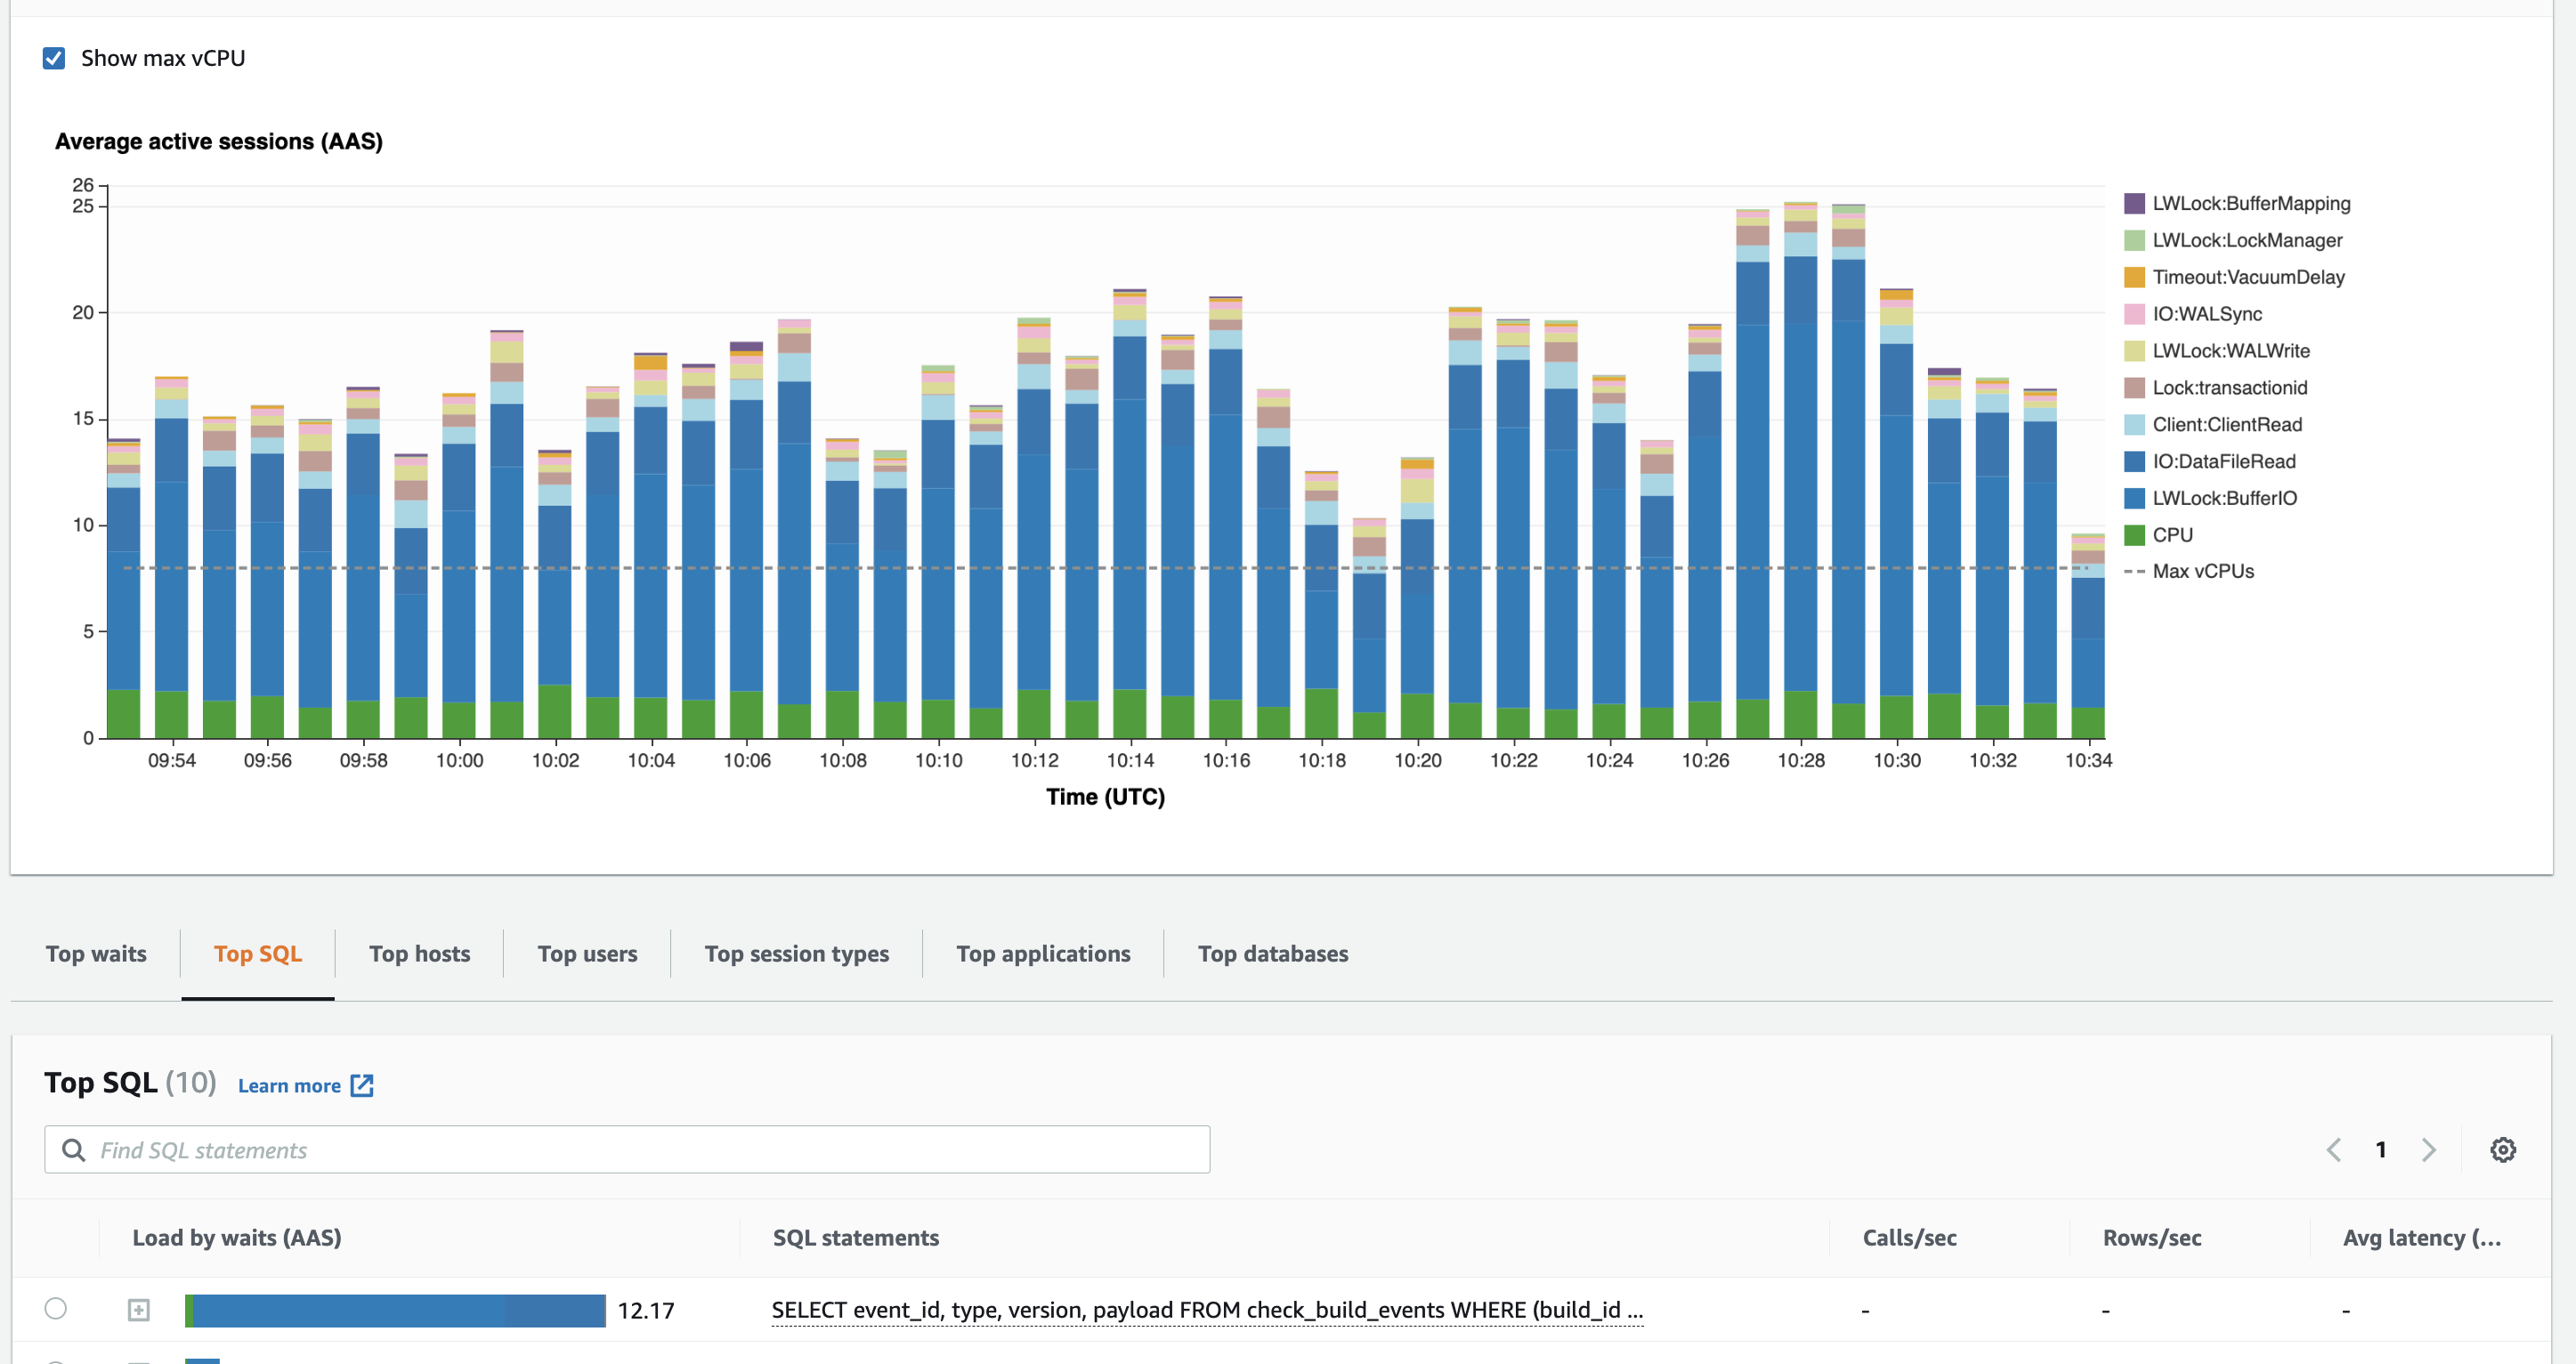
We are experiencing similar behaviour on 7.5. In our case it's purely CPU bound (usage pinned to 100% at the higher region, down to around 50% in the second stage).
For this case it looks like most of the CPU is this query: |
|
Regarding the query just above or similar (on our side the table is The table This index can cover very well the following query:
So, what will end-up happening on run-time is actually two queries running in parallel, the result of each will be merged to give the result, so:
SolutionNow the solution is very obvious and trivial, create the missing index: As you can see below, this index is totally removing the painful query from performance insight Before
After
|

Summary
After upgrading to concourse 7.0.0 I have noticed that sometimes our postgres database CPU will get pinned to 100% usage after a few hours. Currently my work around is to reboot the web node which will drop the CPU usage down.
Steps to reproduce
Run 7.0.0 for a few hours with AWS RDS as the postgres database provider.
Expected results
CPU doesn't get pinned.
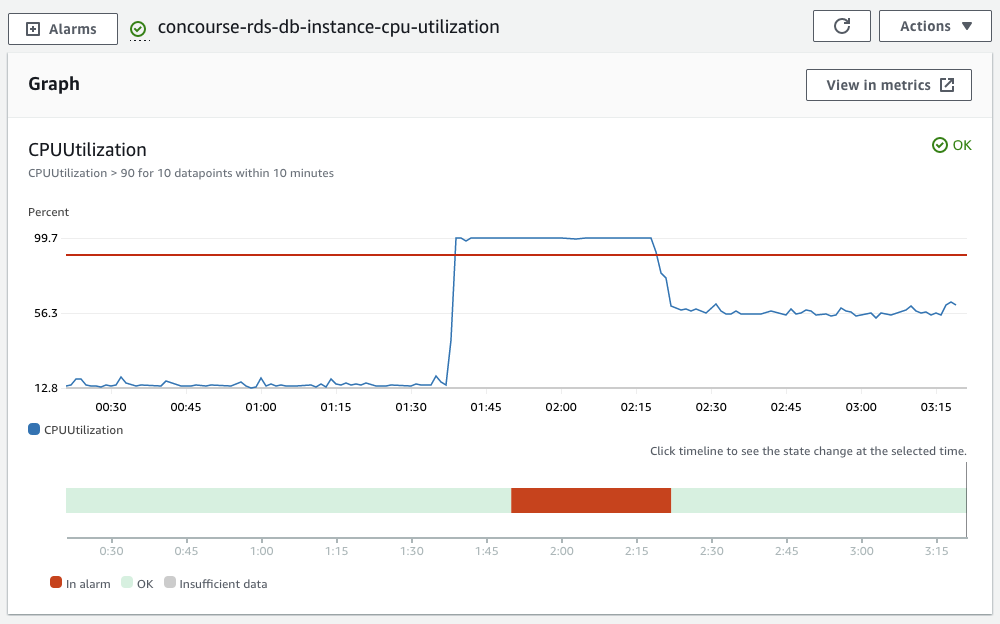
Actual results
Here is a screenshot of our RDS instance CPU metric over the past 24 hours.
Additional context
Triaging info
The text was updated successfully, but these errors were encountered: