Skip to content
New issue

Have a question about this project? Sign up for a free GitHub account to open an issue and contact its maintainers and the community.

By clicking “Sign up for GitHub”, you agree to our terms of service and privacy statement. We’ll occasionally send you account related emails.

Already on GitHub? Sign in to your account

[[hint]] silent=FALSE #193

Closed
Steviey opened this issue Feb 2, 2022 · 11 comments
Closed

[[hint]] silent=FALSE #193

Steviey opened this issue Feb 2, 2022 · 11 comments
Labels

Comments

@Steviey
Copy link

Steviey commented Feb 2, 2022

Hello,
I get different model-graphs with the same data and model-definitions in adam, auto_adam and smooth::es() when setting silent=FALSE. Is this normal, and what do the x-axes of the plots represent?

image

image

image

model_spec  <- adam_reg(
                    ets_model='ANN'
                    
                ) %>%
                    set_engine("adam",silent=FALSE)
                    model_spec<-parsnip::eval_args(model_spec)

                    set.seed(123)
                    wflw_fit<- workflow() %>%
                        add_model(model_spec) %>%
                        add_recipe(recipe_spec) %>%
                        fit(df_train)
                    
                    model_spec1  <- exp_smoothing(
                        error            = 'additive'
                        ,trend           = 'none'
                        ,season          = 'none'    
                    ) %>%
                    set_engine("smooth_es",holdout=FALSE,silent=FALSE)
                    model_spec1<-parsnip::eval_args(model_spec1)

                    set.seed(123)
                    wflw_fit<- workflow() %>%
                        add_model(model_spec1) %>%
                        add_recipe(recipe_spec) %>%
                        fit(df_train)

                    model_spec2  <- adam_reg(
                        ets_model='ANN'
                    ) %>%
                    set_engine("auto_adam",silent=FALSE)
                    model_spec<-parsnip::eval_args(model_spec2)

                    
                    set.seed(123)
                    wflw_fit<- workflow() %>%
                        add_model(model_spec2) %>%
                        add_recipe(recipe_spec) %>%
                        fit(df_train)

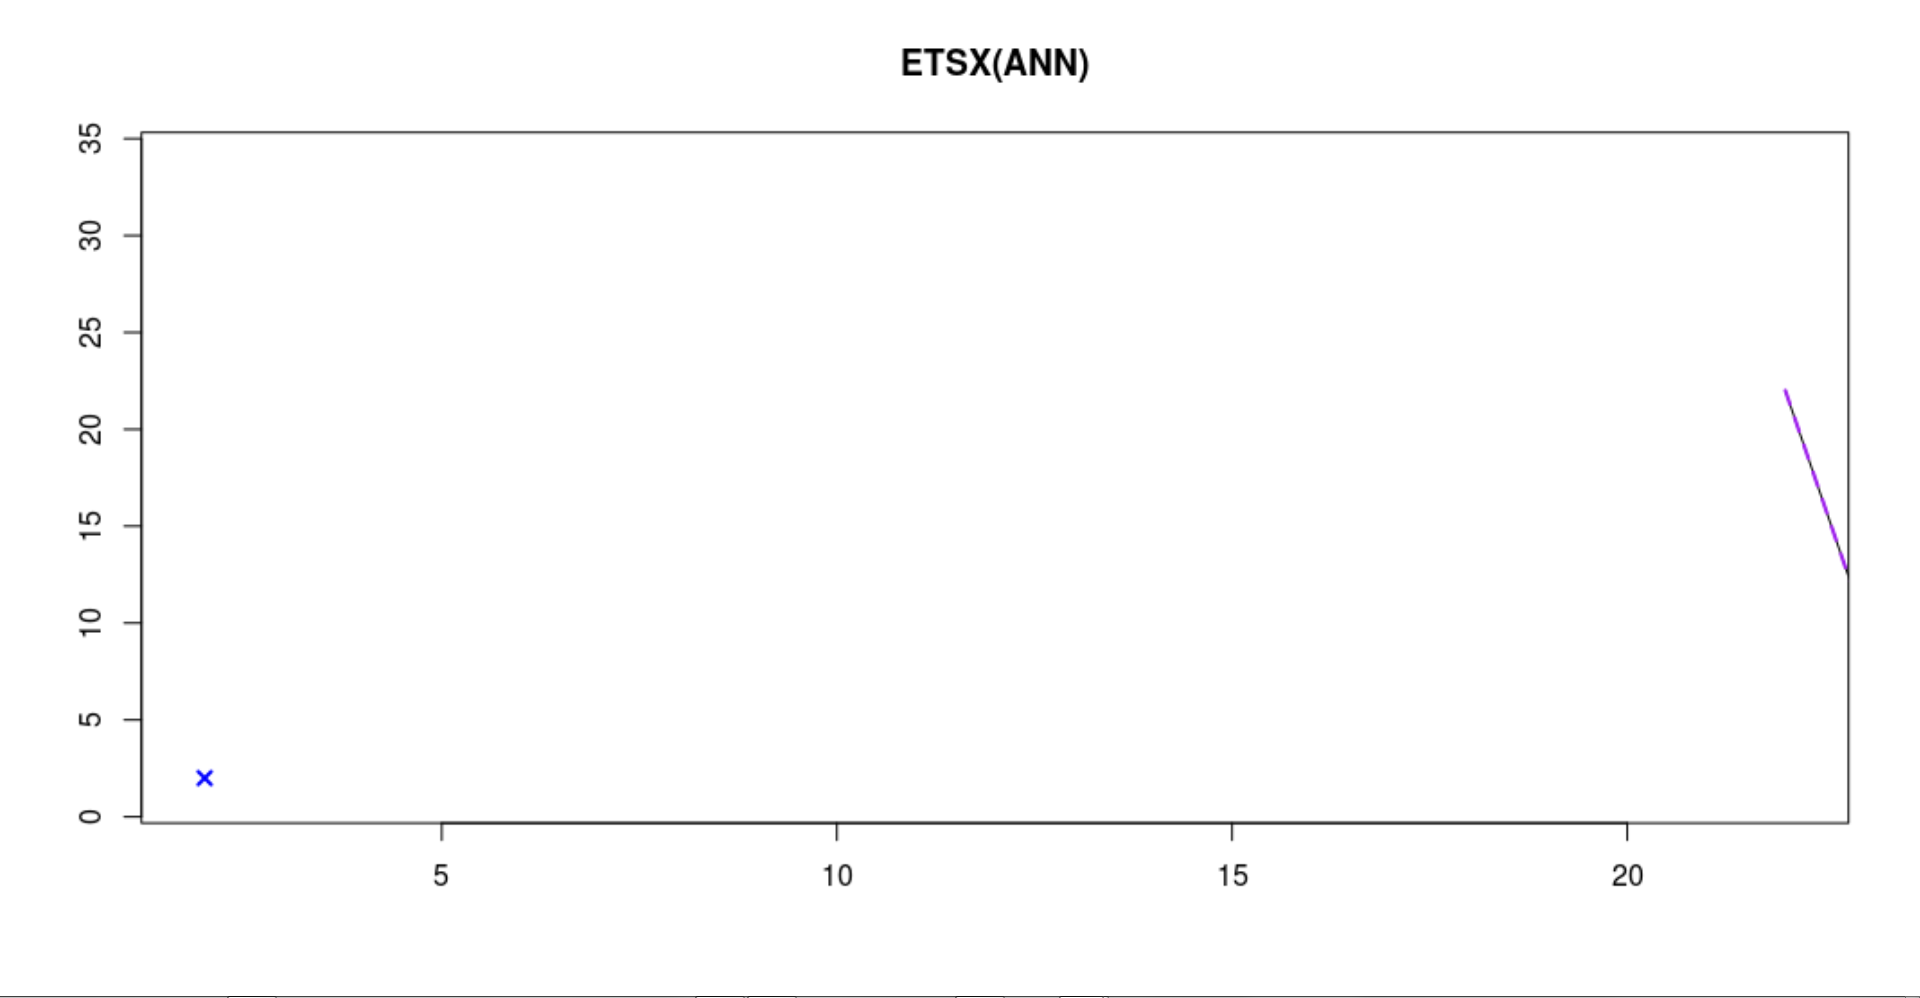
I also get this graph fitting ADAM, while cross validation for loss-function. What does the x on the left side mean?
image

@config-i1
Copy link
Owner

Looks like an issues with classes. Can you please provide a reproducible example (always do that if you can)?

@Steviey
Copy link
Author

Steviey commented Feb 3, 2022

The reproduce able example works fine so far.
Now I have a difference between the example code and a 30K-line-script :-). Which let me think, it could be related to the data-source.
What does the cross in the graph mean?
Noticed 1: Even LASSO and RIDGE are working now -not in the 'live-code'...have to investigate...
Noticed 2: Changing the model-def can lead to failure because of src (normal ETS-behaviour)
Noticed 3: Setting cumulative=FALSE leads to 'Failed to return valid external regressors.'
src-variance issue (normal)
Noticed 4: Shuffling the data can lead to the initial issue (example code updated).


options(scipen = 999)
options(dplyr.summarise.inform=F)
options(max.print=2000) 
library("Hmisc")
suppressPackageStartupMessages(library(lightgbm))
suppressPackageStartupMessages(library(digest))
suppressPackageStartupMessages(library(RSQLite))
suppressPackageStartupMessages(library(stringr))
suppressPackageStartupMessages(library(tidyr))
suppressPackageStartupMessages(library(dbplyr))
suppressPackageStartupMessages(library(rlang))
suppressPackageStartupMessages(library(freqdist))
suppressPackageStartupMessages(library(tidymodels))
options(tidymodels.dark = TRUE)
suppressPackageStartupMessages(library(modeltime))
suppressPackageStartupMessages(library(modeltime.ensemble))
suppressPackageStartupMessages(library(modeltime.resample))
suppressPackageStartupMessages(library(timetk))
suppressPackageStartupMessages(library(tidyverse)) 
suppressPackageStartupMessages(library(rsample)) 
suppressPackageStartupMessages(library(tidyquant))
suppressPackageStartupMessages(library(tibbletime))
suppressPackageStartupMessages(library(anomalize))
suppressPackageStartupMessages(library(smooth))
suppressPackageStartupMessages(library(lmtest))
suppressPackageStartupMessages(library(mgcv))
suppressPackageStartupMessages(library(fable))
suppressPackageStartupMessages(library(fabletools))
suppressPackageStartupMessages(library(tsibble))
suppressPackageStartupMessages(library(tsibbledata))
suppressPackageStartupMessages(library(tsfeatures))
suppressPackageStartupMessages(library(ggplot2))
suppressPackageStartupMessages(library(ggrepel))
suppressPackageStartupMessages(library(runner))
suppressPackageStartupMessages(library(ggformula))
suppressPackageStartupMessages(library(fANCOVA))
suppressPackageStartupMessages(library(stats))
suppressPackageStartupMessages(library(TTR))
suppressPackageStartupMessages(library(xts))
suppressPackageStartupMessages(library(vip))
suppressPackageStartupMessages(library(yardstick))
suppressPackageStartupMessages(library(plotly))
suppressPackageStartupMessages(library(catboost))
suppressPackageStartupMessages(library(treesnip))
suppressPackageStartupMessages(library(broom))
suppressPackageStartupMessages(library(finetune))
suppressPackageStartupMessages(library(tabnet))

prepModteltimeData<-function(df){
    ret<-list()
    rownames(df) <- NULL
    df      <-  df %>% dplyr::mutate(id=row_number()) %>% relocate(id)
    ret$df  <-  df
    df_tsbl <-  df %>% 
        as_tsibble(index=id)   
    
    df_split    <- rsample::initial_time_split(df_tsbl, prop = 0.8)
    train_len   <- length(df_split$in_id)
    test_len    <- length(df_split$out_id)

    df_tsbl     <- as.data.frame(df_tsbl) # modeltime input format

    splits <- df_tsbl %>%
        timetk::time_series_split(assess=test_len, cumulative = TRUE)#kann auch int rein!

    ret$df_train    <- rsample::training(splits)
    ret$df_test     <- rsample::testing(splits)

    ret$df_split<-df_split
    ret$ts_split<-splits

    myH<-1
    myLimit          <- as.numeric(nrow(df_tsbl)-myH)
    ret$trainOneStep <- df %>% filter(id <= myLimit)
    ret$testOneStep  <- df %>% filter(id > myLimit)

    return(ret)
}
getFormulaLocalEn<-function(xRegCols){
    xRegCols  <- xRegCols[xRegCols!='value'] 
    xRegCols  <- xRegCols[xRegCols!='id'] 
    xRegCols  <- xRegCols[xRegCols!='date'] 
    
    myFormula <- xRegCols
    myFormula <- paste0(myFormula, collapse= "+")
    myFormula <- paste0('value ~ date + ',myFormula)
    myFormula <- as.formula(myFormula)
    return(myFormula)
}    

y<-rnorm(120, mean=15, sd=5)
x<-c(
   rep(0.08,20)
   ,rep(0.20,20)
   ,rep(0.40,20)
   ,rep(0.60,20)
   ,rep(0.80,20)
   ,rep(1.0,20)
   )
x1<-c(
   rep(0.18,20)
   ,rep(0.21,20)
   ,rep(0.10,20)
   ,rep(0.61,20)
   ,rep(0.81,20)
   ,rep(1.0,20)
   )
     
data        <-data.frame(value=y,xReg=x,xReg1=x1)
# shuffle (new)
rows        <-sample(nrow(data))
data        <-data[rows, ]

dataLength  <-nrow(data)
myTime      <-tk_make_timeseries("2011", length_out=dataLength, include_endpoints = FALSE)
data$date   <-myTime

dataObj     <-prepModteltimeData(data)
df_train    <-dataObj$df_train
df_test     <-dataObj$df_test
allData     <-dplyr::bind_rows(df_train,df_test)

df_split    <-rsample::initial_time_split(df_train, prop = 0.75)
train_len   <-length(df_split$in_id)
test_len    <-length(df_split$out_id)

myFormula   <-getFormulaLocalEn(c('xReg','xReg1')) 
recipe_spec <- recipe(myFormula,df_train)

set.seed(123)
cvResamples <- allData %>%
    time_series_cv(
        assess   = test_len
        ,initial = train_len
        ,slice_limit = 10
    )

lossVect = c("RIDGE","LASSO","GTMSE","likelihood","MSE","MAE","HAM","MSEh","TMSE","MSCE")

algoGrid <- expand.grid(
    lossParam=lossVect
    ,dummy=c('A') 
    ,stringsAsFactors   = FALSE
    ,KEEP.OUT.ATTRS     = FALSE
)

results <- vector(mode = 'numeric', length = nrow(algoGrid))
idx<-0
for(ee in seq_len(nrow(algoGrid))){
    params  <- algoGrid[ee, ]
    myLoss  <- as.character(params[1,'lossParam'])
    print(myLoss)

    model_spec  <- adam_reg(
        ets_model      = 'ANN'
        ,loss          = myLoss
        ,distribution  = 'ds'
    ) %>%
    set_engine("adam",silent=FALSE,h=1)
    model_spec<-parsnip::eval_args(model_spec)

    set.seed(123)
    wflw<- workflow() %>%
        add_model(model_spec) %>%
        add_recipe(recipe_spec)

    error<-tryCatch({
        set.seed(123)
        wflw_fit<-fit(wflw,df_train)
        error<-0
    }, warning = function(w) {
        print(w)
        return(0)
    }, error = function(e) {
        print(e)
        return(1)
    }) 
    if(error>0){
        msg<-paste('Loss-Function failed...',title)        
    }else{
        print('kein Error')
    }
}

infoTest <- cvResamples$splits[[1]] %>% analysis()
infoTest %>% glimpse()
infoTrain <- cvResamples$splits[[1]] %>% assessment()
infoTrain %>% glimpse()

myPlot<-cvResamples %>%
    tk_time_series_cv_plan() %>%
    plot_time_series_cv_plan(
        date, value,
        .facet_ncol  = 1,
        .interactive = TRUE
    )

View(cvResamples)
View(infoTrain)
View(infoTest)
#print(myPlot)
stop('Finished!')

image

Shuffled except date-var:
image

@Steviey
Copy link
Author

Steviey commented Feb 3, 2022

holdout seems to play a role...

model_spec  <- exp_smoothing(
        error           = 'additive'
        ,trend           = 'none'
        ,season          = 'none'    
        # ,damping          = 1   
        # ,smooth_level     = 1
        # ,smooth_trend    = param6
        # ,smooth_seasonal = param7
    ) %>%
    set_engine("smooth_es",holdout=TRUE,silent=FALSE)
    model_spec<-parsnip::eval_args(model_spec)

smooth::es() (via modeltime wrapper)
Noticed 5:
msg: <simpleWarning: The exogenous variables contain NAs! This may lead to problems during estimation and in forecasting.
Substituting them with 0.>

... is preventing the plotting in smooth (via modeltime)... code add...

colVect     <-  c('value','xReg')
data        <-  data %>% dplyr::mutate_at(all_of(colVect),as.numeric)
data        <-  data %>% dplyr::mutate(xReg=lag(xReg,n=1))
# comment this out to get the effect...
data        <-  data %>% dplyr::mutate_at(vars(matches("xReg")), ~tidyr::replace_na(.x,mean(.x,na.rm=T)))

Update: msg-issue: Solved, must be an internal from modeltime/tidymodels, because plotting of extracted model works as expected. Even with NA-msg.

Plotting an extracted model via smooth:

wflw_fit<-fit(wflw,df_train)
        myModel<-wflw_fit[['fit']][['fit']][['fit']][['models']][['model_1']]
        myPlot<-plot(myModel,7)
        print(myPlot)
        stop()

Doing the same (plotting extracted model) with ADAM brings:

Fehler in if (any(noVariability) && any(all.vars(formulaToUse) %in% names(noVariability))) { :
Fehlender Wert, wo TRUE/FALSE nötig ist

myModel <- adam(df_train,"ANN", silent=FALSE,h=12, holdout=TRUE)
    myPlot  <- plot(myModel,7)
    #myPlot<-ggplotly(myPlot)
    print(myPlot)
    stop()

@Steviey
Copy link
Author

Steviey commented Feb 3, 2022

Can't reproduce it native.

@Steviey Steviey closed this as completed Feb 3, 2022
@Steviey
Copy link
Author

Steviey commented Feb 4, 2022

I can reproduce the chart-design (native) by setting h=1


idx=120
    y<-rnorm(idx, mean=15, sd=5)
    x<-cbind(
        x1 =  rnorm(idx, mean=15, sd=5)
        ,x2 =  rnorm(idx, mean=15, sd=5)
    )    

    fitXregs    <- data.frame(x=x,y=y,stringsAsFactors=F)
    fitXregs    <- fitXregs %>% dplyr::relocate(y)
    myModel <- adam(fitXregs,"ANN",silent=FALSE,h=1,holdout=TRUE)

image

I' m not sure if this is right- comparing to the book-chapter....

image

https://openforecast.org/adam/SES.html

Hinting with ggplot+plotly

idx=120
    y<-rnorm(idx, mean=15, sd=5)
    x<-cbind(
        x1 =  rnorm(idx, mean=15, sd=5)
        ,x2 =  rnorm(idx, mean=15, sd=5)
    )    

    fitXregs    <- data.frame(x=x,y=y,stringsAsFactors=F)
    fitXregs    <- fitXregs %>% dplyr::relocate(y)
    
    myModel <- adam(fitXregs,"ANN",silent=TRUE,h=10,holdout=FALSE)
    #myModel <- smooth::es(df_train,model='ANN',h=1,holdout=TRUE,silent=TRUE)
            
    y           <-myModel[['data']][['y']]
    myFitted    <-myModel[['fitted']]
    myResiduals <-myModel[['residuals']]
    myFc        <-myModel[['forecast']]
    
    myFuture    <- data.frame(forecast=myFc)
    
    myData      <- data.frame(actual=y,fitted=myFitted,residuals=myResiduals)
    dataLen     <- nrow(myData)
    myData      <- dplyr::bind_rows(myData,myFuture)
    myData      <- myData %>% dplyr::mutate(id=row_number()) %>% relocate(id)
    myIntercept <- myData[dataLen,'id']
    
    # wide to long
    library(reshape2)
    subToLong = myData[,c(1,2,3,5)]
    myData    = melt(subToLong, id=c("id"))

    myPlot      <- ggplot(myData) 
    myPlot      <- myPlot + geom_line(aes(x=id, y=value, colour=variable)) 
    myPlot      <- myPlot + geom_vline(xintercept=myIntercept, linetype="dashed", color = "#FF6900",size = 0.5)
    myPlot      <- myPlot + scale_colour_manual(values=c("black","red","blue"))

    myPlot      <- ggplotly(myPlot)       

    print(myPlot)    

image

Noticed 6: It also has a problem with: 'h=1'. Since modeltime had the same for a while, it seems to be a common problem in fc-plots. Anyway, this hint was fun :-).

image

Finally: fixing the hint... finding the lost one step forward fc (h=1, ~conditional mean)... :-).

image

     [...]

    dataLen1    <- nrow(myData)
    hintPoint   <- myData[dataLen1,c('id','value')]
    
    myPlot      <- ggplot(myData) 
    myPlot      <- myPlot + geom_line(aes(x=id, y=value, colour=variable)) 
    myPlot      <- myPlot + geom_vline(xintercept=myIntercept, linetype="dashed", color = "#FF6900",size = 0.5)
    myPlot      <- myPlot + scale_colour_manual(values=c("black","red","blue"))
    myPlot      <- myPlot + ggtitle(title)
    myPlot      <- myPlot + geom_point(data=hintPoint,aes(x=id, y=value), colour="green",size=3)
    myPlot      <- ggplotly(myPlot)       

    print(myPlot)

@Steviey Steviey reopened this Feb 4, 2022
@Steviey Steviey changed the title silent=FALSE [[hint]] silent=FALSE Feb 4, 2022
@config-i1
Copy link
Owner

config-i1 commented Feb 6, 2022

Are you using the most recent version of the smooth package? I cannot reproduce this. Here is what I get for the first part of your code:
image

Also please make sure that you use the latest version of the greybox package

@config-i1 config-i1 added the bug label Feb 6, 2022
@Steviey
Copy link
Author

Steviey commented Feb 7, 2022

I noticed yesterday, that my local versions are way to old. I am working on multiple instances, sorry.

@Steviey Steviey closed this as completed Feb 7, 2022
@Steviey
Copy link
Author

Steviey commented Feb 7, 2022

Windows 7, greybox 1.0.5.41001, smooth 3.1.6.41004, R version 4.0.5
I get the following:


idx=120
    y<-rnorm(idx, mean=15, sd=5)
    x<-cbind(
        x1 =  rnorm(idx, mean=15, sd=5)
        ,x2 =  rnorm(idx, mean=15, sd=5)
    )    

    fitXregs    <- data.frame(x=x,y=y,stringsAsFactors=F)
    fitXregs    <- fitXregs %>% dplyr::relocate(y)
    myModel <- adam(fitXregs,"ANN",silent=FALSE,h=10,holdout=TRUE)

image

idx=120
    y<-rnorm(idx, mean=15, sd=5)
    x<-cbind(
        x1 =  rnorm(idx, mean=15, sd=5)
        ,x2 =  rnorm(idx, mean=15, sd=5)
    )    

    fitXregs    <- data.frame(x=x,y=y,stringsAsFactors=F)
    fitXregs    <- fitXregs %>% dplyr::relocate(y)
    myModel <- adam(fitXregs,"ANN",silent=FALSE,h=1,holdout=TRUE)

image

@Steviey Steviey reopened this Feb 7, 2022
@config-i1
Copy link
Owner

config-i1 commented Feb 7, 2022

The same code can be simplified to (for reproducibility purposes, so that I do not need to load tidyverse packages):

idx <- 120
x<-cbind(
    y = rnorm(idx, mean=15, sd=5),
    x1 =  rnorm(idx, mean=15, sd=5),
    x2 =  rnorm(idx, mean=15, sd=5)
)

fitXregs <- as.data.frame(x, stringsAsFactors=F)
myModel <- adam(fitXregs,"ANN",silent=FALSE,h=10,holdout=TRUE)

But this is what I get:
image

And this is with h=1:
image

So, I still cannot reproduce this.

@config-i1
Copy link
Owner

I assume that this can be closed now.

@Steviey
Copy link
Author

Steviey commented Feb 7, 2022

Should be environment related.

Sign up for free to join this conversation on GitHub. Already have an account? Sign in to comment
Labels
Projects
None yet
Development

No branches or pull requests

2 participants