![]()
![]()
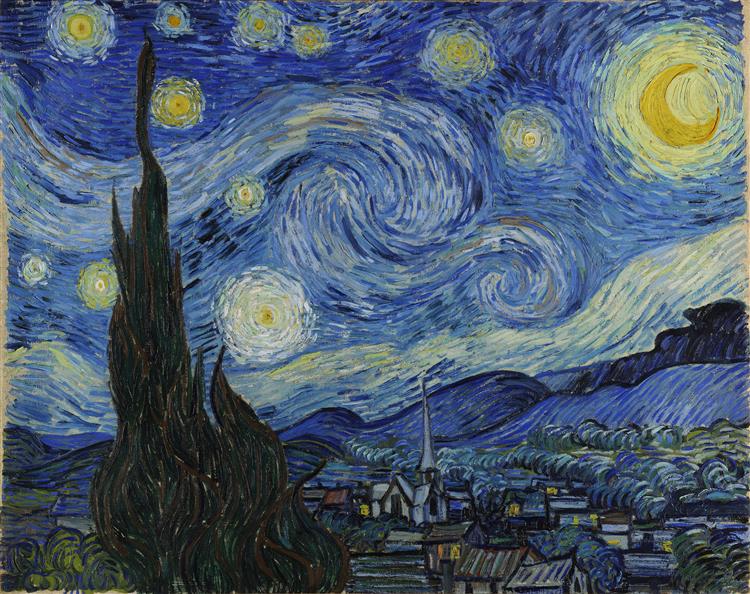
The ‘ggRtsy’ package works with ‘ggplot2’ to add an additional color
palette to the user’s repertoire. This is the goghColors dataset,
which contains the RGB and hex codes of colors picked from Van Gogh
paintings. It has been broken down into an easy-to-use color palette
based on Van Gogh’s most famous paintings, in the gogh_palettes_pop
list.
It also has a function that work alongside ggplot to create more interesting data visualizations and add contextual information to the user’s plots.
-
RectangleFiller() - divides data visualizations into a specified number of colored quadrants based on the number of input colors, improving the readability of graphs.
-
scale_color_gogh() - used to color the point/lines of your ggplot
-
scale_fill_gogh() - used to fill the inner color/bars of your ggplot
-
rgbToHeX() - used to convert rgb color codes to hex color codes
-
gogh_interpolate() - interpolates between the colors in
gogh_palettes_pop
Using Hex Codes from the dataset goghColors, three colors were added
on top of a ggplot() sample scatter plot. Based on the plot, the
function automatically calculated three equal widths of the rectangles,
and stretched them to upper and lower bounds on the y-axis.
RectangleFiller(plotExample, c("#e32636", "#9966cc", "#f4c2c2"))
ggplot(exampleData, aes(x = height, y = mass, color = birth_year)) +
  geom_point(size = 3) +
  scale_color_gogh(palette = "cafeTerrace", discrete = FALSE, reverse = TRUE) +
  theme_minimal()
ggplot(storms, aes(x = category, fill = status)) +
  geom_bar() +
  scale_fill_gogh(palette = "almondBlossoms", discrete = TRUE, reverse = FALSE) +
  theme_minimal()
This package also comes with rgbToHex(), converting rgb colors into hex code colors.
rgbToHex(c("(225, 104, 39)", "(60, 90, 202)"))
#> [1] "#e16827" "#3c5aca"Get the development version from GitHub:
# Install remotes if needed:
# install.packages("remotes")
remotes::install_github("katelyndiaz/ggRtsy")
And load it with
library(ggRtsy)starryNight = ‘#23338C’, ‘#30478C’, ‘#5377A6’, ‘#BDBF7E’,
‘#BFA72C’
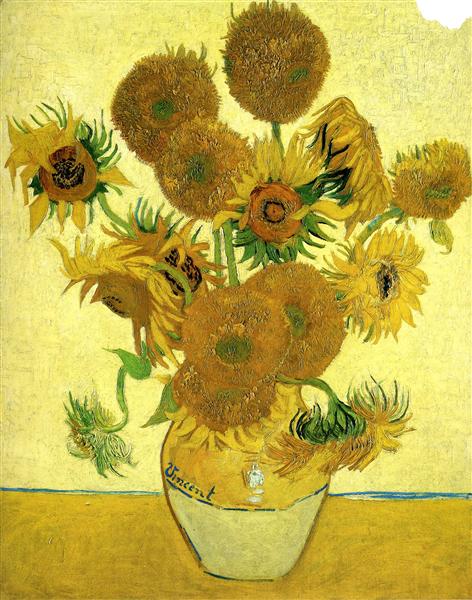
sunflowers = ‘#74A629’, ‘#F2EB80’, ‘#F2E085’, ‘#BF9821’,
‘#A6681C’
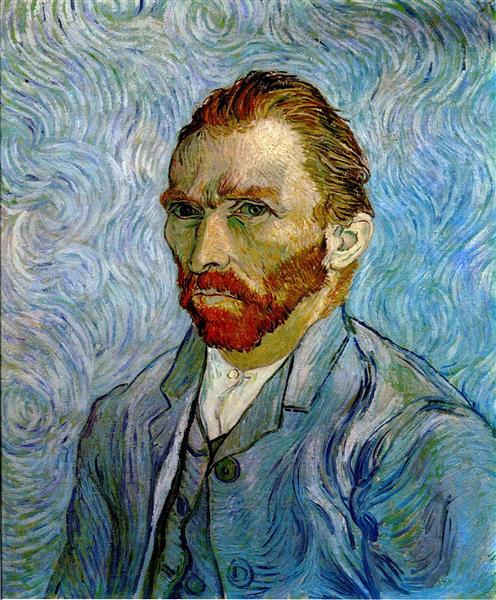
selfPortrait = ‘#021F59’, ‘#63A5BF’, ‘#8C701C’, ‘#BF9B6F’,
‘#730202’
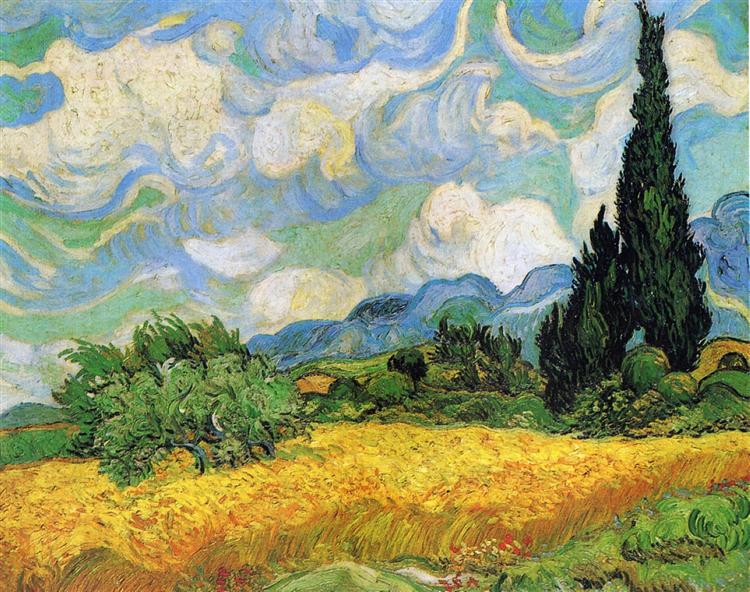
wheatField = ‘#73A9D9’, ‘#477332’, ‘#D9B13B’, ‘#D98E32’,
‘#A66329’
cafeTerrace = ‘#2A6BBF’, ‘#3F6CA6’, ‘#F2C84B’, ‘#D99036’,
‘#BF6734’
.jpg!Large.jpg)
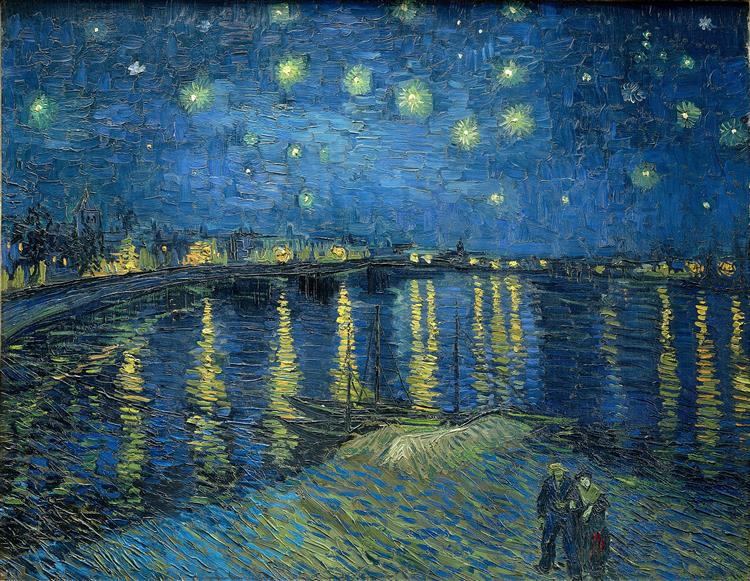
rhoneStarry = ‘#073359’, ‘#27668C’, ‘#5A98BF’, ‘#60734D’,
‘#A3A658’
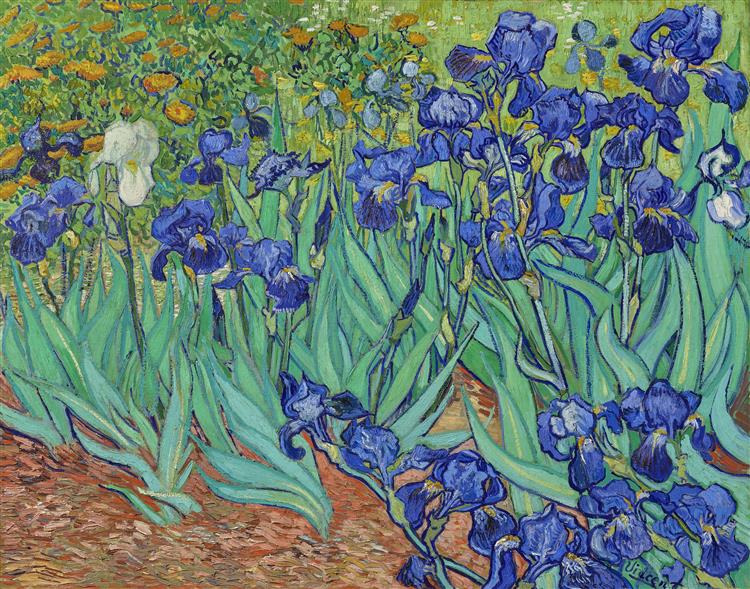
irises = ‘#415AA6’, ‘#6382BF’, ‘#65A67C’, ‘#8CA653’, ‘#A66D58’
almondBlossoms = ‘#236E8C’, ‘#20788C’, ‘#49B3BF’, ‘#41BFBF’,
‘#BDBF75’
.jpg!Large.jpg)