


Zarque-profiling is a data profiling tool that is 3x faster than Pandas-profiling. Zarque-profiling offers a new option for your big data profiling needs.
Zarque-profiling has the same features, analysis items, and output reports as Pandas-profiling, with the ability to perform minimal-profiling (minimal=True), maximal-profiling (minimal=False), and the ability to compare two reports.
Note:
For big data, it is not recommended to use maximal-profiling (minimal=False) because of the time required for the analysis process. Minimal-profiling (minimal=True) is set as the default.
Zarque-profiling is based on pandas-profiling (ydata-profiling) and uses Polars instead of Pandas to speed up the analysis process.
- Profiling large datasets as a standalone package
Profiling of large data sets that Pandas-profiling is too time consuming to handle.
Data profiling when Polars is used for data analytics and data science. - Seamless integration with existing packages
- EDA (Exploratory Data Analysis)
Simple data analysis without writing code. (histograms, scatter plots, heat maps, text analysis) - Comparing multiple version of the same dataset (profiling reports)
Compare data before and after data wrangling.
Compare training data with evaluation data by machine learning. - Data preparation/Data migration solution business
Estimation of man-hours required.
Help to create data specification.
Determine if dataset should be migrated or not.
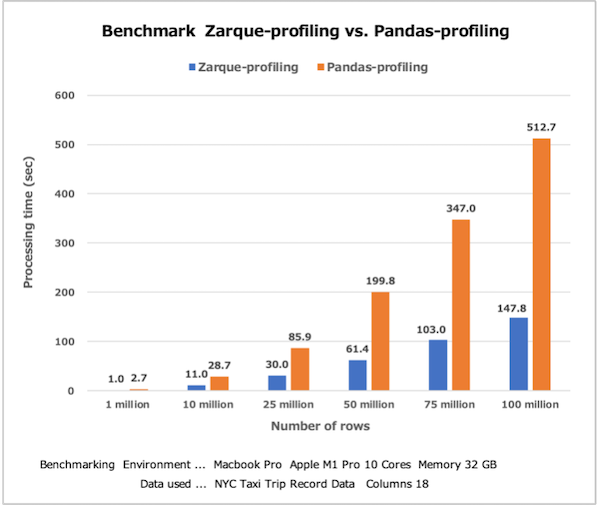
The figure below shows the benchmark results of data acquisition and analysis processing time for 1 million to 100 million rows in minimal profiling (minimal=True). This data is for reference only. Processing times vary depending on the performance of the PC used and the amount of memory.
You can install using the pip package manager.
pip install zarque-profiling... See Pandas-profiling for details on usage.
Prepare Polars data-frame.
import polars as pol
# CSV file
df = pol.read_csv("path/file_name.csv")
# Parquet file
df = pol.read_parquet("path/file_name.parquet")
Generate the standard profiling report.
from zarque_profiling import ProfileReport
# Minimal-profiling
ProfileReport(df, title="Zarque Profiling Report")
# Maximal-profiling
ProfileReport(df, minimal=False, title="Zarque Profiling Report")
Using inside Jupyter Lab.
report = ProfileReport(df)
# Displaying the report as a set of widgets
report.to_widgets()
# Directly embedded in a cell
report.to_notebook_iframe()
Exporting the report to a file.
# As a HTML file
report.to_file("path/file_name.html")
# As a JSON file
report.to_file("path/file_name.json")
Compare 2 profiling reports.
from zarque_profiling import compare
df1 = pol.read_csv("path/file_name.csv")
df2 = pol.read_csv("path/file_name_corrected.csv")
report1 = ProfileReport(df1, title="Original Data")
report2 = ProfileReport(df2, title="Corrected Data")
compare([report1, report2])For big data, the following code example takes long time for the analysis process.
Correlation Diagram (spearman, pearson, phi_k, cramers and kendall).
ProfileReport(
    df,
    minimal=False,
    correlations={
        "spearman": {"calculate": True, "warn_high_correlations": True, "threshold": 0.9},
        "pearson" : {"calculate": True, "warn_high_correlations": True, "threshold": 0.9},
        "phi_k"   : {"calculate": True, "warn_high_correlations": True, "threshold": 0.9},
        "cramers" : {"calculate": True, "warn_high_correlations": True, "threshold": 0.9},
        "kendall" : {"calculate": True, "warn_high_correlations": True, "threshold": 0.9},
        "auto"    : {"calculate": False, "warn_high_correlations": False, "threshold": 0.9}
    }
)
Text analysis (length distribution, word distribution and character information).
ProfileReport(
    df,
    vars={"cat": {"length": True, "words": True, "characters": True}}
)
Change matplotlib Font-family.
If Japanese column names are used, change the default font to a font that can display Japanese.
The following code is an example of setting up an IPAex font (Japanese fonts).
ProfileReport(
    df,
    minimal=False,
    font_family="IPAexGothic"
)- MIT license