The intent of Homefullness is to visualize the homeless population for a given year. Figures will exit a house and it will grow proportionally based on the population for that year.
- Vanilla JavaScript for overall structure and logic
- HTML5 Canvas for DOM manipulation and rendering
- D3.js and Chart.js for graph rendering
- Webpack to bundle and serve up the various scripts

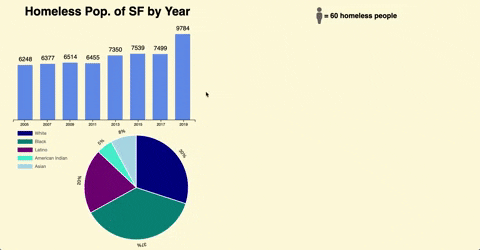
- Bar graph made with D3.js with a hover-over event on each bar that is tied to the data for that year
- Pie chart made with Chart.js that breaks done the percentages of the ethnicities of that year
- HTML5 Canvas renders moving figues and the house on the hover-over event
When implementing the Person class, the demographic breakdown of the pie chart has to match the rendered figues, how is this accomplished? In the Display class there is a series of "else if" statements that checked the total people rendered so far and constructed a Person object the the corresponding ethnicity property to meet the required quota.
addPerson() {
    if (this.white > this.i) {
      this.personArr.push(new Person(this.ctx, 'white', this.i));
    } else if (this.white + this.black > this.i) {
      this.personArr.push(new Person(this.ctx, 'black', this.i));
    } else if (this.white + this.black + this.latino > this.i) {
      this.personArr.push(new Person(this.ctx, 'latino', this.i));
    } else if (this.white + this.black + this.latino + this.americanIndian > this.i) {
      this.personArr.push(new Person(this.ctx, 'americanIndian', this.i));
    } else if (this.white + this.black + this.latino + this.americanIndian + this.asian > this.i) {
      this.personArr.push(new Person(this.ctx, 'asian', this.i));
    } else if (this.i < Math.floor(this.totalPop / 60)) {
      this.personArr.push(new Person(this.ctx, 'unknown', this.i));
    }
    this.i++;
  }

  export default class Person {
  constructor(ctx, ethnicity, n) {
    this.ctx = ctx;
    this.person = new Image();
    this.person.src = `./assets/images/person-${ethnicity}.png`;
    this.startY = CONSTANTS.startY;
    this.startX = CONSTANTS.startX;
    this.endX = 20 * (n % 12);
    this.endY = 40 * Math.floor(n / 12);
    this.animate = this.animate.bind(this);
}The intent of the project was to utilize javascript to its fullest and to be able to have a working product done in around 4 days. Much of that time was dedicated to understanding Canvas and D3.js.
The main challenge was learning D3.js and binding event listeners on the bar graph on hover to trigger the animations.
- Different statisitics besides ethnicity breakdown (mental health, veteren status...)
- Additional information like potential costs, along the sq ft required