Champion Affinity (live site)
- Running the Application
- Metrics
For Riot's API Challenge (2016), we decided to explore how the mastery data provided by the Riot API can model the relationships between champions. For example, if a summoner enjoys playing Garen, how does that predict whether they would enjoy playing Annie? This sort of data could be useful to find new champions to expand your champion pool with, or for designers, identify champions that don't have an obvious progression to another champion. While we expected other entries to the competition to focus on individual recommendations, we wanted to provide an overview of the entire community at once in an interesting way. We've generated a few metrics to explore this idea, using an initial population of Masters/Challenger players. You can read more about how each metric is calculated below (or on the site's about page).
This entry into the API challenge is in the Creativity/Originality category of the API contest. The prompt:
Creative and original ideas are always a breath of fresh air. Developers often build and iterate on successful ideas, but this category is meant to reward the individuals who aren’t afraid to challenge convention in pursuit of new and revolutionary ideas. Submissions in this category should focus on a new way to use (visualize, analyze, etc) champion mastery data. We are always looking for ways to encourage developers to think outside of the box.
Because we're approaching the analysis and visualization of champion master data in a new way (aggregate vs. individual summoner analysis), we felt our entry was most approprate in this category.
In this README, we'll go through:
- How to run the application on your own (in various forms).
- The overall structure of the GitHub repository.
- How the backend scripts work and the dependencies required to run them.
- How the visualizations work.
- How the site was built and the dependencies required to deploy it.
- How we will improve the metrics and design of the application.
Champion Affinity was designed and created by Chris (Ellipson (NA)) and Rob (T3lrec (NA)).
Chris designed the metrics, did the development work, and wrote most of the words you're reading here and on the site itself.
Rob acted as a sounding board for ideas (including many late nights in Discord/Hangouts), helped design the color scheme, wrote text content, and provided proofreading and feedback on the final application.
##Running the Application
Here's the step by step instructions for several use cases of the app. If you're confused about what some of these steps mean, refer farther down in the document. Otherwise, feel free to reach out to ask questions.
There's a minimal amount of dependencies to run this application. If you just want to see the final product, navigate to our site (listed at the top of this page and throughout our document). If you want to run the backend scripts yourself, Python 3.X is required. Git is highly recommended to pull the repository off GitHub. Finally, we recommend using pip for Python dependency installation.
####I just want to see the final product.
We have a live version of the app up at http://champion-affinity.getforge.io/.
####I want to deploy my own version (locally) with your dataset.
Dependencies: Python 3.X, git
- Grab the codebase using
git clone https://github.com/theisencr/lol-mastery-analysis.git - Navigate to the
webdirectory on a command line. - Run the following command:
python -m http.server 8000 - Navigate to
localhost:8000on your web browser of choice.
####I want to deploy my own version (remotely) with your dataset.
We recommend deploying the site to Forge, but any static site host will do. These instructions will be for Forge.
- Download
web.zipin the GitHub directory however you choose to do so. - Navigate to Forge and set up an account (if you don't have one already)
- Follow the instructions for setting up your own site: choose the "deploy from .zip" option
- Drag and drop (or select using a menu)
web.zip.
Your copy of Champion Affinity should be deployed at your chosen address.
####I want to generate a new dataset and deploy.
Dependency (required): Python 3.X, git
Clustering Dependencies (optional, if you want to try clustering): numpy, networkx, and our Python 3.X fork of python_mcl.
- Grab the codebase using
git clone https://github.com/theisencr/lol-mastery-analysis.git - Delete everything in
dataandweb/data. - Run the
data_backend scripts in the following order: data_import_champion_list.pydata_merge_mobafire_icon_api.pydata_import_top_players_master_challenger.py- Note: if you'd like to analyze a different set of players, generate your own list of summoner ID's in whatever way you choose, matching the format found in
player_id_list.csvin this GitHub repository. Put the result indata/player_id_list.csv.
- Note: if you'd like to analyze a different set of players, generate your own list of summoner ID's in whatever way you choose, matching the format found in
data_import_champion_mastery_data.pydata_import_create_affinity_table.py- (Optional) Run MCL to create the set of "meta" champions, and add them to
data/champion_list.csv. - Follow the instructions on the Python MCL page to install the package.
- Run MCL:
mcl_clustering.py -e 2 -i 1.6 affinity_table_normalized.csv- You can change the arguments as you see fit. These are the arguments used for the live site.
- Locate the largest cluster in the MCL results. Open
data/champion_list.csvin your favorite spreadsheet editor. - The cluster is listed in terms of
Graph_IDindata/champion_list.csv. For eachGraph_IDin your largest cluster, change the MCL field from1to2. - Run the
generate_backend scripts in the following order:generate_affinity_heatmap.pygenerate_centrality_charts.pygenerate_force_graph_file.pygenerate_radial.py
- Choose your deployment option from above. If you choose the remote deployment, compress the
webfolder to a zip file for uploading to Forge.
##Metrics
In this section, we'll discuss our metrics, how they're calculated, and how we would improve each one.
####Champion Affinity
Affinity (the namesake of our app) is the likelihood that having mastered (reached level 5 with) a champion predicts that you will have also played a different champion. As an example, if Garen has a 50% affinity with Annie but a 80% affinity with Lucian, that means that more Garen masters play Lucian than play Annie. If you like Garen, you should consider playing Lucian.
To calculate the Affinity metric, we developed the following algorithm, presented in pseudocode.
initialize champion_affinity
max_affinity = 0
for each champion in champion_list:
  for each summoner in summoner_list:
    if summoner.masteryLevel[champion] == 5:
      for champion_all in champion_list:
        champion_affinity[champion][champion_all] += summoner.masteryLevel(champion_all)

##make champion_affinity symmetrical along diagonal, then find max_affinity##
for x in xrange(0, length(champion_list)):
  for y in xrange(x, length(champion_list)):
    affinity_table[x][y] += affinity_table[y][x]
    affinity_table[y][x] = affinity_table[x][y]
    if max_affinity < champion_affinity[champion][champion_all]:
      max_affinity = champion_affinity[champion][champion_all]

normalize champion_affinity to 0-1 using max_affinity
Put another way: First, we initialize a matrix of size 130x130 (130 being the number of champions in League as of May 1st, 2016), with 0 in every position in the array. We then go through every champion, in alphabetical order. We'll use Aatrox as a running example. For Aatrox, we then look at all of our summoners in our dataset. If Huni has a mastery level of 5 with Aatrox, we then look at all of his other mastery levels, and add those level values to the "Aatrox" entry in the champion affinity table. for example, if Huni's Garen level is 3, we add 3 to the [Aatrox][Garen] entry in the matrix.
At the end of this process, we make the table bidirectional, or combine the results of [Aatrox][Garen] and [Garen][Aatrox] so they're the same. We do this by adding the two values together and putting the result back in these two positions. We're keeping track of a running max_affinity throughout this process, which is the maximum value in our matrix. At the end of our process, we normalize our matrix to 0-1 values by dividing each cell by max_affinity.
Each individual cell in our matrix then has our final affinity percentage value. You can see all of these values on the heatmap. This matrix (or table) is the basis for our other metrics.
#####Wait, why use levels instead of mastery score?
This was a design decision. We felt, after inspecting the data, that using raw mastery score would cause outliers (such as "One Trick Ponies" who also happened to hit level 5 with another champion) to have a disproportionate effect on the dataset. By using the level structure, we prevented this from happening. Future iterations could create artificial levels by doubling the amount of mastery data; if it takes 21600 cumulative points to hit 5, then 43200 could be 6 on our chart, et cetera.
#####Why make the final table bidirectional? Wouldn't a directed table be better?
We felt that an Aatrox player also playing Garen would obviously suggest that other Aatrox players should play Garen, but we were unsure how Garen players playing Aatrox should factor into that recommendation. We decided to weight the two equally, though some sort of "dampening" factor may be appropriate here. There was also a practical consideration: our clustering algorithm struggles with directed graphs.
#####Why normalize your results?
Normalizing our result allows us to present the relationships in terms of percentages instead of totals of levels. This means we can easily compare datasets of different sizes, which will be important as we improve on this idea. Percentages are easier to understand at a glance. Finally, normalized values are required for our clustering algorithm.
#####Why did you choose to normalize this way?
We went back and forth on two different ways of normalizing. One was our current approach: the max_affinity in the entire chart. The other option was to normalize by champion, or a max_affinity for each champion. However, this made it difficult to calculate our later metrics, and also resulted in weird swings of affinity for the sparser parts of the dataset. Yorick, for example, had either 100% or 0% in various fields, and it made it difficult to understand how this related to Lucian.
#####How would you improve champion affinity?
Having some sort of compromise between the two normalization methods would be the best immediate improvement. Right now, it's hard to get a good sense of the affinities of less popular champions. One quick idea; split the difference between the "total" max_affinity and a specific champion's max_affininty when normalizing each champion's row. Including a summoner's winrate in the algorithm as well might be an interesting way to highlight "masters" rather than using players who hit level 5; for example, if someone has a total win rate of 50% across all champions, but has hit level 5 with Garen and has a 60% winrate with him, we can be even more sure that person is good with Garen.
####Champion Centrality Centrality is another way to think about champion popularity; how often does a specific champion show up strongly in summoners' champion affinity arrays? If Lucian has higher affinity in sum across all champions than Annie, then we say that Lucian has higher champion centrality, and may be more important to the metagame for this data sample.
To calculate the Centrality metric, we developed the following algorithm:
import champion_affinity from above
initialize centrality array
for each champion in champion_affinity:
  centrality[champion] = 0
  for each champion_all in champion_list:
    #exclude champion's affinity to itself
    centrality[champion] += champion_affinity[champion][champion_all]
For each champion, we take the sum of all affinity values for the other 129 champions. For example, if we wanted the centrality measure for Aatrox, we would add up all of the affinity values for Aatrox to/from any other champion. The final theoretical values can range from 0-130; no normalization was required here, because we're displaying these values in a bar chart. More = better.
#####How would you improve champion centrality?
Right now this metric is very closely correlated with champion clustering. This is more of an artifact of how clustering didn't quite work out how we expected, but separating these two concepts more would be a good next step.
####Champion Clustering We wanted to see if we could predict, based on champion mastery data, which champions are part of the "meta" at the Challenger/Master level. To calculate the Clustering metric, we used Markov Clustering Algorithm (MCL). This algorithm helps you find "clusters" of nodes in graphs. We used this algorithm to identify what champions were considered "meta" by their interconnectivity. While this approach typically outputs a set of clusters of nodes, our dataset only produced one, which grew or shrank depending on how we "tuned" our parameters for MCL. Tuning your parameters when using machine learning algorithms is incredibly important.
Our original goal in using this clustering algorithm was to identify champions that were "like" one another. Unfortunately, no amount of tuning using random parameters or Differential Evolution to "improve" our result ever resulted in more than one distinct cluster of champions. We then realized that MCL was identifying the "center" of our graph, and our parameter tuning was simply growing or shrinking what was considered "center" and what wasn't. This could be the metagame at Challenger/Masters..? We chose to iterate over parameters until we identified the most centralized 20% of champions, highlighted those nodes as red on our force graph, and declared that to be the "learned" meta at the highest levels of play.
To implement this algorithm, we originally used koteth's Python implementation of MCL. However, this implementation was only working for Python 2.7.X. We forked the project in order to upgrade the formatting to Python 3.X, so our project would only use one version of Python.
#####How would you improve champion clustering?
We'd like to get back to what our original goal was for this metric: identifying distinct clusters of champions, rather than the centralized cluster that we grow or shrink. We need to explore additional algorithms to do this: Closeness Centrality is one option. In addition, converting to a directed graph and trying some directed graph clustering algorithms out should change our results significantly.
##GitHub Structure
In this section, we'll go over the structure of the files in our repository.
####Root
Root contains the following:
- The
READMEyou're reading now. - The python scripts that makeup the backend.
- Our verification text file.
- The deployable
web.zipfile of our public-facing app. - Notably missing: a file called
api_keythat contains a Riot API key. If you'd like to run this application, you'll need to make your own and place it at root.
####Data
This folder contains the files that support the creation and evaluation of our metrics. The files on GitHub represent mastery data from Masters/Challenger players and metric calculations from April 25th, 2016. These files can be regenerated using the backend scripts at any time, though some differences should be expected in the final results. We also can't guarantee that the scripts will work once the next champion is added (until we get around to making the backend handle champion additions seamlessly).
####Static_Data
This folder contains a single file, mobafire-icon-lookup.csv. This file provides some mappings that were generated manually:
Name -> Graph_IDfor mapping to nodes on our eventual visualizationsName -> Mobafire_NameandName -> Mobafire_IDfor generating links to each champion's Mobafire pageName -> Image_IDfor looking up each champion's icon. These mappings are referenced by our backend scripts for generating our data for our final public-facing site.
####Snips
Contains screenshots of our visualizations for documentation purposes.
####Tests
This folder, along with test_controller.py in the root directory, was used to test API calls and make sure the API requests were formatted properly. Originally, we planned on building a unit test for each individual API endpoint we were referencing, just to explore how the built-in unittest module in Python works. The need to ship something for the contest won out, however.
####Web
Web contains our stand-alone static website that displays our final metrics. You can see the latest version of our site at http://champion-affinity.getforge.io/. You can also deploy your own version out of the web directory.
##Backend
Now we'll go through the meat of our application; the backend Python scripts that pull data from the API, calculate our metrics, and create the .csv/.tsv/.json files that our visualizations rely on. We'll also discuss how we'd improve the backend in the short term and long term.
###Dependencies
All of our backend scripts are written in Python, using version 3.5.1. Any 3.X version should work.
The clustering algorithm we use (and forked to upgrade to Python 3.X), Markov Clustering Algorithm (MCL), requires the following:
###How it works
There are four "types" of scripts at root:
- data
- generate
- utility
- test
####"data_" scripts
The data scripts perform our API requests and calculates our champion affinity metric, dropping the results in the data folder. The scripts, in the order they are run:
data_import_champion_list.py- Imports the list of current champions and their ID's tochampion_list_api.csv.data_merge_mobafire_icon_api.py- Mergesdata/champion_list_api.csvandstatic_data/mobafire-icon-lookup.csvintodata/champion_list.csvfor later scripts. Sets a default "no meta champions" for a newMCLcolumn.data_import_top_players_master_challenger.py- Imports all current Masters and Challenger summoner ID's toplayer_id_list.csv.data_import_champion_mastery_data.py- Imports all Mastery Level data for all summoner ID's inplayer_id_list.csv, and outputs the result tolist_of_masteries.csv. File assumes the "personal" rate limit from the API spec; if you have a production API key, you can decrease the timeout in the file.data_import_create_affinity_table.py- Generates the normalized affinity table (the Champion Affinity) fromlist_of_masteries.csvand outputs the result toaffinity_table_normalized.csv. We'll discuss how the affinity metric was generated in a later section.
####"generate_" scripts
The generate scripts transform our affinity_table_normalized.csv and champion_list.csv into the champion centrality metric, along with readable formats for our visualization tools in our webkit. The results of these scripts are dropped into the web/data folder, which our visualizations access on our site. The scripts can be run in any order:
generate_affinity_heatmap.py- Generatesweb/data/heatmap_champs.tsvfromdata/affinity_table_normalized.csv, which the heatmap container uses.generate_centrality_charts.py- Generatesweb/data/data_chart_champions.tsvandweb/data/data_chart_champions_second.tsvfromdata/affinity_table_normalized.csvanddata/champion_list.csv, which the chart container uses.generate_force_graph_file.py- Generatesweb/data/champion_edge_force_graph.jsonfromdata/affinity_table_normalized.csvanddata/champion_list.csv, which the force graph container uses.generate_radial.py- Generatesweb/data/champion_edge_bundling.jsonfromdata/affinity_table_normalized.csvanddata/champion_list.csv, which the radial container uses.
####"utility_" scripts
The utility_ series of scripts are for helpers; generating one-time datasets and the like. This isn't part of the current workflow.
utility_champion_list_heatmap.py- Generates a comma-delimited list of champions. Used by the heatmap visualization to set up the axes of the chart.
####"test_" scripts
The test_ series of scripts are for running API tests. As mentioned before, we initially meant to have a nice unit test suite for exploring the API... ran out of time. Sad day.
test_controller.py- Basic console control to access the "unit tests" in thetestsfolder.
###Future Improvements - Backend
In the short term: Right now the app is hard-coded for 130 champions. As soon as a new champion releases, Bad Things will happen. This is embarrassing, but the app will be updated to be compatible with the new champ (and future champs) as soon as we can.
Our naming scheme organization isn't ideal; moving each of the classes of scripts into their own folders and improving the naming of each file is the next thing to do. We could then generate a Python setup script that would run the entire supply chain and deliver the data files to the web deployment folder.
Long term: We'd like to set up a database for storing our datasets. Classifying summoner_ID's by league alongside their mastery data and sucking in as much data as possible to a PostgreSQL or NoSQL database would allow us to analyze our metrics across multiple leagues and see how affinity links and the meta distribution changes as you move up and down the ladder. What's true for Challenger/Master may not be true in Silver (we're guessing they'll be very different). Running the backend on a dedicated server and delivering regular updates to the frontend would make a cool live site. We originally planned to set up a database for this project, but .csv's were easier for us to use for rapid experimentation, and we ran out of time to implement the more elegant solution.
##Visualizations
All of our visualizations were built using D3.js. This was chosen because of the ease of implementation and its compatibility with mobile platforms; we wanted the site to be as accessible as possible. The visualization browsing site bl.ocks.org was a huge inspiration for us when looking for new ways to present data.
####Heatmap
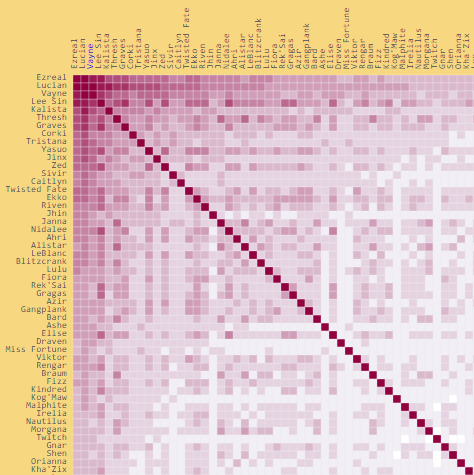
Heatmaps are a visually interesting way to present tables of data that have a unified range across them. Being able to sort on each axis was important for us, as we wanted users to be able to focus on a specific champion without downloading a file to open in a spreadsheet editor. We heavily modified Ian YF Chang's heatmap example to accomplish this.
####Centrality Bar Charts
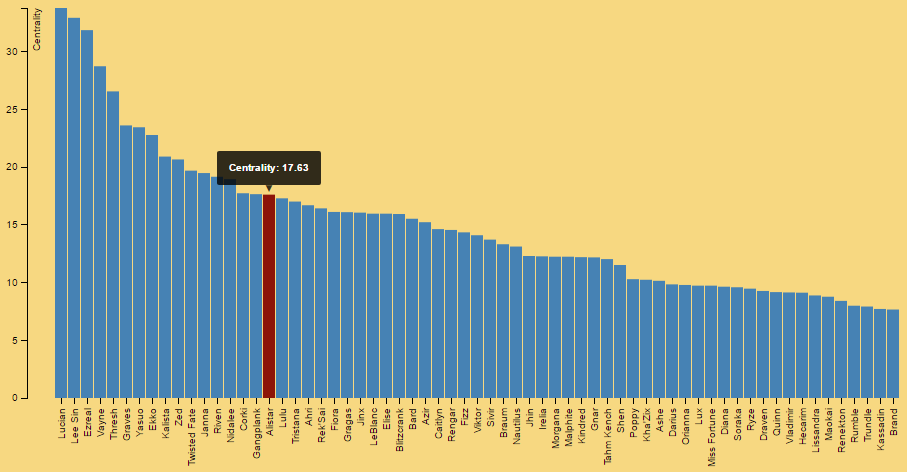
Because the centrality metric was a simple "more is better" sum of affinities, we figured a bar chart would be fine for this. Highlighting a column and getting the exact figure was a nice bonus. We modified Mike Bostock's Bar Chart for this one.
####Force Graph
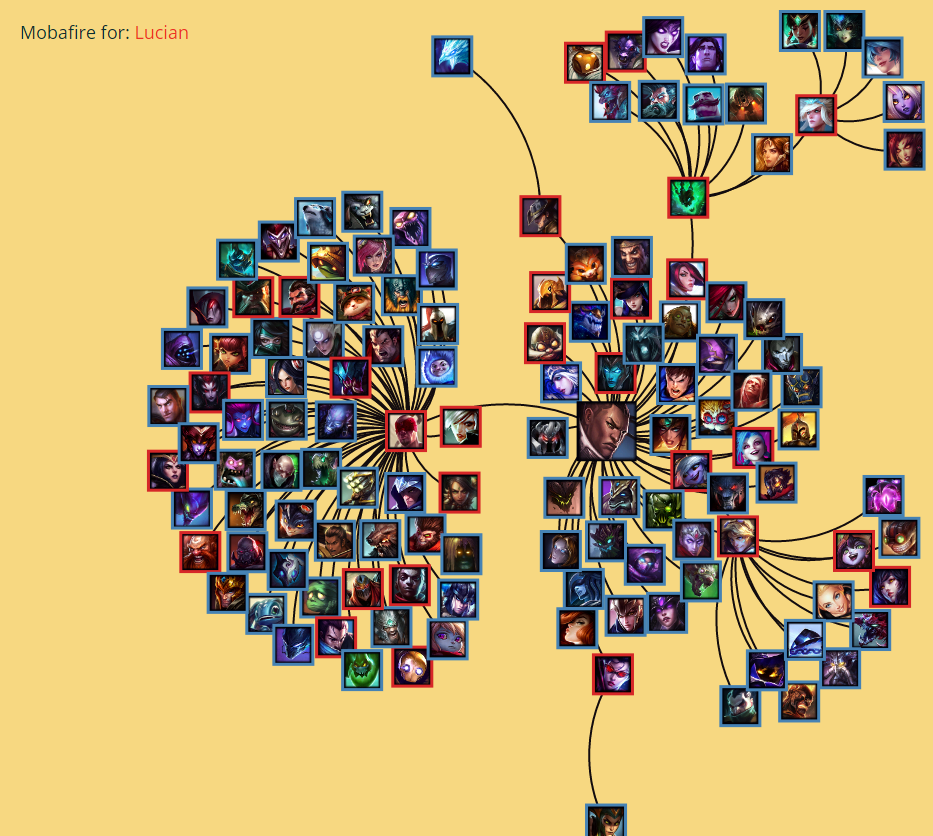
This visualization was inspired by Sundar's Force Layout Graph. We loved how we could drag nodes around the space to explore it, and the extra link popping up was nice; tying it to a champion's Mobafire page was an obvious progression to us.
####Radial (Edge Bundling) Chart
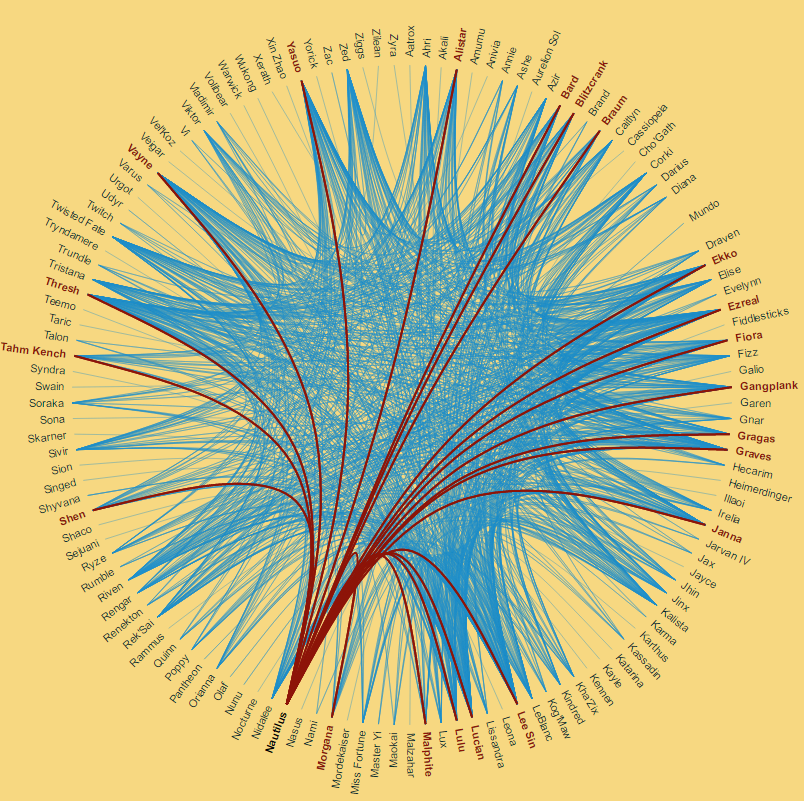
So pretty! Edge bundling/radial charts are gorgeous to look at and provides a pretty cool spin on showing how champions relate to one another. We built our version off of Mike Bostock's Hierarchical Edge Bundling
####Giving Back/Next Steps
After we finalize our contest submission, we're planning on submitting all four of our modified visualizations back to bl.ocks.org so that future users of the site can build off of us, as well. Many of the visualizations we chose to build off of were themselves built from someone else's work, and continuing this cycle of improvement is important to us.
##Site Design
First, let's set up the goals for the site:
- It should present data in an interesting and informative way
- It should work on as many platforms as possible (including mobile!)
- It should load quickly and use as little bandwidth as possible
- It should be easy for others to deploy themselves (replication!)
With these goals in mind, we made two major design decisions. One, we decided to create static content to build our data visualizations on. Future iterations of the site will also precalculate different leagues on a regular schedule (think champion.gg style preprocessing). Second, we're using Bootstrap as the primary driver of our site, as it satisfies our need for a lightweight HTML/Javascript based static site. Bootstrap also has excellent mobile support; our visualizations cause some table breaking, and the pseudocode has some wordwrap issues on the About page, but the site is fully functional on your mobile device.
Each visualization is stuck into a separate .html container for display on each page. This way, the page loads up nearly instantly even if the visualization takes a bit of time to calculate and display.
We're using Forge as our hosting platform. Forge makes it really easy to publish static content sites, and has a generous free tier for those who would like to replicate our project.
The color scheme is pretty basic. We didn't want a visually noisy site that would be hard to parse and understand on smaller screens. Additionally, one of our demo testers pointed out that an early background (a character splash screen) was making it hard for him to read the charts and graphs because of his color blindness. We didn't want a simple white background (hard on the eyes), but we needed something that would provide the same contrast as white for our visualizations. The brass/manilla color worked great for this; it's f.lux-like. We've specifically chosen our colors to be compatible with the types of color blindness provided by NIH. While blue-yellow color blindness looks like it might be an issue, the percieved colors still allow for contrast on our site.
####Site Improvements
We have some pretty serious table breaking going on for smaller resolutions and mobile platforms. It doesn't cause functionality issues, as you can simply scroll and zoom to make the visualizations fit on the screen, but it is a concern. Allowing the visualizations to grow and shrink depending on the browser/resolution/etc. instead of fixed widths is the next logical step.
A more visually interesting background and color scheme is a possibility; while we designed with accessibility in mind, having a "color-blind" version of the site might be one way to do more visually interesting components.
##FAQ
####Why'd you fork that MCL library?
We were originally going to write up instructions on how to run both Python 2.7 and 3.5 on the same machine for replicating the backend, but decided we could give upgrading it to 3.5 ourselves a try! It turned out to be really straightforward. Hopefully others will find the upgrade useful as well!
##Legal
Champion Affinity isn't endorsed by Riot Games and doesn't reflect the views or opinions of Riot Games or anyone officially involved in producing or managing League of Legends. League of Legends and Riot Games are trademarks or registered trademarks of Riot Games, Inc. League of Legends © Riot Games, Inc.