After thinking about different methods, we stopped on using a small neural network that will predict the sales using weekday and week number. We used the pyTorch module to build, train and use the neural network. After testing it in the Google Colab notebook (Datathon21.ipynb), the neural network was written into standalone, reusable files:
- main.py trains the models for all buckets and shops
- test.py prints the mean absolute error using the test data, that is not used in training
- predict.py generates the predictions.csv file with all of the predictions
- enhance.py - optional file for additional training (turned out to have no use in our models)
Everything in this section was made in our Google Colab Notebook
We started our exploratory data analysis from dividing the data into different categories. We picked the store with the store number 1000(first_store). Then, we started building visualizations of the data for the first_store. We have built a simple line graph of the relationship between day and quantity sold for different buckets.
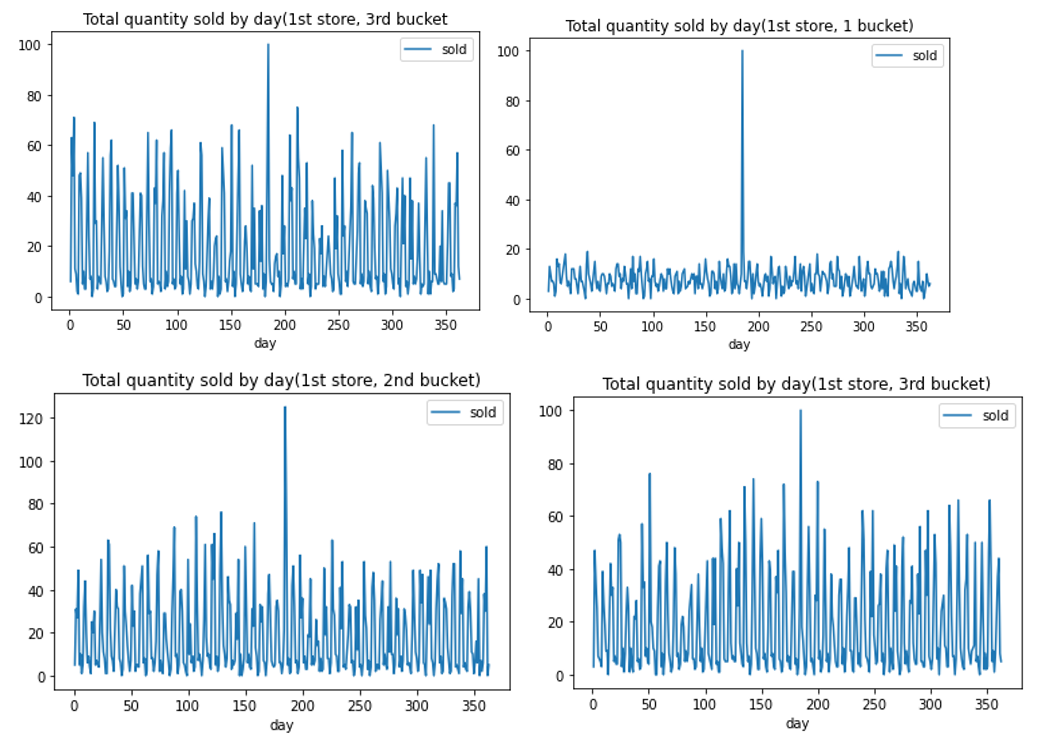
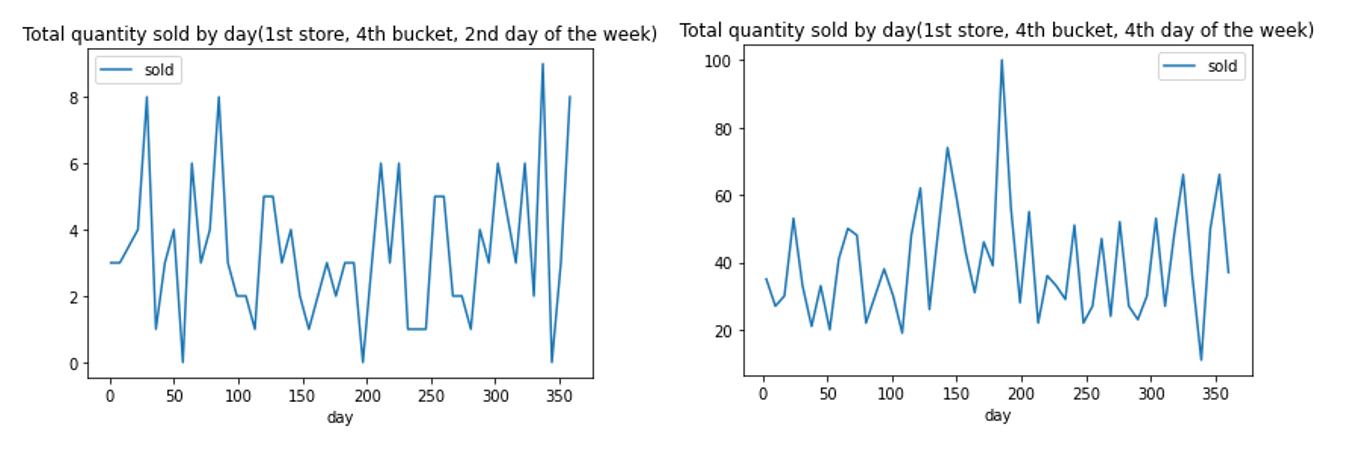
This gave us an idea of the periodic spikes in the quantity sold. The spikes hinted us to divide the days into days of the week. Then, we made a few more line plots for the same day of the week during different weeks. These lines plots were steadier(had less variability).
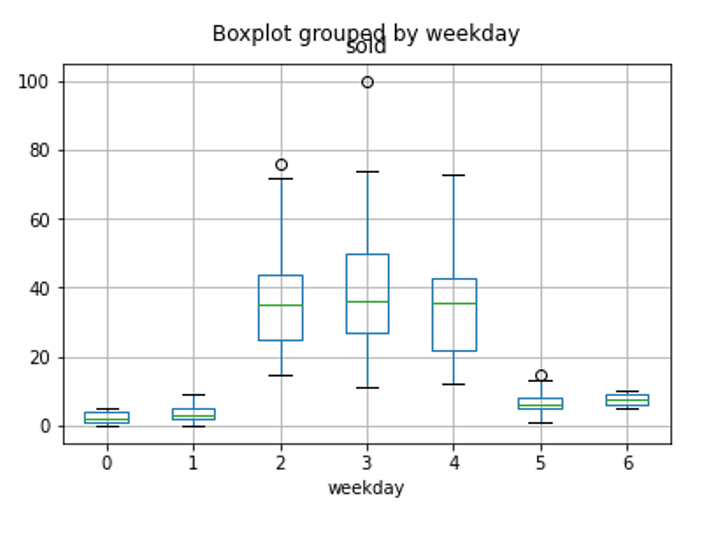
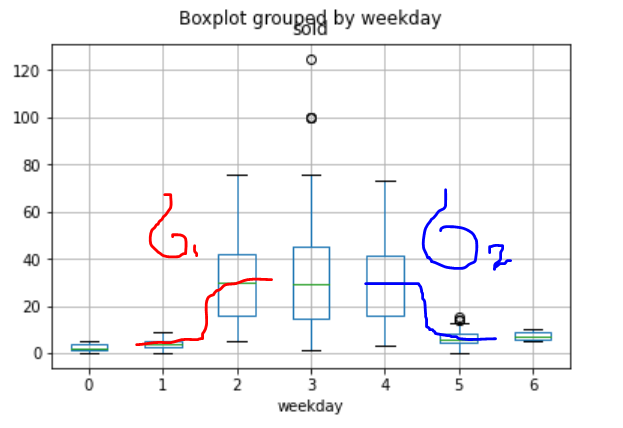
Then we built a box plot which confirmed that for the first_store and the 4th bucket, there were more hot dogs sold on 3 of the weekdays than on the other weekdays. Therefore, our idea about difference in sales on different days of the week was correct.
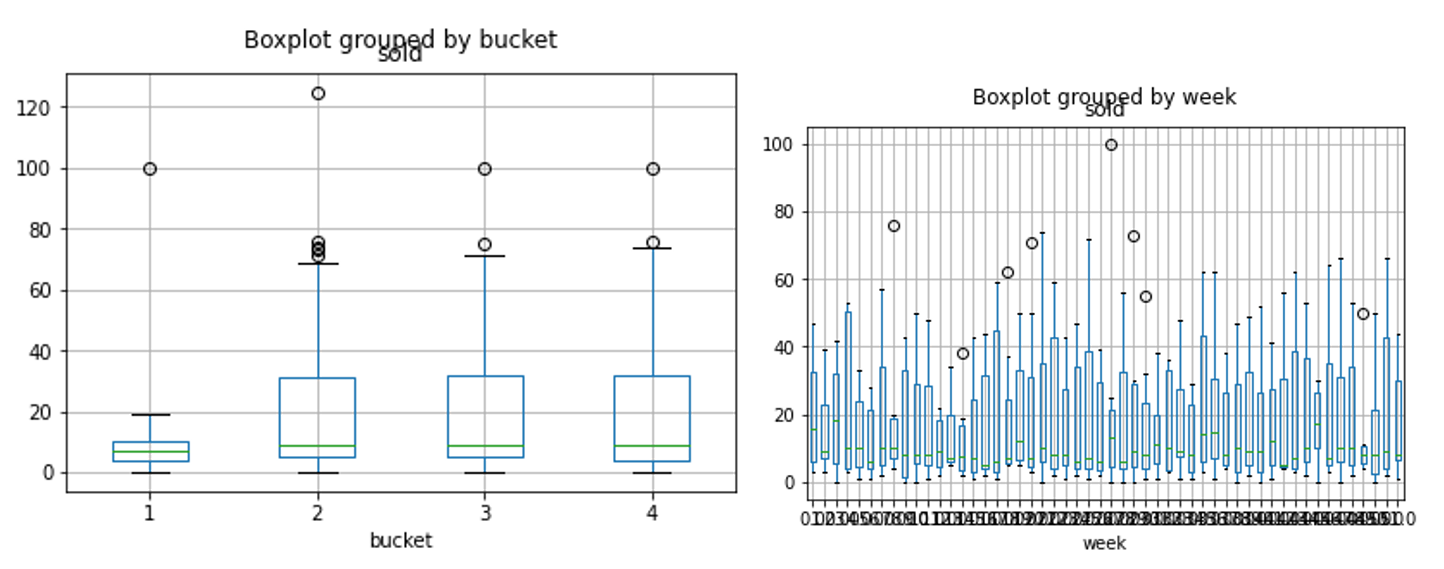
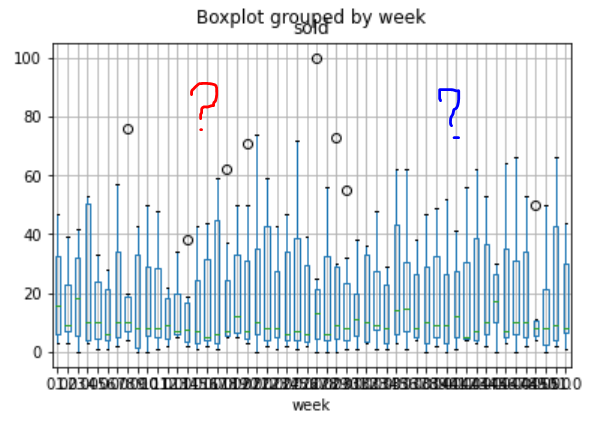
In addition to dividing the data into relative days of the week, we divided the data into different weeks. We plotted that data as box plots, and we found some volatility there as well. Then, we plotted the sales by bucket, and we found that for the first_store, there was by far more sales in the last 3 buckets at the first_store.
Finally, we decided to design different model for each of the buckets(4) for each of the stores(4). As a result, we would get 16 models in total. Each model has weekday and week as its independent variable and quantity sold as the dependent variable.
For the weekday variable, two neurons with sigmoid activation functions are enough to provide its most important feature. The weekday has a plateau on days 2-4 and stays low at all the other days. Therefore, two neurons represent two sigmoid function - one for “climbing up” the plateau, and one for “climbing down” of it.
The “week number” variable is far more complicated and stochastic. We decided to add one more neuron in the first layer to not lose any data about the week number, but added a second layer of three more neurons to reflect the changing behavior of this variable. It was also later established through tuning that increasing the number of neurons in the second layer doesn’t increase the accuracy.
We used the Adam optimizer because it requires minimal tuning and performs well on different data, which is crucial in our time constraints. After tuning the learning rate for one of the buckets in google colab, we finally came to an optimal parameter of 0.01.
After all of the macro parameters were chosen, we have written a python script (main.py) that trains and saves models for all stores and buckets. The neural network weights were generated via optimization by batches of size 20 for 6000 iterations. Further training (enhance.py) has demonstrated no principal increase in accuracy. To be able to use these weights later, we stored them in special files (such as s1000b1, named after their store and bucket numbers). After that, we've made a testing code (test.py) for error calculation for the sake of convenience, and the final predicting code (predict.py) that used data from the given scoring.csv file.