Possible memory leak when using LocalCluster #5960
Comments
|
Noting that this discussion from the Dask discourse seems quite similar-- when using a local cluster, they also noticed memory usage on the client continuing to increase over time. |
The fact that memory growth is so different when you switch When In both cases, memory seems to grow with each repeated computation, but when It makes me think that something is keeping references to (serialized?) tasks alive even after they're complete, either on the scheduler or client. |
|
Using the modified example script in the discourse, starting a separate scheduler, and one explicit worker, I don't see any meaningful/consistent memory usage in the main process. Scriptimport sys, os
import psutil
import numpy as np
from dask.distributed import Client, LocalCluster
import random
from time import sleep
import ctypes
import gc
def current_memory():
process = psutil.Process(os.getpid())
mem = process.memory_info().rss / (1024 * 1024) # MB
return mem
def get_patch(index, dt):
return None
if __name__ == "__main__":
#cluster = LocalCluster(n_workers=8, threads_per_worker=1, memory_limit='5GB')
#client = Client(cluster)
client = Client("tcp://192.168.86.42:8786")
dts = list(range(23 * 11))
initial_mem = curr_mem = current_memory()
print(f"Initial memory: {curr_mem}")
curr_mem = current_memory()
counter = 0
num_patches = 210
for dt in dts:
prev_mem = curr_mem
curr_mem = current_memory()
print(f"| Count: {counter:>03d} | Current memory usage: {current_memory():>0.05f} | Memory delta: {curr_mem - prev_mem:>0.05f} |")
patch_res = client.map(get_patch, [dt + x for x in range(num_patches)], dt=dt)
final_res = client.gather(patch_res)
print(f'number of client references {len(client.futures)}')
counter += 1
if counter % 10 == 0:
gc.collect()Separate scheduler - 1 workerScript-created LocalClusterAll try the log options next. Edit: I should also note that monitoring the scheduler process while running shows that it is growing in memory usage, the workers aren't, and even after the client is closed and the script ended the scheduler still kept that memory. |
|
@gjoseph92 I updated my distributed:
scheduler:
events-log-length: 0
admin:
log-length: 0
diagnostics:
computations:
max-history: 0and used the in-script LocalCluster, but I still saw the same memory usage. Does that YAML look correct? I think I'm done for the night but will try some more things this weekend. |
|
Thanks @djhoese for doing that follow-up. @gjoseph92 I did not pursue the logging angle as @djhoese seemed to be looking into it. I would be incredibly surprised if logging could explain the growth in the I also tried printing I believe that it is the workers that are accumulating the memory. To check, I started the cluster in a separate Edit: I also put |
|
Interesting @JSKenyon. I found the opposite behavior. With my test script I see major memory increases in the scheduler, but only small increases in the workers. Now that I think about it though, I'm not if that was proportional to the number of workers or maybe even a sum of the increases in each worker (leak_size_in_scheduler = num_workers * leak_size_in_workers). I'll see if I have time for some tests today. |
|
Here are the results of running my script (once with a LocalCluster, once with an external scheduler), the scheduler, and 4 workers with Script (LocalCluster):
Script (External Scheduler):
Scheduler: NOTE: The script using this scheduler was started near the end of the plot.
Workers 1 (other 3 are the same):
|


|
@djhoese I suspect that our reproducers are probing slightly different behaviours. Using your reproducer, I can also see growth in the scheduler process. However, in my example I am relatively convinced that it is the workers which hold on to the majority of the memory (perhaps you could run it and confirm?). I have modified your reproducer to the following: from dask.distributed import Client, LocalCluster
import dask
def f(x):
return None
if __name__ == "__main__":
dask.config.set(
{
"distributed.scheduler.events-log-length": 0,
"distributed.admin.log-length": 0,
"distributed.diagnostics.computations.max-history": 0
}
)
cluster = LocalCluster(
n_workers=4,
threads_per_worker=1,
)
client = Client(cluster)
for dt in range(10000):
client.gather(client.map(f, [x for x in range(100)]))This takes a little while to run, but you can use the dashboard to watch the worker memory slowly grow over time. That is not to say that there isn't growth in the scheduler process. Is it possible that something in the scheduler is also causing objects to remain live on the workers? That might explain both types of growth. My original reproducer happens to emphasise the worker behaviour as a result of using Running the reproducer in this comment, I get the following output from This is particularly interesting. The black line is the parent/scheduler process in this case (which does not include the memory of children). The coloured lines (excluding blue) are the four worker processes. I think that this clearly demonstrates that both the workers and the scheduler are leaking (or certainly growing) memory. @djhoese @gjoseph92 thoughts? Edit: Changed the profiling plot - attaching to the dashboard had muddied the results. |

|
Yep, same results.
I also ran it with a separate scheduler and single worker process. Watching the dashboard I noticed under the Workers tab that all the leaked memory is considered "unmanaged old":
At least for me the scheduler is blowing up way more:
Worker increases, but not like the scheduler:
But I also just noticed I'm running 2021.12.0 of dask and distributed. I'll try updating and rerunning this. Edit: Reran with 2022.3.0 and got similar results. |


|
So I tried one more thing. I updated your script @JSKenyon to only do 10 iterations, but with a 60 second sleep after each. Here's what resulted: Separate Scheduler:
Worker:
At the end of the script I counted to 60 then killed the worker. I then counted to 30 before killing the scheduler. The jump in memory just after the 600s mark on the scheduler plot seems to coincide with the worker being killed (Ctrl+C). I also note that it seems memory slowly increases over time for both the scheduler and the worker even when the scheduler and worker aren't doing anything. Maybe there is some heartbeat-style logging somewhere? The memory definitely increases each time a set of tasks are given, but still small increases overtime when idle. |


|
Interesting results @djhoese. I can reproduce on my end. I will try fiddling with config to see if I can change the rate of growth. That might give us a clue. I am still most concerned by the original reproducer though. This slow growth over time is a problem, but I really want to know if it has the same root cause as the explosive growth when using |
@JSKenyon can you see what happens with pyobjgraph? eg what do show? |
|
@graingert I should emphasise that at this point my hypothesis is just that - I have been struggling to test it. It may be that the cause is something else (I shouldn't have made such a definite statement). Thanks for those commands though - I will give it a go! |
|
We have a bunch of internal logs that are not externally visible for configuration, e.g. transfer_logs depending on how dense your graph is (i.e. how many dependencies are fetched, the total size may vary) distributed/distributed/worker.py Lines 566 to 568 in 5c7d555 In [1]: from distributed.utils import time
In [2]: from dask.sizeof import sizeof
In [3]: def estimate_size_of_transfer_log(nkeys=10):
...: # use time() to proxy any float
...: transfer_log = {
...: "start": time(),
...: "stop": time(),
...: "middle": time(),
...: "duration": time(),
...: "who": "tcp://134.0.0.1",
# this keys / nbytes is "unbound" and scales with the number of dependencies of a fetch
...: "keys": {f"key{ix}": time() for ix in range(nkeys)},
...: "total": time(),
...: "compressed": time(),
...: "bandwidth": time(),
...: }
...: return sizeof(transfer_log) * 100000
# 10 keys per call get_data request, on average. Result in MB
In [4]: estimate_size_of_transfer_log(nkeys=10) / 1024**2
Out[4]: 240.42129516601562
# 32 is a common branching factor, i.e. it's not unreasonable to have many tasks with this many dependencies. It should be very rarely happening
In [17]: estimate_size_of_transfer_log(nkeys=32) / 1024**2
Out[17]: 515.1748657226562Then there is the transition log on worker side, see here that will be another 50-100MB. This is currently not controlled by I would expect there to be a few hundred MB per worker. What I can see in #5960 (comment) aligns with my expectations If it's "just" the logging and nothing else, we can easily add in more config options or adjust current default values. This is not ideal, of course, but it should saturate eventually. All of our logs are bounded but there is some variation in it. There are ideas around like #5570 to give users a better control over this but this is still in ideation stage. |
|
Things like #5989 will help on scheduler side. There are also a bunch of things on the scheduler that accumulate data but the intention is to only log small things such that it doesn't affect anybody. Just in case this comes across the wrong way, this is somewhat expected but not intended behaviour. We have to fix this. |
|
To get a measurement on the workers, one can use a script like (use at your own disk) from dask.sizeof import sizeof
def get_sizeof(dask_worker):
res = {}
for key in dask_worker.__dict__:
try:
val = dask_worker.__dict__[key]
# There may be other types not properly sized by dask.sizeof
if isinstance(val, deque):
val = list(val)
_size = sizeof(val) / 1024 ** 2
# only return stuff that has at least an MB
if _size > 1:
res[key] = _size
except Exception:
pass
return res
client.run(get_sizeof) |
|
@fjetter Thanks for the input! I will definitely take a look at those logs. Do you think the behaviour in the original report (#5960 (comment)) could be explained by the logging? |
|
One thing I forgot, the bokeh backend also logs stuff to build the timeline, e.g. task stream. This all should be relatively small but if there are many small components, this obviously adds up to something. This only pops up on the scheduler.
Hard to say, without more measurements. It's not impossible.
What is concerning in your original report is that you are accumulating ~4GB of additional data over time with just four workers. That's 1GB per worker and they do not appear to be saturated. Your plots are a bit hard to read since one cannot distinguish the child processes properly. I assume all workers are following the same line? If so, the logging hypothesis is a strong candidate. |
|
Indeed, all four children in the first plot are on top of one another. I should have stressed that. What I find strange is that it is the |
Not that I am aware of. Logging and storing task results would've caused much more severe regressions |
|
I have been attempting to track this down but I am still having limited success. Here is a modified version of my original reproducer: import numpy as np
import dask.array as da
from dask.distributed import Client, LocalCluster
def f(x):
return np.empty_like(x)
def wrapper(x, n_elem_per_chunk):
if not isinstance(x, da.Array):
x = da.from_array(x, chunks=(n_elem_per_chunk))
return da.blockwise(f, ('x'), x, ('x'))
if __name__=='__main__':
cluster = LocalCluster(
processes=True,
n_workers=1,
threads_per_worker=1
)
client = Client(cluster)
n_elem_per_chunk = 13107200 # 100MiB of float64 data.
n_chunk = 1
for i in range(100):
x = np.random.randn(n_elem_per_chunk*n_chunk)
result = wrapper(x, n_elem_per_chunk)
result.compute()I have deliberately set this up so that each chunk is exactly 100MiB in size. This is because The following is a plot generated using I am really struggling to track this down further. I have tried both Edit: I should note that I did try purging the worker and scheduler logs between iterations but it made no difference. I should also stress that @djhoese's case may be entirely different. |

|
I have finally made a little progress - this is actually a relatively recent regression. Below is a plot produced with the |


|
I think #5653 is the culprit. The following example demonstrates that import numpy as np
import dask.array as da
import dask
from dask.distributed import Client, LocalCluster
from pympler import asizeof
def f(x):
return np.empty_like(x)
def wrapper(x, n_elem_per_chunk):
if not isinstance(x, da.Array):
x = da.from_array(x, chunks=(n_elem_per_chunk))
return da.blockwise(f, ('x'), x, ('x'))
def check_growth(dask_worker):
for uth in dask_worker.pending_data_per_worker.values():
uth_size = asizeof.asizeof(uth) / 1024 ** 2
print(f"Size of UniqueTaskHeap: {uth_size:.2f} MiB.")
if __name__ == '__main__':
cluster = LocalCluster(
processes=True,
n_workers=1,
threads_per_worker=1
)
client = Client(cluster)
n_elem_per_chunk = 13107200 # 100MiB of float64.
n_chunk = 1
for i in range(10):
x = np.random.randn(n_elem_per_chunk*n_chunk)
result = wrapper(x, n_elem_per_chunk)
dask.compute(result)
client.run(check_growth) |
|
If However, I am a bit confused about seeing pending_data_per_worker to be populated in the first place since I expected your graph to be embarrassingly parallel, isn't it? |
|
In the last example I have reduced it to a single chunk per compute call. I do not dispute that there will be a 100MiB array serialised into the graph - that is absolutely expected when using |
Why does pending data have so much in it?? xref dask#5960 (comment)
|
@fjetter I (think) I have isolated the growth to a single function. Specifically, distributed/distributed/worker.py Lines 3073 to 3093 in e8c0669 When invoked from handle_compute_task, this causes new entries to be added to self.pending_data_per_worker. These entries are never (to the best of my knowledge) removed. This is at odds with the behaviour in 2022.01.1, at which point pending_data_per_worker would not have been updated for my example. Specifically, the following (this is the code from 2022.01.1):distributed/distributed/worker.py Lines 3148 to 3156 in ccc6293 would not have been triggered. I cannot offer a solution - I am not familiar enough with the worker internals. That said, hopefully this is enough information to make a fix easy. Edit: Changed link to point to this repo rather than a fork. |
|
Thanks for tracking this down @JSKenyon ! This indeed doesn't look right. I remember iterating on this piece of code a few times. It was very frequently connected to all sorts of deadlocks. I'll try to squeeze out a bit of time to look into a fix. It should likely be something similar to the |
|
Awesome job @JSKenyon! I was on vacation for a week and just got back. Looks like you got a lot of work done. I agree that what you and I are looking at are probably different things and mine may be linked to some amount of logging somewhere. However, the issues you're finding here are likely (I hope) the causes of the original problem I was running into when helping someone I'm working with. They were seeing memory blow ups and when I trimmed down the script I kept seeing memory increasing so I just kept trimming the script down to the near-nothing script I mentioned above. I will double check versions used in various places and see where your reproducer aligns with my real world case. |
|
Any news on this? Could there be a kind of workaround in the meantime? |
|
I am not sure @zklaus. The "simple" short term solution is to go back to using the |
|
Thanks, @JSKenyon. I didn't realize that going back to 2022.01.1 is a temporary fix. Would be great to see this resolved more permanently. |
|
There are currently two PRs (one will be merged) re-working some of the update_who_has flaws, see These PRs should address ever increasing who_has/has_what sets. There might be still an issue about I suggest to rerun the reproducers in here once either of the above PRs are merged |
|
I ran the reproducer posted in #5960 (comment) again after merging #6342 The initial increase is understandable given that we're logging transitions, etc. by default but it does not grow out of bound and every process stays at about ~200MB.
There are probably still a few sources out there that contribute to some increase in memory but it looks like the worst is over. I'd love for somebody else to confirm if the issue improved |

What happened:
Memory usage of code using
da.from_arrayandcomputein a for loop grows over time when using aLocalCluster.What you expected to happen:
Memory usage should be approximately stable (subject to the GC).
Minimal Complete Verifiable Example:
Anything else we need to know?:
The output of
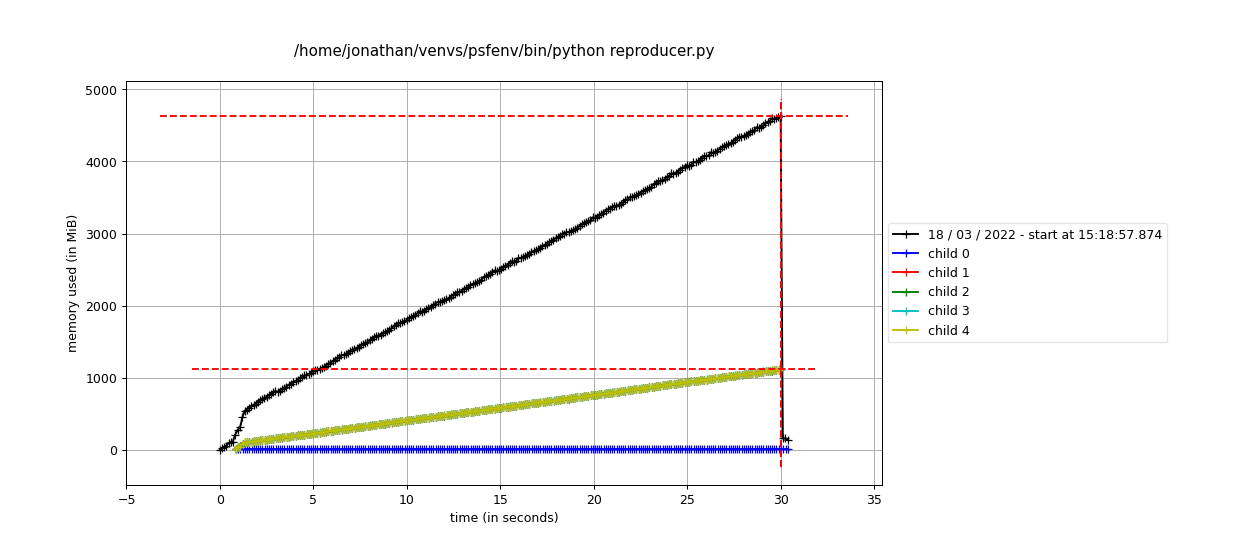
mprof run --multiprocess --include-children reproducer.pyvisualised bymprof plotusing aLocalCluster:The output of
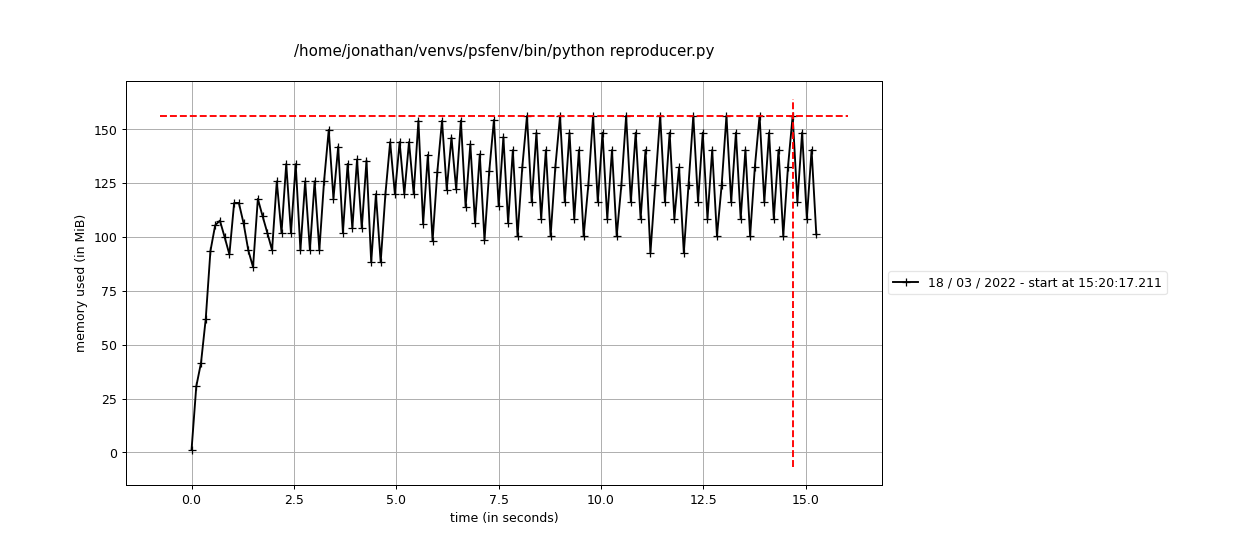
mprof run --multiprocess --include-children reproducer.pyvisualised bymprof plotusing thethreadsscheduler:The output of
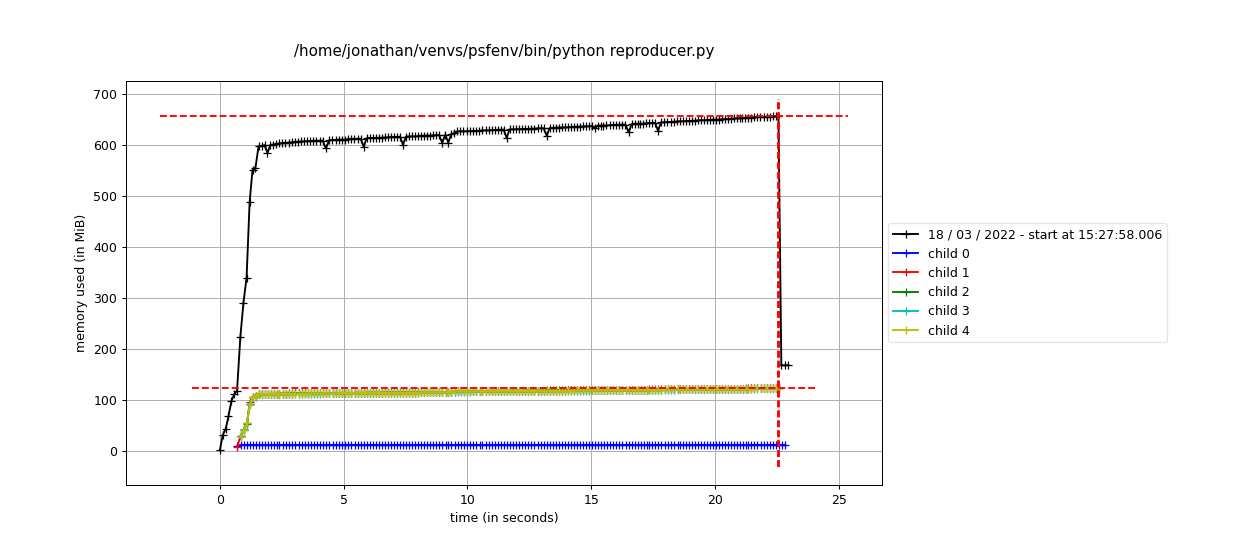
mprof run --multiprocess --include-children reproducer.pyvisualised bymprof plotusing aLocalClusterbut instantiatingxasda.random.standard_normal((nx, ny, nz), chunks=(1, -1, -1)):Note that child 0 should be ignored in the
LocalClusterplots as it is an artifact of the profiling procedure. Memory usage is in fact still climbing in the last plot, but it is much slower than in the first case (usingda.from_array). My current best guess is that either theClientor theClusteris somehow maintaining a reference to an object which should otherwise have been GCed.Environment:
The text was updated successfully, but these errors were encountered: