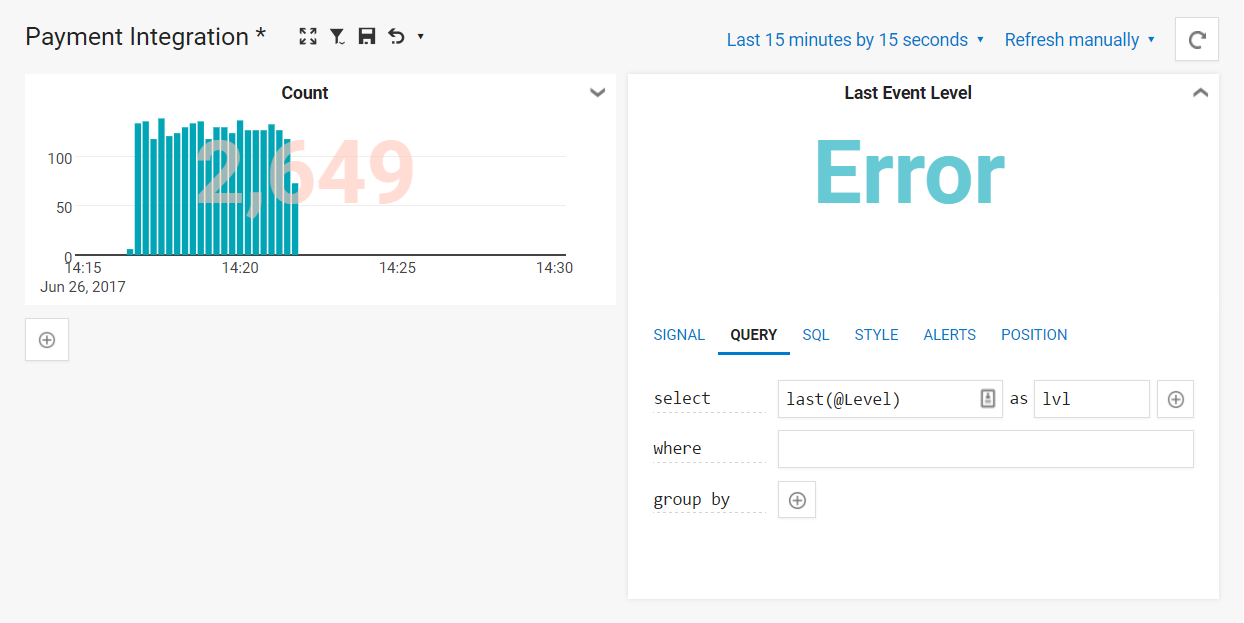
Single-valued charts #591
Comments
|
This is coming along; it's a slightly more complex feature than it first appears to be ;-) Because queries can be expensive, and the dashboard updates frequently, single-valued charts like the one above need to use time-slice caching in order to consume a reasonable amount of resources. Behind the scenes, a new query hint In 4.1, this will only be used by the dashboard, but a future version might enable this transparently for some queries since the performance difference is substantial. Remaining work:
Once this is done, we'll also have a strong foundation to efficiently build rowset-value charts, pie charts and so-on. |
|
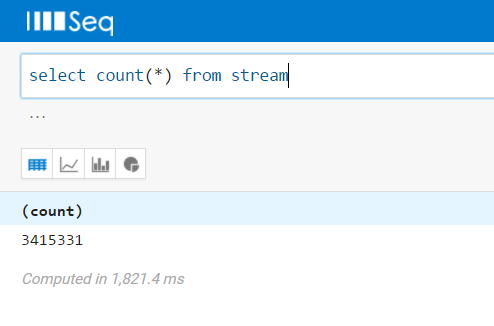
Done! The Bare query (debug build):
First run with time slice caching enabled, as used for single-valued charts on the dashboard (slight slow-down):
Subsequent run - 650× faster than the bare query:
|


Show one value computed over the whole dashboard range - this might not necessarily be numeric, so that things like circuit breaker status (text) can be shown.
The text was updated successfully, but these errors were encountered: