You want to put your data on a searchable, filterable map. This is a free, open source template using CARTO to help you do it. This template is a successor to Derek Eder's Fusion Tables Map Template.
If you don't have or want a CARTO account, check out Searchable Map Template - Turf.
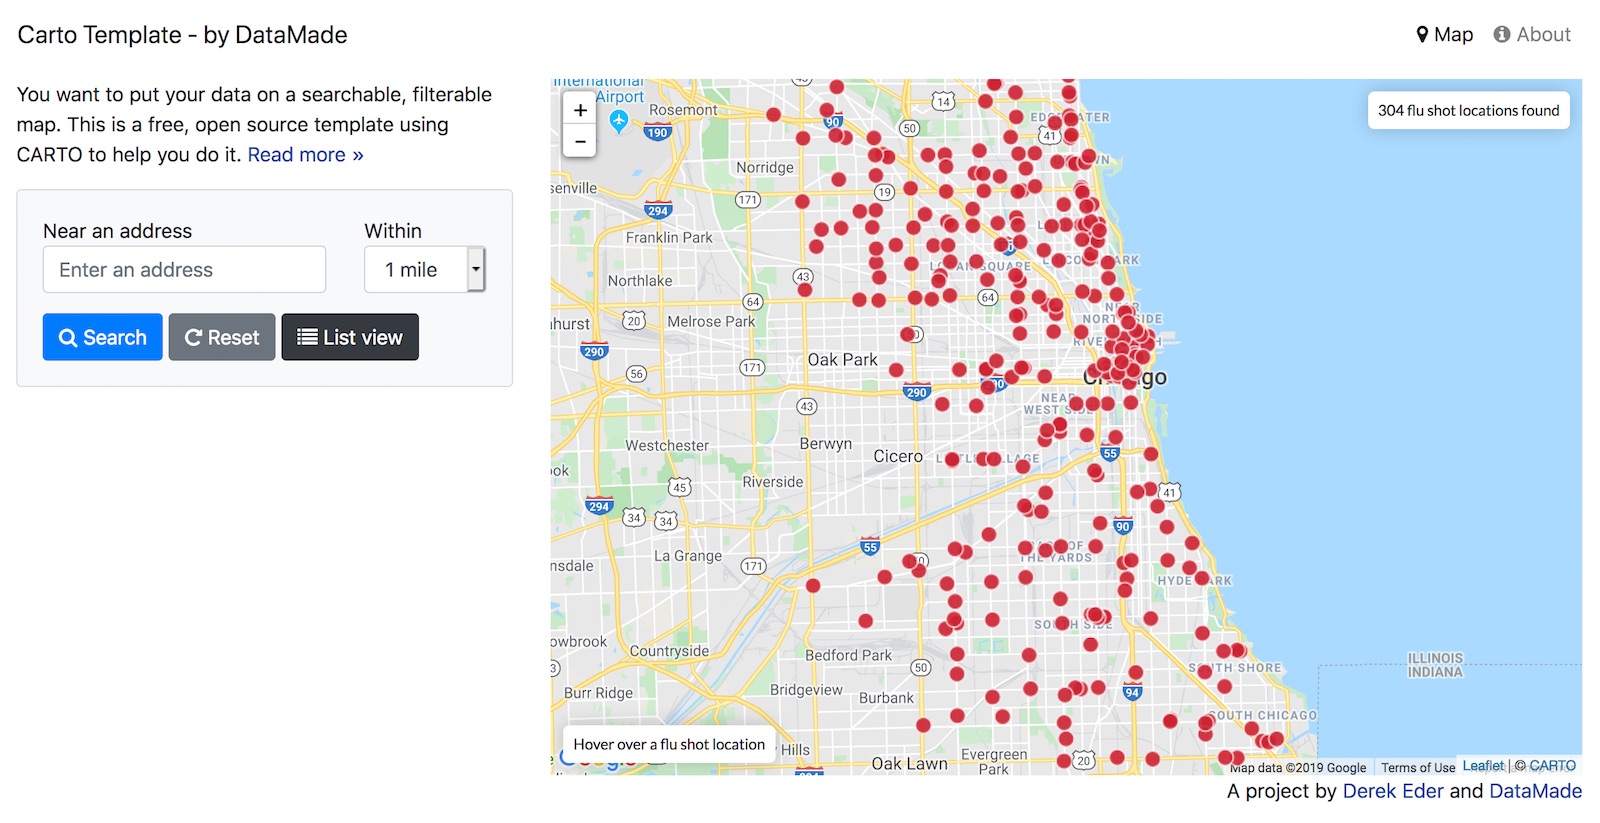
- address search (with variable radius and geocomplete)
- results count
- powered by the CARTO mapping platform
- map and list view modes
- large info windows when clicking on a point
- easy customization of hover, popup and table views
- RESTful URLs for sharing searches
- ability to easily add additional search filters (checkboxes, sliders, etc)
- mobile and tablet friendly using responsive design (Bootstrap 4)
- built with HTML, CSS and Javascript - no server side code required
This template depends on other JS libraries and resources:
- Macoupin Resource Directory (code) - an online source for finding businesses, local governments and community services.
- Vacant and Abandoned Building Finder - Chicago (code) - find vacant and abandoned buildings in Chicago. Data comes from reports made for open and vacant buildings to 311 since July 1, 2018.
Older versions of this Carto Template
- Probation Community Resources (code)- Find resources near you for adults and juveniles on probation in Cook County. Includes many advanced filters.
- Chicago Urban Agriculture Mapping Project - a collaborative map and inventory of urban agriculture and community gardens in Chicago since 2010.
This template borrows heavily from Derek Eder's Fusion Tables Map Template and follows a similar code pattern and architecture. It is intended to be easy to pick up and modify by people with limited coding experience and not require anything to be installed on your computer or server to run it.
That being said, there are some differences between this template and the Fusion Tables Map Template, namely:
- Powered by CARTO instead of Fusion Tables. While they are similar platforms, CARTO is built on top of an open source stack with postgres and uses Leaflet for rendering the maps. This translates into syntax changes in the javascript API, most of which I've abstracted away into
cartodb_lib.js. - Cost. This is a big one. Fusion Tables was free, CARTO is not. CARTO has gotten pretty expensive recently (to the tune of $199/month). They do offer Grants, however, as well as free acccounts to Students and Educators.
- Using Bootstrap 4. I upgraded to the latest version of Boostrap when building this template. There are some notable changes in syntax with these versions, which are documented here.
- List view included by default. I decided to include the list view mode by default, as it is the best way to view results on a mobile phone. It requires editing an additonal template
templates/table-row.ejsbut I think is worth the extra work to customize. - Hover functionality. Because it was pretty to do in Leaflet, this template includes the ability to hover over a point and see a preview of the point data before clicking on it.
- Referencing column names. Columns in CARTO are converted to lower case with underscores (
First Name=>first_name). A minor, but important difference. - It works! Fusion Tables is no longer active, so projects made with the old template will no longer work. This template does work, which is a big improvement!
Follow the steps below and you'll be in business with your own map.
- Sign up for a CARTO account. Note that CARTO costs money, but they do offer Grants, as well as free acccounts to Students and Educators.
- Once your account is set up, add a new dataset, either by uploading a file, or providing a link to one. Carto supports many geospatial data formats.
- Once your data is uploaded, make your new dataset 'Public' or visible 'With link' so it can be accessed publicly. You will want to save the table name for this dataset for the
tableNameconfiguration variable. - Next, click the
Visualizebutton in the upper right corner to create a map. You can customize how the map looks within CARTO, but it is not necessary for this template. - Next, click the
Publishbutton in the upper right corner. This will open up a window that gives you 3 options. Copy theCartoDb.jsoption on the far right and save it to thelayerUrlvariable. It will look something like this:https://datamade.carto.com/api/v2/viz/3d861410-d645-4c10-a19d-ef01c1135441/viz.json.
- Download or clone this project and fire up your text editor of choice. Open up
/js/map.jsand set your map options in theCartoDbLib.initializefunction:
map_centroid- the lat/long you want your map to center on (find yours here)layerUrl- The visualization layer from CARTO. It should look like this:https://datamade.carto.com/api/v2/viz/3d861410-d645-4c10-a19d-ef01c1135441/viz.jsontableName- The table in CARTO containing your map data.userName- Your CARTO user name.fields- A comma separated list of fields in your CARTO table that you want available for the map. You must include at minimumcartodb_idandthe_geom. Columns in CARTO are converted to lower case with underscores (First Name=>first_name), so make sure they are correct.
- Replace the API key on this line of
index.htmlwith yours:<script type="text/javascript" src="https://maps.google.com/maps/api/js?libraries=places&key=[YOUR KEY HERE]"></script> - Edit the templates in the
templatesfolder for how you want your data displayed. These templates use EJS, which allows the display of your variables with HTML, as well as conditional logic. Documentation is here.
/templates/hover.ejs- template for when you hover over a dot on the map/templates/popup.ejs- template for when a dot on the map is clicked/templates/table-row.ejs- template for each row in the list view
- Update the map styles at the bottom of
index.html. By default, your locations will show up as red dots, but you can change this by changing the cartocss. Documentation is here.
<style id="maps-styles">
  #my-map{
    marker-fill-opacity: 0.9;
    marker-line-color: #FFF;
    marker-line-width: 1;
    marker-line-opacity: 1;
    marker-placement: point;
    marker-type: ellipse;
    marker-width: 13;
    marker-fill: #CE2232;
    marker-allow-overlap: true;
  }
</style>
- Add/modify additional filters to
index.htmland/js/cartodb_lib.js. This will depend on the data you are trying to map. - Upload this map and all the supporting files and folders to your site. This map requires no back-end code, so any host will work, including GitHub pages, Netlify or your own web server.
You can configure your map by passing in a dictionary of options when you call the CartoDbLib.initialize function in /js/map.js. Here's an example:
CartoDbLib.initialize({
    map_centroid: [41.85754, -87.66231],
    defaultZoom:  11,
    layerUrl:     'https://datamade.carto.com/api/v2/viz/3d861410-d645-4c10-a19d-ef01c1135441/viz.json',
    tableName:    'flu_shot_locations_2014_present_2019_2020_season',
    userName:     'datamade',
    fields :      'cartodb_id, the_geom, cost, facility_name, hours, phone, street1, street2, city, state, url',
    listOrderBy: 'facility_name',
    recordName: 'flu shot location',
    recordNamePlural: 'flu shot locations',
    radius: 1610,
});| Option | Default value | Notes |
|---|---|---|
| map_centroid | [41.881832, -87.623177] | Center [latitude, longitude] that your map shows when it loads. Defaults to Chicago. |
| defaultZoom | 11 | Default zoom level when map is loaded (bigger is more zoomed in). |
| searchRadius | 805 | Default search radius. Defined in meters. Default is 1/2 mile. |
| layerUrl | The visualization layer from CARTO. It should look like this: https://datamade.carto.com/api/v2/viz/3d861410-d645-4c10-a19d-ef01c1135441/viz.json |
|
| tableName | The table in CARTO containing your map data. | |
| userName | Your CARTO user name. | |
| fields | A comma separated list of fields in your CARTO table that you want available for the map. You must include at minimum cartodb_id and the_geom |
|
| recordName | record | Used for showing the count of results. |
| recordNamePlural | records | |
| listOrderBy | Optional. The field in which you want the list results to be sorted. Supports appending DESC for descending order. |
For making customizations to this template
For deeper updates to the library
If your map isn't displaying any data, try the following:
- Use the Chrome developer console or install Firebug for FireFox. This will do you to debug your javascript.
- Load your map in the browser and open the javascript console
- Chrome developer console on a Mac: Option+Command+J
- Chrome developer console on a PC: Control+Shift+J
- Firebug in Firefox: Tools => Web Developer => Firebug => Open Firebug)
- If you do see javascript errors:
- The error will tell you what line it is failing on. Best to start by going there!
- Columns in CARTO are converted to lower case with underscores (
First Name=>first_name), so make sure they are correct.
If something is not behaving intuitively, it is a bug, and should be reported. Report it here: https://github.com/datamade/CartoTemplate/issues