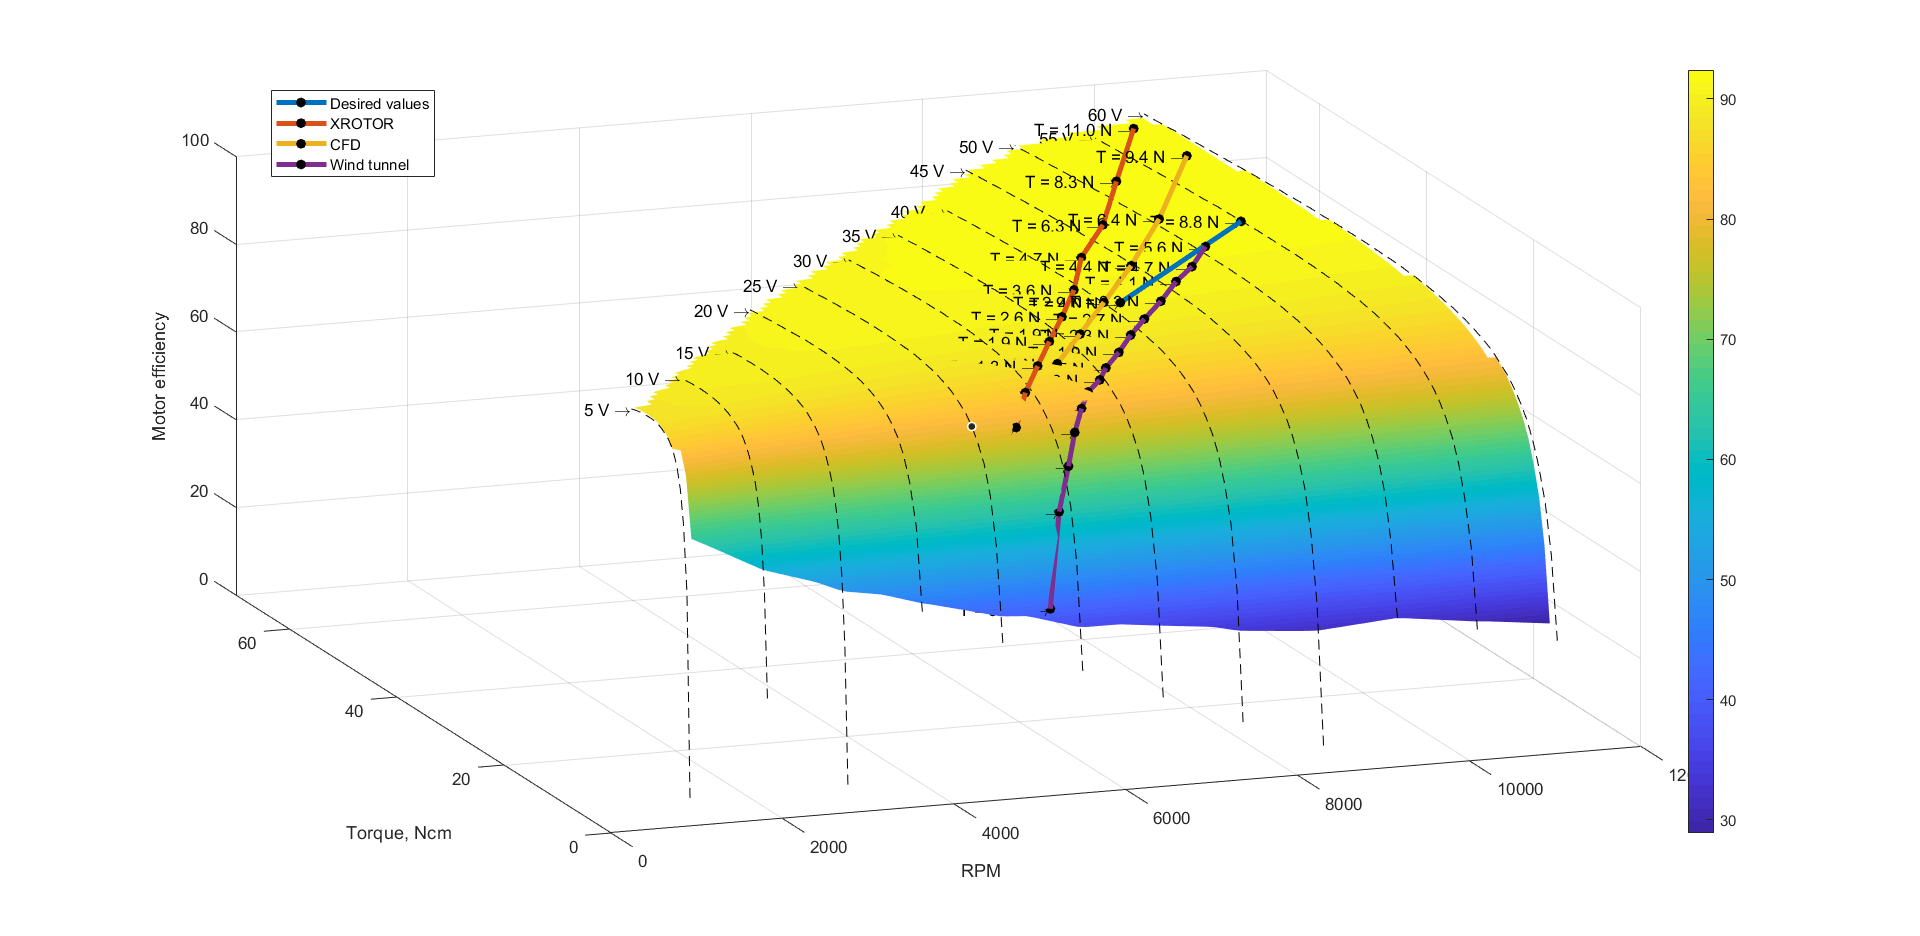
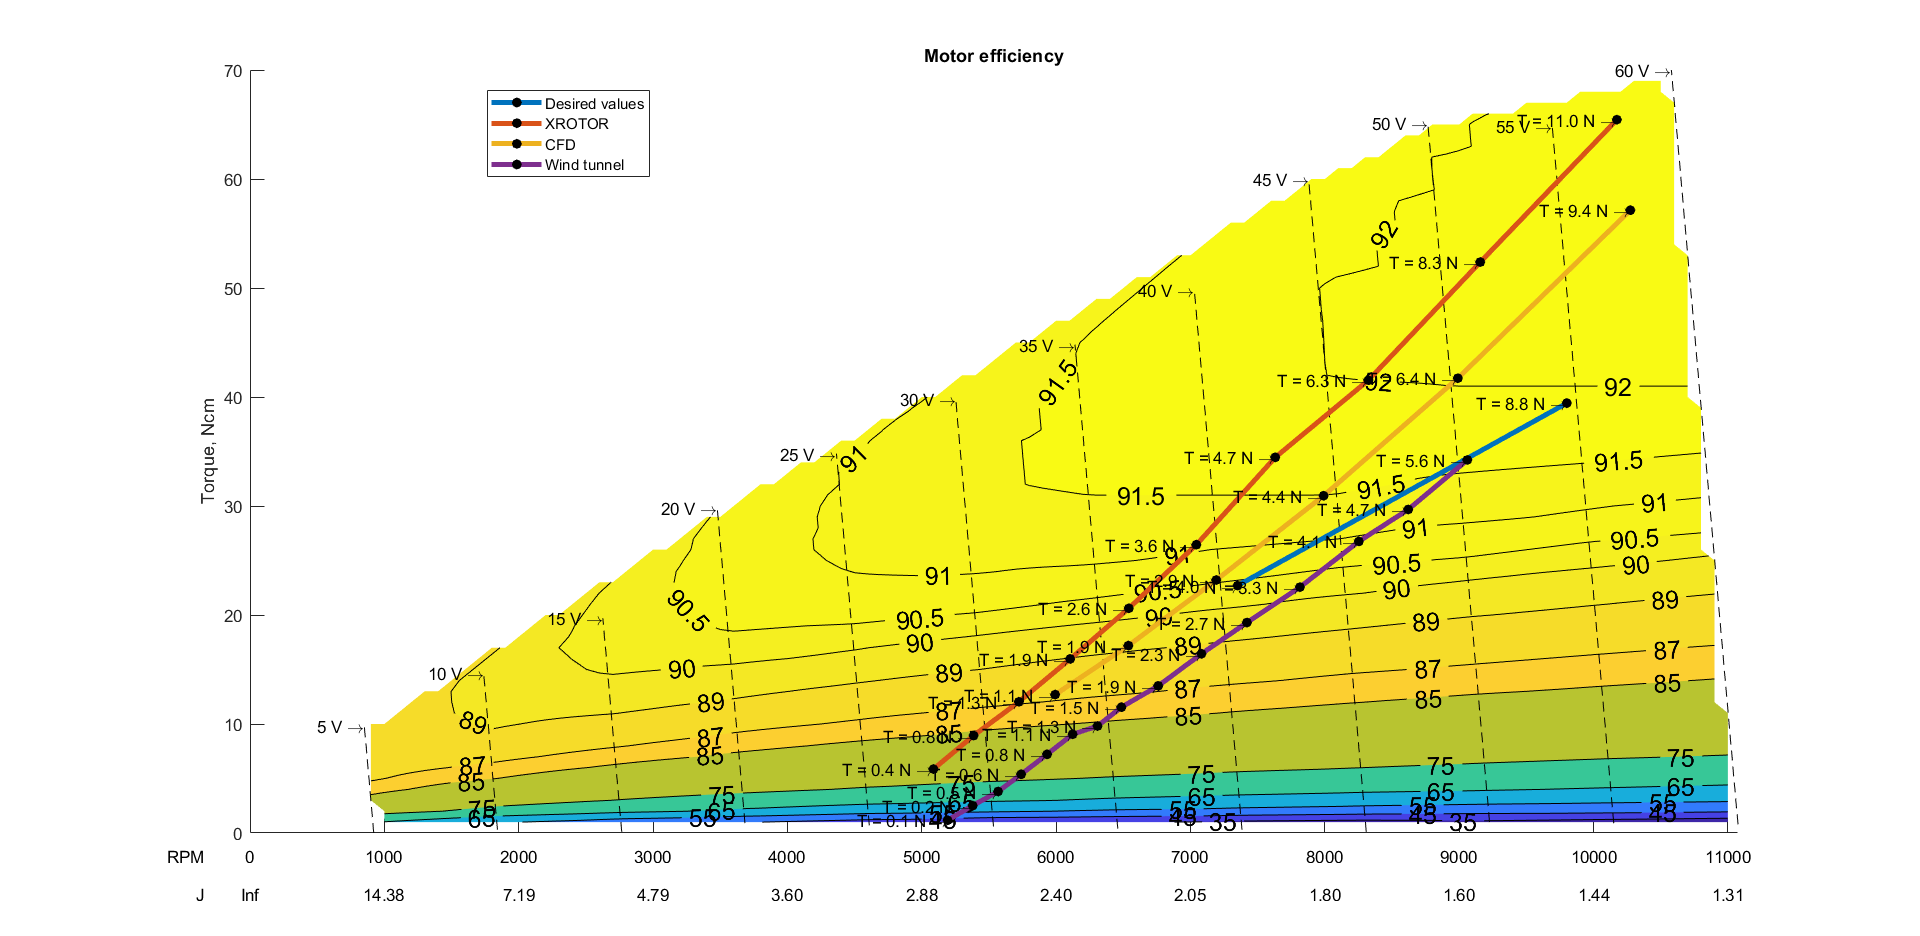
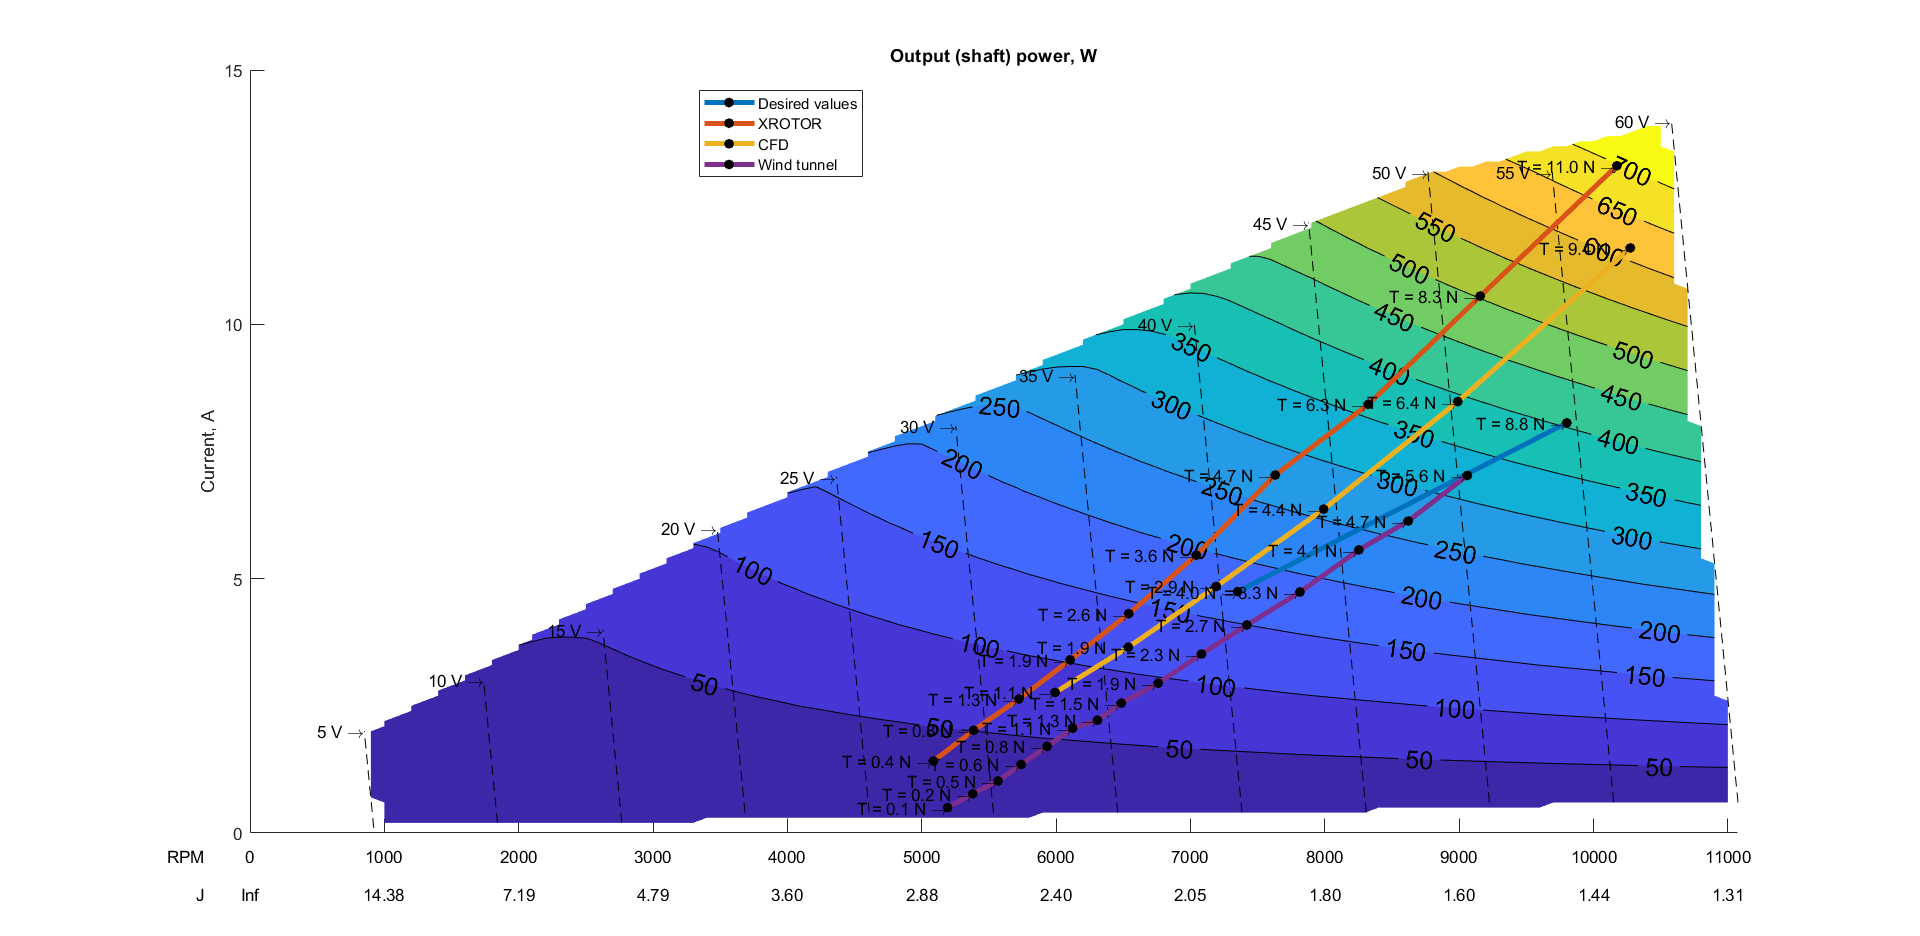
Calculate the Lehner© 2280-40 electric motor map from performance data released by the manufacturer. Plot motor performance maps in terms of torque, shaft power, efficiency, and absorbed current as function of RPM and input voltage. Plot propeller operating points on the map. Include gear ratio and gearbox losses.
If you are is satisfied with the default motor data, then skip to the Usage section.
The code is entirely written in MATLAB®. The structure is as follows:
| Name | Type |
|---|---|
| data | folder |
| example | folder |
| README.md | this readme file |
| LICENSE | license file |
| annot.m | MATLAB function |
| annot3.m | MATLAB function |
| plotData.m | MATLAB function |
| voltagePlot.m | MATLAB function |
| voltagePlot3.m | MATLAB function |
| performanceCharts.m | MATLAB main script |
The software has one main script performanceCharts.m and several functions to run. Motor data is imported from .csv files located in the data folder. Each file contains data manually imported from the webpage http://www.lehner-motoren.com/calc/diagramm_en.php. Therefore, each .csv file is for a fixed input voltage. Columns contain the follwing data:
| Current (A) | Input power (W) | RPM (/min) | Torque (Ncm) | Output power (W) | Efficiency (%) |
|---|---|---|---|---|---|
| ... | ... | ... | ... | ... | ... |
| 10.8 | 648.0 | 10698 | 53.4 | 598.7 | 92.4 |
| 11.0 | 660.0 | 10690 | 54.5 | 609.8 | 92.4 |
| 11.2 | 672.0 | 10683 | 55.5 | 620.9 | 92.4 |
| 11.4 | 684.0 | 10675 | 56.5 | 632.0 | 92.4 |
| ... | ... | ... | ... | ... | ... |
Therefore, any electric motor data can be imported and plotted, although this software is focused on the 2280-40 for my research activities.
The program will interpolate data to plot the motor performance maps and the achievable propeller operating points. For the first time, just hit RUN on the MATLAB® toolbar to get a demo.
At the beginning of the main script performanceCharts.m the following variables are assigned:
propDiam: the propeller diameter in meters, assigned by the userwindSpeed: the advance speed of the propeller in m/s, assigned by the userJconv: a conversion factor from RPM to advance ratio J, pre-defined
Then the user should write the propeller operating points of interest. If none, the program should only show the motor performance map charts without propeller data points.
Each propeller is defined as a matrix. Each column correspond to a given quantity, i.e. Thrust, Shaft Power, RPM. Each row is a different combination of these quantities defining a data point. For instance:
| Thrust (N) | Shaft Power (W) | (RPM) |
|---|---|---|
| 37.32 | 1317.6 | 10000 |
| 20.72 | 645.7 | 8000 |
| 11.94 | 345.3 | 6667 |
| 6.82 | 191.2 | 5714 |
| 3.61 | 104.4 | 5000 |
Many of these matrices can be assigned, each one corresponding to a single propeller, so that different propellers can be observed on the motor map. Each of these matrices then must have a unique identifier. Actually, each matrix is an element of the cell array condition, so that there will be condition{1}, condition{2}, and condition{3} if three propellers have to be analyzed. There is no limit, but do not compare too much data to avoid a cluttered chart.
To easily distinguish each propeller, labels are assigned to each matrix in another cell array, named conditionLabels. For instance, there will be conditionLabels = {'Prop 1', 'Prop 2', 'Prop 3'} if three propellers have to be analyzed.
Finally, to account for gear ratio and gearbox losses, two more variables must be edited:
gratio: gear ratio of each propeller, 1D arraygloss: gearbox losses for each propeller, 1D array
For instance, in case of three propellers we must have three numbers for each array:
gratio = [1, 4, 3]
gloss = [0.0, 0.10, 0.05]
To eliminate the gearbox just assign 1 to gratio and 0 to gloss, but always match the number of elements with the number of conditions.
Actually the outputs are six charts: three 3D plots and three contours. Please, keep in mind that the J axis in the contour plot is referred to the values assigned to propdiam and windSpeed, therefore if your propeller data do not match these reference values, the conversion between RPM and J will be wrong and only the RPM values should be looked.