pip3 install https://github.com/denschmitz/pins_tiles/archive/refs/heads/master.zip
Implements data types for Pin(lat, lng), BaseTile(x, y, zoom), and Tile(x, y, zoom, img)
A Pin is a namedtuple with methods attached to it, and is thus immutable. It allows direct population of the longitude and latitude parameters and also calculates a pin from other sorts of data.
A Tile is a namedtuple with an immutable base class BaseTile. A tile is created with an (x, y, zoom) tuple and adds itself to a queue that fetches the image (currently works with google, openstreetmap and several other free tile services). A tile can also be created from a pin returning the tile containing that pin. If created from a list of pins, it returns a list of tiles that spans the entire area taken by the pins.
Tiles are cached to disk with simple algorithm: if the tile is already on disk, use that one; if the tile is not on disk, fetch it and store it to disk. Filename format is x_y_zoom_servicename.png.
Utility function get_bounded_map() will build a map from a bound defind by a set of pins and return a map composited from individual tiles and cropped to the bound. Detail level 1 corresponds to the tile zoom where 1 tile can contain all of the pins and each increasing detail level doubles that.
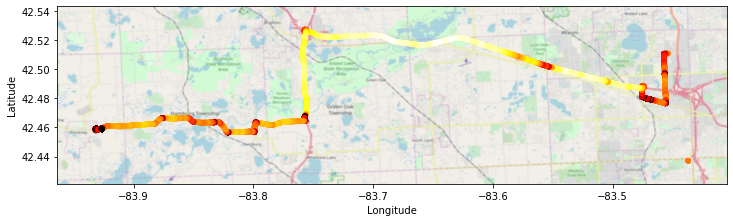
I use get_bounded_map() to plot longitude, latitude traces of my car data from a OBD2 adapter on a matplotlib canvas.
Utility function tile_up() takes a list of tiles and composits them into a mosaic, returning the composite image along with its (lat, long) bounds. This is called by get_bounded_map() to create the canvas.
There is quite a bit of material on converting long/lat to tiles. It all comes to dividing a Mercator projection into little squares. The square that has the whole world is zoom level 0, with doubling each level. The mapping services deliver square png or gif images to cover the area.
If you look at the image below, you can see that the level zero tile doesn't include the poles if you try to make a square holding the world; this is because the projection puts the poles at infinity. This also means that the closer you get to the poles, the less square the area the tile represents. This doesn't mean anything other than you may have to tweak the aspect ratio of your plots near the poles. TODO: integrate aspect adjustment to get_bounded_map() for people who hate the sun.
All of the conversions are routed through the same forward and backward transforms for clarity.
Below is material from Wolfram: http://mathworld.wolfram.com/MercatorProjection.html
The Mercator projection is a map projection that was widely used for navigation since loxodromes are straight lines (although great circles are curved). The following equations place the x-axis of the projection on the equator and the y-axis at longitude , where
is the longitude and
is the latitude.
Multiplying by the sphere radius gives a span normalized to for a convenient map to the circumference.
The inverse formulas are
where gd(y) is the Gudermannian.

Web mercator from wikipedia
latitude limit which makes square output: