Forecast #1322
Forecast #1322
Conversation
Codecov Report
@@            Coverage Diff             @@
##           master    #1322      +/-   ##
==========================================
+ Coverage   87.07%   87.14%   +0.07%
==========================================
  Files         227      229       +2
  Lines       29060    29377     +317
  Branches     3123     3147      +24
==========================================
+ Hits        25303    25602     +299
- Misses       3047     3060      +13
- Partials      710      715       +5
Continue to review full report at Codecov.
|

|
Hi Mauro - this looks fantastic. Thanks for the contribution! Before I go into a detailed review, I do have one initial comment: the current Fit method doesn't seem to have a |
There was a problem hiding this comment.
Hi @maurozucchelli , Thank you for this !
I think you should add your example in 2 places : -
doc/examples/valid_examples.txtdoc/examples_index.rst
After a quick test, everything seems to run/generate without any problems. I just added a couple of PEP8 comment before an algorithm review.
| The implementation of FORECAST may require CVXPY (http://www.cvxpy.org/). | ||
| """ | ||
|
|
||
| def __init__(self, |
There was a problem hiding this comment.
I think you need to initialize the parents class so it miss the call to init of super class. Something like super(ForecastModel, self).__init__(your_arguments).
There was a problem hiding this comment.
Hi, I followed SHORE and MAPMRI style. What is the difference between this and the simple init that I used?
There was a problem hiding this comment.
Ok, I see, there is the same mistake on SHORE and MAPMRI :-). ReconstModel should initialize some variable (like gtab). You can see some examples on FWDTI, LIFE or SFM.
You should keep your __init__, this one initialize your class ForecastModel. You just have to initialize ReconstModel since you inherit from this class.
def __init__(self, gtab, sh_order=8, lambda_lb=1e-3,
             optimizer='wls', sphere=None, lambda_csd=1.0)

        # your docstrings
        super(ForecastModel, self).__init__(gtab)  # or ReconstModel.__init__(gtab)
dipy/reconst/forecast.py
Outdated
| from dipy.reconst.cache import Cache | ||
| from dipy.reconst.multi_voxel import multi_voxel_fit | ||
| from dipy.reconst.shm import real_sph_harm | ||
| from dipy.core.gradients import gradient_table |
There was a problem hiding this comment.
unused import. I think you can remove it
dipy/reconst/forecast.py
Outdated
| from dipy.reconst.shm import real_sph_harm | ||
| from dipy.core.gradients import gradient_table | ||
| from scipy.special import erf | ||
| from math import factorial |
There was a problem hiding this comment.
unused import. I think you can remove it
dipy/reconst/forecast.py
Outdated
| self.bvals = np.round(gtab.bvals/100) * 100 | ||
| self.bvecs = gtab.bvecs | ||
| self.gtab = gtab | ||
| if sh_order >= 0 and not(bool(sh_order % 2)) and sh_order<=12: |
There was a problem hiding this comment.
PEP8: missing space around operator <=
dipy/reconst/forecast.py
Outdated
|
|
||
| data_b0 = data[self.b0s_mask].mean() | ||
| data_single_b0 = np.r_[data_b0, data[~self.b0s_mask]] / data_b0 | ||
| #data_single_b0 = np.clip(data_single_b0, 0, 1.0) |
There was a problem hiding this comment.
PEP8: missing space after block comment
doc/examples/reconst_forecast.py
Outdated
|
|
||
| from dipy.reconst.forecast import ForecastModel | ||
| from dipy.reconst.shm import sh_to_sf | ||
| from dipy.viz import fvtk |
doc/examples/reconst_forecast.py
Outdated
| from dipy.viz import fvtk | ||
| # from dipy.data import fetch_sherbrooke_3shell, read_sherbrooke_3shell, get_sphere | ||
| from dipy.data import fetch_cenir_multib, read_cenir_multib, get_sphere | ||
| from dipy.core.gradients import gradient_table |
doc/examples/reconst_forecast.py
Outdated
| mask_small = data_small[..., 0] > 1000 | ||
|
|
||
| """ | ||
| Instantiate the FORECAST Model. |
doc/examples/reconst_forecast.py
Outdated
| Let us consider only a single slice for the FORECAST fitting | ||
| """ | ||
|
|
||
| data_small = data[18:87,51:52,10:70] |
doc/examples/reconst_forecast.py
Outdated
| Display a part of the fODFs | ||
| """ | ||
|
|
||
| from dipy.viz import fvtk |
There was a problem hiding this comment.
maybe you should remove this import and keep the one in the top of the file
dipy/reconst/forecast.py
Outdated
| >>> gtab = get_3shell_gtab() | ||
| >>> from dipy.sims.voxel import MultiTensor | ||
| >>> mevals = np.array(([0.0017, 0.0003, 0.0003], | ||
| >>> [0.0017, 0.0003, 0.0003])) |
There was a problem hiding this comment.
doctest failed, I think it should be ... [0.0017, 0.0003, 0.0003])) here.
dipy/reconst/forecast.py
Outdated
| >>> angl = [(0, 0), (60, 0)] | ||
| >>> data, sticks = MultiTensor( | ||
| >>> gtab, mevals, S0=100.0, angles=angl, | ||
| >>> fractions=[50, 50], snr=None) |
1 similar comment
1 similar comment
|
I got an error in travis for "test_csdeconv.py" but I did not modify that file, nor any other files except the FORECAST ones. What should I do with this error? |
|
That error is on the PRE=1 machine. That means that it's detecting errors that will start appearing in upcoming releases of one of our dependencies (in this case, the upcoming numpy 1.14). We should resolve that in a separate PR. I posted an issue here: #1323 |
|
I have updated the branch, merging nipy/dipy master in order to solve the CSD error in Travis. Now everything should be ok |
|
Thanks for this update @maurozucchelli. New feature for the release in October ! We just need to complete the review and it might be good to have other suggestions. Can you have a look @arokem @Garyfallidis or anyone else ? |
|
Running the example, I get a UserWarning: |
doc/examples/reconst_forecast.py
Outdated
|
|
||
| import matplotlib.pyplot as plt | ||
| from dipy.reconst.forecast import ForecastModel | ||
| from dipy.viz import fvtk |
There was a problem hiding this comment.
fvtk will be deprecated in the near future. Can you replace it by the new API ? You can look at the Tracking Quick Start example
There was a problem hiding this comment.
I'm doing some tests. If I try to do something like:
ren = window.Renderer()
odf_actor = actor.odf_slicer(odf[16:36, :, 30:45], sphere = sphere, colormap='jet')
odf_actor.RotateX(-90)
ren.add(odf_actor)
window.record(ren, out_path='fODFs.png', size=(600, 600), magnification=1)
window.show(ren)
I have a problem: I can see only a line of overlapping ODFs and not a 2D grid of ODFs like while using fvtk. All the visualization parameters are the same for both functions (odf_slicer, and fvtk.sphere_func).
Is it correct what I'm doing? What is the problem here?
|
@arokem Hi! I replaced my CSD implementation with DIPY csdeconv but we still get the warning. I think that some voxels near the brain border are corrupted. The easiest solution is to mask the data, using median_otsu or some other techniques. What do you think? |
|
Might there be a 90 degree rotation somewhere relative to the other figure,
and we're looking at the slice from the side?
…On Mon, Sep 25, 2017 at 6:10 AM, maurozucchelli ***@***.***> wrote:
***@***.**** commented on this pull request.
------------------------------
In doc/examples/reconst_forecast.py
<#1322 (comment)>:
> @@ -0,0 +1,145 @@
+"""
+==============================================================
+Crossing invariant fiber response function with FORECAST model
+==============================================================
+
+We show how to obtain a voxel specific response function in the form of
+axially symmetric tensor and the fODF using the FORECAST model from
+[Anderson2005]_ , [Kaden2016]_ and [Zucchelli2017]_.
+
+First import the necessary modules:
+"""
+
+import matplotlib.pyplot as plt
+from dipy.reconst.forecast import ForecastModel
+from dipy.viz import fvtk
I'm doing some tests. If I try to do something like:
ren = window.Renderer()
odf_actor = actor.odf_slicer(odf[16:36, :, 30:45], sphere = sphere,
colormap='jet')
odf_actor.RotateX(-90)
ren.add(odf_actor)
window.record(ren, out_path='fODFs.png', size=(600, 600), magnification=1)
window.show(ren)
I have a problem: I can see only a line of overlapping ODFs and not a 2D
grid of ODFs like while using fvtk. All the visualization parameters are
the same for both functions (odf_slicer, and fvtk.sphere_func).
Is it correct what I'm doing? What is the problem here?
[image: fodfs]
<https://user-images.githubusercontent.com/5042250/30809880-913683e4-a203-11e7-917a-000dacdc7980.png>
—
You are receiving this because you were mentioned.
Reply to this email directly, view it on GitHub
<#1322 (comment)>, or mute
the thread
<https://github.com/notifications/unsubscribe-auth/AAHPNvvdNSgw_n-lZxZIGEoZh1-LlGlMks5sl6YsgaJpZM4PAD-t>
.
|
|
Hi @maurozucchelli and thanks for the PR. If your odf is too large for your memory. Just memory map it using np.memmap before giving it as input to odf_slicer. |
|
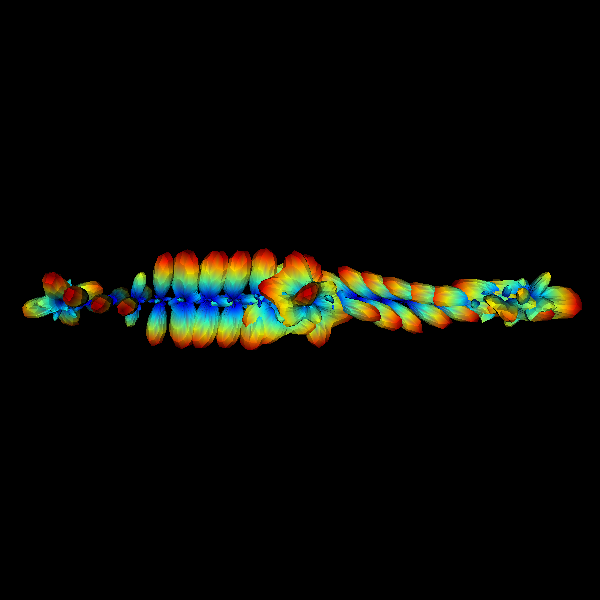
Thanks @Garyfallidis ! it works well ! I just wonder why there is some red ball on this result as you can see on the top left in the image below ?
|

|
Hello! I fixed the example as suggested by @Garyfallidis and @skoudoro and modified a bit the main code to improve stability. |
|
I got an error in some non-forecast related tests with travis using PRE=1, e.g. vec2vec_rotmat, which I didn't had before. Is there a way to fix these errors? |
|
we talked about these errors on issue #1346. I plan to fix it today and then, you can rebase. Thanks for your fix ! I will review it ASAP |
a1ec448
to
ee5d7bf
Compare
|
Hi I rebased! Now everything seems to work fine |
|
Hi @maurozucchelli apologies for delaying to review this PR. See my comments. Also you will probably have to rebase again. Will see in your next commit in this PR. We have fixed some issues for upcoming numpy and there will be merging issues if you do not rebase. Thanks for the great PR. Waiting for the minor fixes!! :) |
ee5d7bf
to
083b667
Compare
doc/examples/reconst_forecast.py
Outdated
|
|
||
| sh_order is the spherical harmonics order used for the fODF. | ||
|
|
||
| optimizer is the algorithm used for the FORECAST basis fitting, in this case |
There was a problem hiding this comment.
CSD is not an optimizer. CSD is a model. Do you mean something else here @maurozucchelli ?
For example, do you mean the same optimization as it happened in CSD?
There was a problem hiding this comment.
Exaclty, the same iterative optimization algorithm employed in the CSD model can be used here. We can change the name to "deconvolution_algorithm" or something on this line.
doc/examples/reconst_forecast.py
Outdated
| """ | ||
| Instantiate the FORECAST Model. | ||
|
|
||
| sh_order is the spherical harmonics order used for the fODF. |
There was a problem hiding this comment.
You may want to add quotes around sh_order.
|
|
||
| class ForecastModel(OdfModel, Cache): | ||
| r"""Fiber ORientation Estimated using Continuous Axially Symmetric Tensors | ||
| (FORECAST) [1,2,3]_. FORECAST is a Spherical Deconvolution reconstruction model |
There was a problem hiding this comment.
What is interesting in this model is that I don't see any response function. Why is that? Deconvolution without a response? Please explain.
There was a problem hiding this comment.
The response is estimated in each voxel independently using the mean of the signal on each shell to characterize the diffusivity parallel and perpendicular. This technique works fairly well but is quite sensitive to noise!
| r"""Fiber ORientation Estimated using Continuous Axially Symmetric Tensors | ||
| (FORECAST) [1,2,3]_. FORECAST is a Spherical Deconvolution reconstruction model | ||
| for multi-shell diffusion data which enables the calculation of a voxel | ||
| adaptive response function using the Spherical Mean Tecnique (SMT) [2,3]_. |
There was a problem hiding this comment.
Do we have a comparison anywhere against CSA and and CSD? Do we see important qualitative/quantitative or methodological differences?
There was a problem hiding this comment.
It can be seen exactly like a CSD with a voxel adaptive response function.
dipy/reconst/forecast.py
Outdated
| gtab, | ||
| sh_order=8, | ||
| lambda_lb=1e-3, | ||
| optimizer='WLS', |
There was a problem hiding this comment.
Is the default optimizer the best option? Or the easiest?
There was a problem hiding this comment.
It is the fastest. I can make the CSD the default because it is more robust!
dipy/reconst/forecast.py
Outdated
| return v | ||
|
|
||
|
|
||
| def Psi_l(l,b): |
There was a problem hiding this comment.
lower case in function names
dipy/reconst/forecast.py
Outdated
| def forecast_matrix(sh_order, d_par, d_perp, bvals): | ||
| r"""Compute the FORECAST radial matrix | ||
| """ | ||
| n_c = int((sh_order + 1)*(sh_order + 2)/2) |
There was a problem hiding this comment.
okay... spaces around operators.
dipy/reconst/forecast.py
Outdated
| r, theta, phi = cart2sphere(vecs[:, 0], vecs[:, 1], vecs[:, 2]) | ||
| theta[np.isnan(theta)] = 0 | ||
|
|
||
| n_c = int((sh_order + 1)*(sh_order + 2)/2) |
|
|
||
| def lb_forecast(sh_order): | ||
| r"""Returns the Laplace-Beltrami regularization matrix for FORECAST | ||
| """ |
| Display a part of the fODFs | ||
| """ | ||
|
|
||
| odf_actor = actor.odf_slicer(odf[16:36, :, 30:45], sphere=sphere, |
There was a problem hiding this comment.
If you want to show the entire slice and the ODF and you don't do that for memory issues you can just create a memmap (using np.memmap) of the odf and give that to the odf_slicer. I believe I have an example of that in the odf_slicer's tests.
There was a problem hiding this comment.
This is good work so let's make this as beautiful as possible.
| Load an odf reconstruction sphere | ||
| """ | ||
|
|
||
| sphere = get_sphere('symmetric724') |
There was a problem hiding this comment.
The sphere called 'repulsion724' is a better sphere. Better evenly distributed. Made by Dr. @mpaquette !
|
OKay! I am merging this. In general., for next time if you want to visualize ODFs see the following lines for ideas. |
|
Congrats @maurozucchelli! |
|
Thank you @Garyfallidis! And also @arokem, @skoudoro and @gabknight for the feedbacks! :) |
Dear DIPY developers,
This pull request is made to add the FORECAST model to DIPY:
http://onlinelibrary.wiley.com/doi/10.1002/mrm.20667/full
FORECAST is a Spherical Deconvolution method that allows estimating voxel specific response function in the form of an axially symmetric tensor. From this tensor, FORECAST has been recently used for estimating crossing invariant diffusivities and fractional anisotropy in:
http://onlinelibrary.wiley.com/doi/10.1002/mrm.25734/full
I'm going to present the comparison between FORECAST and similar techniques at the 2017 MICCAI Computational Diffusion MRI workshop and this implementation is based on the one that I use for that work.
Best wishes,
Mauro