This issue was moved to a discussion.
You can continue the conversation there. Go to discussion →
Performance and scaling #11766
Comments
|
I also saw, that Directus does not create any indexes on foreign keys, even in translations. |
This issue was moved to a discussion.
You can continue the conversation there. Go to discussion →
Preflight Checklist
Describe the Bug
I recently struggle with optimizing and performance tests of my Directus deployment. The results are kinda overwhelming.
I have a collection with around 15 relations: translations, some images, taxonomy (like tags, languages) and some other related collections. I also use a lot of permissions.
I ran a rather simple GQL GET query on that collection (without going too deep and taking only a couple of relations), running Directus locally with rather good CPU (it has available around 1 core) and some RAM. I deliberately do not use cache in this test to simulate "unique users" - because I have authentication, so each user has it's own cache anyway and I need to know how many unique users will be accepted. The results are:

So for 10 unique requests per second, each request by average took 1.5s. Afaik, most of that time was spent on
runASTfunction.I have also performed a test for my own, optimized endpoint and found out that running my implementation for endpoint is by average 60-70% of time that Directus needs to respond. So even if I optimize it manually, it still has an overhead of 30%. While my endpoint took an average 47ms to run, Directus took an average of 72ms to respond.
I am testing locally, but I also have a Kubernetes cluster with 3 nodes (Azure Standard_D4s_v3, 3x 4vcpu 12GB ram), with 6 instances of Directus, each having 0.5vcpu and 1GB RAM and a pretty powerful DB. And looks like it's not enough for hundreds of users. It's harder to test on that cluster though, because it runs Directus 9.4.3. (locally I have newest), has caching enabled etc. For example, even with caching, 50 virtual users per sec for the same graphql query:
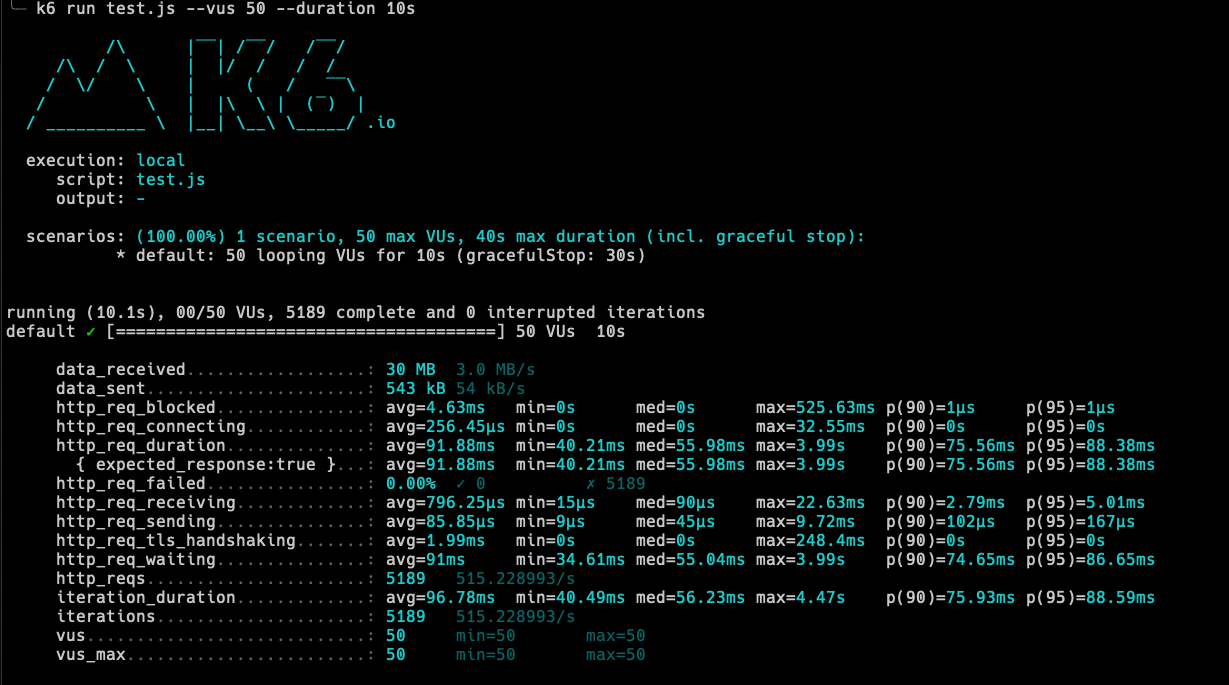
In other words, the best it took 40ms to respond with already cached value (each request is exactly the same). Probably I could spin up more instances or power up existing, but for example 10 instances with each 1 cpu and around 2GB would cost probably around 300 eur / month, just to serve, lets say, 100 simultaneous requests?
With 6 instances and 100 VU/s, each instance receives around 16 requests/s (same ones), and it was taking a lot of CPU to handle that:

Also, with identical requests to CMS (which should be instantly resolved from cache), if there are too many requests it starts failing:

Whereas my own endpoint, for some reason, works okay (has a lot longer average, but lower max):

Cache is run on redis, and redis isn't bottle-neck (it barely uses any resources).
What version of Directus are you using?
9.5.2 / 9.4.3
What version of Node.js are you using?
Directus Docker
What database are you using?
Azure PostgreSQL Flexible Server / Local PostgreSQL
What browser are you using?
N/A
What operating system are you using?
macOS / Linux
How are you deploying Directus?
Docker / Kubernetes
The text was updated successfully, but these errors were encountered: