[Android] Slow scrolling, laggy performance #9485
Comments
|
This bug has been reported so many times, none of them will be fixed |
|
In traces, I can see that the CollectionView calls SurfingApp!SurfingApp.Views.Templates.PostItemTemplate..ctor() again and again. Attaching traces. They contain everything that happens during the swipe gesture: |
Reviewed and can see the same. PostItemTemplate is created again and again. |
|
Related: xamarin/Xamarin.Forms#8718 (comment) |
|
I have the same problem. How do you upload such an app to the Play Store? you will be laughed at immediately. certain things need to be fixed as a matter of priority. |
|
Hey guys, I've developed a workaround to this issue that you can use until the MAUI team provides an official fix. https://gist.github.com/jedusei/e15f45e1ae385d8b57413c168d3ef730 |
|
Hello when can I expect this fix for net 6? |
|
THIS IS WHAT I recognized IN ALMOST ALL .NET NATIVE CONTROLS if LOTS of XAML Markups (FASTER ON RELEASE MODE)... Yes it is real native, But this undergo lots of compilations, logics and codes before it landed to native view. But it is getting better now. |
This should improve scrolling with collectionview? |
|
Reviewing this app, the first thing I noticed that the Next, I recording a 35% of the time is spent in:
This is deeply nested doing interop from C# -> Java -> C# -> Java many levels deep. I think we should remove this C# method somehow: maui/src/Core/src/Platform/Android/WrapperView.cs Lines 93 to 114 in 3859318 And put everything in Java, so nothing does interop at all here. I will investigate if it's even possible, because there may be a lot of C# logic happening here. |
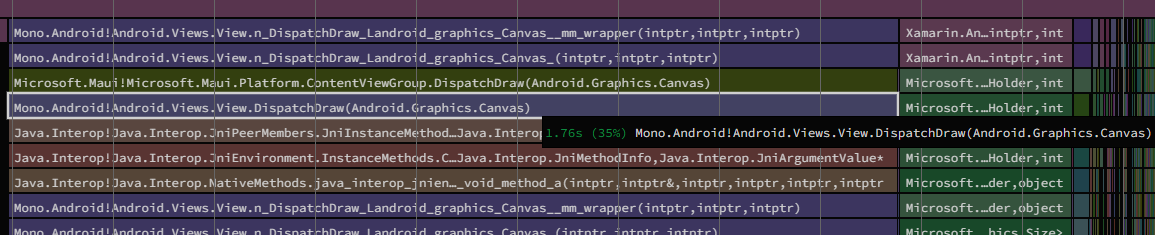
Fixes: dotnet#9485
Context: https://github.com/jsuarezruiz/netmaui-surfing-app-challenge
Context: https://developer.android.com/reference/androidx/core/app/FrameMetricsAggregator#getMetrics()
Context: https://medium.com/grindr-engineering/android-metrics-framerate-for-each-fragments-d311dbe909c1

Reviewing the "Surfing App" sample, I noticed that a lot of time is
spent doing Java interop when scrolling:

    1.76s (35%) Microsoft.Maui!Microsoft.Maui.Platform.WrapperView.DispatchDraw(Android.Graphics.Canvas)
    1.76s (35%) Microsoft.Maui!Microsoft.Maui.Platform.ContentViewGroup.DispatchDraw(Android.Graphics.Canvas)

This methods were deeply nested doing interop from Java -> C# -> Java
many levels deep. My thought is we can probably move some code from C#
to Java, in order to do a lot less interop while scrolling. I created
new `PlatformContentViewGroup` and `PlatformWrapperView` Java types
for this.

So to clarify, we go from:

* `ContentViewGroup`
    * `DispatchDraw(Canvas)` Java -> C#
    * `DispatchDraw(Canvas)` does a lookup for living C# instances of
      `Canvas`
* `ContentViewGroup`
    * `DispatchDraw(Canvas)` Java -> C# (only when `Clip` is set)
    * `GetClipPath(int, int)` has the width/height and no `Canvas`
* `WrapperView`
    * `ctor(Context)` makes several C# -> Java calls
    * `DispatchDraw(Canvas)` Java -> C#
    * `DrawShadow(Canvas)` makes several C# -> Java calls for width &
      height
    * `OnMeasure()` Java -> C#
* `WrapperView`
    * `ctor(Context)` does all the work in Java now
    * `DispatchDraw(Canvas)` Java -> C# (only when `Clip` or `Shadow` are set)
    * `GetClipPath(int, int)` has the width/height and no `Canvas`
    * `DrawShadow(Canvas, int, int)` passes in the width/height from Java
    * `OnMeasure()` stays completely in Java

So then, how do we measure if it is better/worse? I used the
`FrameMetricsAggregator` class we can add to any app's `MainActivity`:

    const int Duration = 1000;
    FrameMetricsAggregator aggregator;
    Handler handler;

    protected override void OnCreate(Bundle savedInstanceState)
    {
        base.OnCreate(savedInstanceState);

        handler = new Handler(Looper.MainLooper);
        aggregator = new FrameMetricsAggregator(FrameMetricsAggregator.TotalDuration);
        aggregator.Add(this);

        handler.PostDelayed(OnFrame, Duration);
    }

    void OnFrame()
    {
        var metrics = aggregator.GetMetrics()[FrameMetricsAggregator.TotalIndex];
        int size = metrics.Size();
        double sum = 0, count = 0, slow = 0;
        for (int i = 0; i < size; i++)
        {
            int value = metrics.Get(i);
            if (value != 0)
            {
                count += value;
                sum += i * value;
                if (i > 16)
                    slow += value;
                Console.WriteLine($"Frame(s) that took ~{i}ms, count: {value}");
            }
        }
        if (sum > 0)
        {
            Console.WriteLine($"Average frame time: {sum / count:0.00}ms");
            Console.WriteLine($"No. of slow frames: {slow}");
            Console.WriteLine("-----");
        }
        handler.PostDelayed(OnFrame, Duration);
    }

I added many more rows to the sample, and scrolled to the bottom on a
`Release` build of the app on a Pixel 5:

    Before:
    Frame(s) that took ~4ms, count: 1
    Frame(s) that took ~5ms, count: 6
    Frame(s) that took ~6ms, count: 10
    Frame(s) that took ~7ms, count: 12
    Frame(s) that took ~8ms, count: 10
    Frame(s) that took ~9ms, count: 6
    Frame(s) that took ~10ms, count: 1
    Frame(s) that took ~11ms, count: 2
    Frame(s) that took ~12ms, count: 4
    Frame(s) that took ~13ms, count: 2
    Frame(s) that took ~15ms, count: 1
    Frame(s) that took ~16ms, count: 1
    Frame(s) that took ~18ms, count: 2
    Frame(s) that took ~19ms, count: 1
    Frame(s) that took ~20ms, count: 5
    Frame(s) that took ~21ms, count: 2
    Frame(s) that took ~22ms, count: 1
    Frame(s) that took ~25ms, count: 1
    Frame(s) that took ~32ms, count: 1
    Frame(s) that took ~34ms, count: 1
    Frame(s) that took ~60ms, count: 1
    Frame(s) that took ~62ms, count: 1
    Frame(s) that took ~63ms, count: 1
    Frame(s) that took ~64ms, count: 2
    Frame(s) that took ~66ms, count: 1
    Frame(s) that took ~67ms, count: 1
    Frame(s) that took ~68ms, count: 1
    Frame(s) that took ~69ms, count: 2
    Frame(s) that took ~70ms, count: 2
    Frame(s) that took ~71ms, count: 2
    Frame(s) that took ~72ms, count: 1
    Frame(s) that took ~73ms, count: 2
    Frame(s) that took ~74ms, count: 2
    Frame(s) that took ~75ms, count: 1
    Frame(s) that took ~76ms, count: 1
    Frame(s) that took ~77ms, count: 2
    Frame(s) that took ~78ms, count: 3
    Frame(s) that took ~79ms, count: 1
    Frame(s) that took ~80ms, count: 1
    Frame(s) that took ~81ms, count: 1
    Average frame time: 28.67ms
    No. of slow frames: 43

    After:
    Frame(s) that took ~5ms, count: 3
    Frame(s) that took ~6ms, count: 5
    Frame(s) that took ~7ms, count: 7
    Frame(s) that took ~8ms, count: 7
    Frame(s) that took ~9ms, count: 4
    Frame(s) that took ~10ms, count: 2
    Frame(s) that took ~11ms, count: 6
    Frame(s) that took ~12ms, count: 2
    Frame(s) that took ~13ms, count: 3
    Frame(s) that took ~14ms, count: 4
    Frame(s) that took ~15ms, count: 1
    Frame(s) that took ~16ms, count: 1
    Frame(s) that took ~17ms, count: 1
    Frame(s) that took ~18ms, count: 2
    Frame(s) that took ~19ms, count: 1
    Frame(s) that took ~20ms, count: 3
    Frame(s) that took ~21ms, count: 2
    Frame(s) that took ~22ms, count: 2
    Frame(s) that took ~27ms, count: 2
    Frame(s) that took ~29ms, count: 2
    Frame(s) that took ~32ms, count: 1
    Frame(s) that took ~34ms, count: 1
    Frame(s) that took ~35ms, count: 1
    Frame(s) that took ~64ms, count: 1
    Frame(s) that took ~67ms, count: 1
    Frame(s) that took ~68ms, count: 2
    Frame(s) that took ~69ms, count: 1
    Frame(s) that took ~72ms, count: 3
    Frame(s) that took ~74ms, count: 3
    Average frame time: 21.99ms
    No. of slow frames: 29

A slow frame is defined as one that takes longer than 16ms (if you
drop below 60 fps). On a Pixel 5 device, this change went from 43 to
29 slow frames.

Note that the play button icon is not visible in the screenshot because
of a separate issue, see: dotnet#14239

I think there is enough improvement here to close dotnet#9485, but we can
always do more. This at least makes things a lot better for all
`View`'s on Android as well as other types of views like `Border` and
`Frame`.
#14275)

Fixes: #9485
Context: https://github.com/jsuarezruiz/netmaui-surfing-app-challenge
Context: https://developer.android.com/reference/androidx/core/app/FrameMetricsAggregator#getMetrics()
Context: https://medium.com/grindr-engineering/android-metrics-framerate-for-each-fragments-d311dbe909c1

Reviewing the "Surfing App" sample, I noticed that a lot of time is
spent doing Java interop when scrolling:

    1.76s (35%) Microsoft.Maui!Microsoft.Maui.Platform.WrapperView.DispatchDraw(Android.Graphics.Canvas)
    1.76s (35%) Microsoft.Maui!Microsoft.Maui.Platform.ContentViewGroup.DispatchDraw(Android.Graphics.Canvas)

This methods were deeply nested doing interop from Java -> C# -> Java
many levels deep. My thought is we can probably move some code from C#
to Java, in order to do a lot less interop while scrolling. I created
new `PlatformContentViewGroup` and `PlatformWrapperView` Java types
for this.

So to clarify, we go from:

* `ContentViewGroup`
    * `DispatchDraw(Canvas)` Java -> C#
    * `DispatchDraw(Canvas)` does a lookup for living C# instances of
      `Canvas`
* `ContentViewGroup`
    * `DispatchDraw(Canvas)` Java -> C# (only when `Clip` is set)
    * `GetClipPath(int, int)` has the width/height and no `Canvas`
* `WrapperView`
    * `ctor(Context)` makes several C# -> Java calls
    * `DispatchDraw(Canvas)` Java -> C#
    * `DrawShadow(Canvas)` makes several C# -> Java calls for width &
      height
    * `OnMeasure()` Java -> C#
* `WrapperView`
    * `ctor(Context)` does all the work in Java now
    * `DispatchDraw(Canvas)` Java -> C# (only when `Clip` or `Shadow` are set)
    * `GetClipPath(int, int)` has the width/height and no `Canvas`
    * `DrawShadow(Canvas, int, int)` passes in the width/height from Java
    * `OnMeasure()` stays completely in Java

So then, how do we measure if it is better/worse? I used the
`FrameMetricsAggregator` class we can add to any app's `MainActivity`:

    const int Duration = 1000;
    FrameMetricsAggregator aggregator;
    Handler handler;

    protected override void OnCreate(Bundle savedInstanceState)
    {
        base.OnCreate(savedInstanceState);

        handler = new Handler(Looper.MainLooper);
        aggregator = new FrameMetricsAggregator(FrameMetricsAggregator.TotalDuration);
        aggregator.Add(this);

        handler.PostDelayed(OnFrame, Duration);
    }

    void OnFrame()
    {
        var metrics = aggregator.GetMetrics()[FrameMetricsAggregator.TotalIndex];
        int size = metrics.Size();
        double sum = 0, count = 0, slow = 0;
        for (int i = 0; i < size; i++)
        {
            int value = metrics.Get(i);
            if (value != 0)
            {
                count += value;
                sum += i * value;
                if (i > 16)
                    slow += value;
                Console.WriteLine($"Frame(s) that took ~{i}ms, count: {value}");
            }
        }
        if (sum > 0)
        {
            Console.WriteLine($"Average frame time: {sum / count:0.00}ms");
            Console.WriteLine($"No. of slow frames: {slow}");
            Console.WriteLine("-----");
        }
        handler.PostDelayed(OnFrame, Duration);
    }

I added many more rows to the sample, and scrolled to the bottom on a
`Release` build of the app on a Pixel 5:

    Before:
    Frame(s) that took ~4ms, count: 1
    Frame(s) that took ~5ms, count: 6
    Frame(s) that took ~6ms, count: 10
    Frame(s) that took ~7ms, count: 12
    Frame(s) that took ~8ms, count: 10
    Frame(s) that took ~9ms, count: 6
    Frame(s) that took ~10ms, count: 1
    Frame(s) that took ~11ms, count: 2
    Frame(s) that took ~12ms, count: 4
    Frame(s) that took ~13ms, count: 2
    Frame(s) that took ~15ms, count: 1
    Frame(s) that took ~16ms, count: 1
    Frame(s) that took ~18ms, count: 2
    Frame(s) that took ~19ms, count: 1
    Frame(s) that took ~20ms, count: 5
    Frame(s) that took ~21ms, count: 2
    Frame(s) that took ~22ms, count: 1
    Frame(s) that took ~25ms, count: 1
    Frame(s) that took ~32ms, count: 1
    Frame(s) that took ~34ms, count: 1
    Frame(s) that took ~60ms, count: 1
    Frame(s) that took ~62ms, count: 1
    Frame(s) that took ~63ms, count: 1
    Frame(s) that took ~64ms, count: 2
    Frame(s) that took ~66ms, count: 1
    Frame(s) that took ~67ms, count: 1
    Frame(s) that took ~68ms, count: 1
    Frame(s) that took ~69ms, count: 2
    Frame(s) that took ~70ms, count: 2
    Frame(s) that took ~71ms, count: 2
    Frame(s) that took ~72ms, count: 1
    Frame(s) that took ~73ms, count: 2
    Frame(s) that took ~74ms, count: 2
    Frame(s) that took ~75ms, count: 1
    Frame(s) that took ~76ms, count: 1
    Frame(s) that took ~77ms, count: 2
    Frame(s) that took ~78ms, count: 3
    Frame(s) that took ~79ms, count: 1
    Frame(s) that took ~80ms, count: 1
    Frame(s) that took ~81ms, count: 1
    Average frame time: 28.67ms
    No. of slow frames: 43

    After:
    Frame(s) that took ~5ms, count: 3
    Frame(s) that took ~6ms, count: 5
    Frame(s) that took ~7ms, count: 7
    Frame(s) that took ~8ms, count: 7
    Frame(s) that took ~9ms, count: 4
    Frame(s) that took ~10ms, count: 2
    Frame(s) that took ~11ms, count: 6
    Frame(s) that took ~12ms, count: 2
    Frame(s) that took ~13ms, count: 3
    Frame(s) that took ~14ms, count: 4
    Frame(s) that took ~15ms, count: 1
    Frame(s) that took ~16ms, count: 1
    Frame(s) that took ~17ms, count: 1
    Frame(s) that took ~18ms, count: 2
    Frame(s) that took ~19ms, count: 1
    Frame(s) that took ~20ms, count: 3
    Frame(s) that took ~21ms, count: 2
    Frame(s) that took ~22ms, count: 2
    Frame(s) that took ~27ms, count: 2
    Frame(s) that took ~29ms, count: 2
    Frame(s) that took ~32ms, count: 1
    Frame(s) that took ~34ms, count: 1
    Frame(s) that took ~35ms, count: 1
    Frame(s) that took ~64ms, count: 1
    Frame(s) that took ~67ms, count: 1
    Frame(s) that took ~68ms, count: 2
    Frame(s) that took ~69ms, count: 1
    Frame(s) that took ~72ms, count: 3
    Frame(s) that took ~74ms, count: 3
    Average frame time: 21.99ms
    No. of slow frames: 29

A slow frame is defined as one that takes longer than 16ms (if you
drop below 60 fps). On a Pixel 5 device, this change went from 43 to
29 slow frames.

Note that the play button icon is not visible in the screenshot because
of a separate issue, see: #14239

I think there is enough improvement here to close #9485, but we can
always do more. This at least makes things a lot better for all
`View`'s on Android as well as other types of views like `Border` and
`Frame`.
Description
It is a list using CollectionView with elements using Border. It's a list of only 5 items, but there must be something wrong somewhere because it lags considerably.
Steps to Reproduce
Version with bug
6.0.486 (current)
Last version that worked well
Unknown/Other
Affected platforms
Android
Affected platform versions
Android 12 and 13
Did you find any workaround?
No response
Relevant log output
No response
The text was updated successfully, but these errors were encountered: