Memory Leaks
The purpose of this doc, is to be a guide on:
- Tooling to identify & diagnose leaks
- Understanding C# code patterns that cause memory leaks
- Techniques to fix leaks
We've tried to tag various PRs and Issues related to memory issues at:
The best way to understand memory usage is to take a "snapshot" of all C#
objects in memory at a given time. The dotnet-gcdump tool is one way
you can do this for programs running on the CoreCLR runtime.
You can also use Visual Studio while debugging via Debug > Windows >
Diagnostic Tools. On the Memory Usage tab, you can take snapshots:
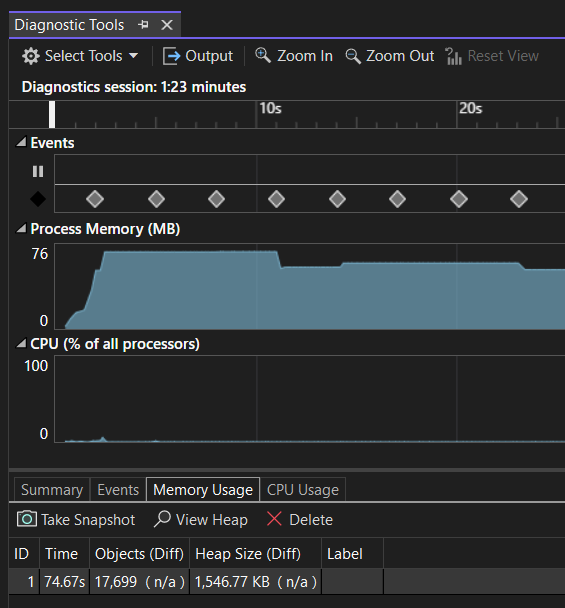
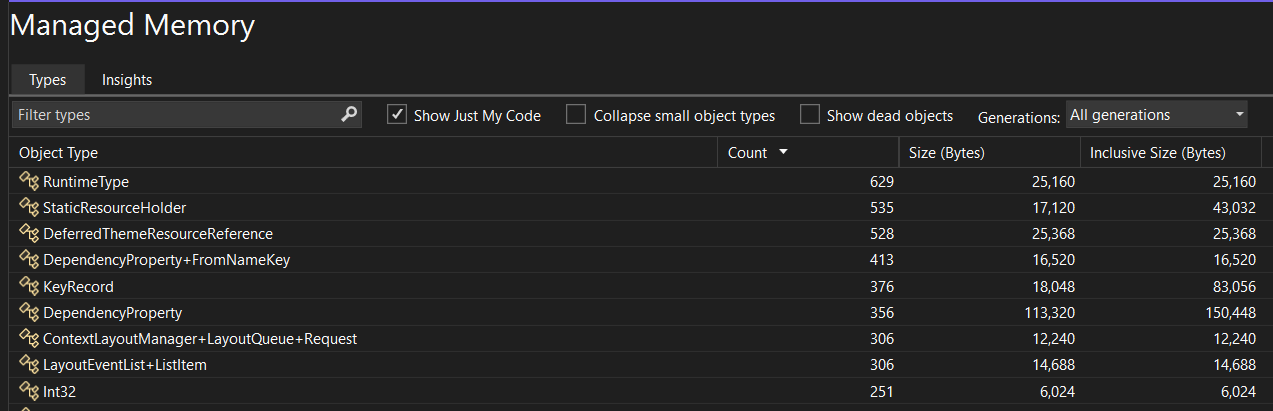
After taking a snapshot, you can open it to view every managed (C#) object in memory and inspect what objects hold references in a tree view:
This same view is available in Visual Studio when opening *.gcdump files
created by dotnet-gcdump or other tooling. *.gcdump files can also
be opened in PerfView, but as of writing there is no way to open
these files on non-Windows platforms.
Note Although taking memory snaphots while debugging can be quite convenient, you will need to disable XAML hot reload for them to be accurate. In recent versions of Visual Studio, the
Managed Memorywindow will display a warning if you forget this step.
Note You might also consider taking memory snapshots of
Releasebuilds, as code paths can be significantly different in configurations where XAML compilation, AOT compilation, and trimming are enabled.
Unfortunately, .NET MAUI apps running on Android, iOS, and macOS are running on
the Mono runtime, and so the same support isn't there quite yet.
dotnet-gcdump support for the Mono runtime is coming in a future
preview of .NET 8:
We are hopeful this will become much easier in the future. For now, we still
have a way to record *.gcdump files from the Mono runtime -- just in a much
less convenient manner.
To illustrate the process, let's look at how you can record *.gcdump files
from a .NET MAUI application running on macOS via Catalyst.
- Launch the app with
$DOTNET_DiagnosticPortsset:
$ DOTNET_DiagnosticPorts=~/my-dev-port,suspend ./bin/Debug/net7.0-maccatalyst/maccatalyst-x64/MyApp.app/Contents/MacOS/MyAppIn the output directory, macOS applications can be found in the *.app folder
(bundle). We can run the main binary directly with the $DOTNET_DiagnosticPorts
environment variable set in our terminal. The app will pause at this point,
waiting for an instance of dotnet-trace to connect to it.
- Launch
dotnet-tracewith a special "provider" in a different terminal window:
$ dotnet-trace collect --diagnostic-port ~/my-dev-port --providers Microsoft-DotNETRuntimeMonoProfiler:0xC900001:4This allows the app to fully launch, while dotnet-trace saves a *.nettrace
file containing object allocation information from the Mono runtime.
When trying to record a precise snapshot, I normally Ctrl+C dotnet-trace to
cancel the first recording. Then I navigate to the appropriate place in the app
where the problem occurs and start a fresh recording. Each time dotnet-trace
connects to the running app, it will create a fresh *.nettrace file with
current snapshot information.
- Convert the
*.nettracefile to a*.gcdumpfile we can open in Visual Studio.
There is a tool from Filip Navara we can use for this: mono-gcdump.
Clone the source code for this tool locally and build & run it:
dotnet run -- convert my-dev-port.nettraceThis should output a my-dev-port.gcdump file in the same directory the
*.nettrace file was located.
To attach dotnet-trace to a running app on iOS & Android, the
dotnet-dsrouter tool is used to connect to mobile devices. See
further information about using dotnet-trace and dotnet-dsrouter
together for specific platforms at:
The symptom of a memory leak in a .NET MAUI application, could be something like:
- Navigate from the landing page to a sub page
- Go back
- Navigate to the sub page again
- Memory grows consistently until the OS closes the application due to lack of memory
In the case of Android, you may see log messages such as:
07-07 18:51:39.090 17079 17079 D Mono : GC_MAJOR: (user request) time 137.21ms, stw 140.60ms los size: 10984K in use: 3434K
07-07 18:51:39.090 17079 17079 D Mono : GC_MAJOR_SWEEP: major size: 116192K in use: 108493K
07-07 18:51:39.092 17079 17079 I monodroid-gc: 46204 outstanding GREFs. Performing a full GC!
In this example, a 116MB heap is quite large for a mobile application, as well as over 46,000 C# objects that wrap Java objects (GREF).
To truly determine if the sub page is leaking, make a couple modifications to the app:
- Add logging in a finalizer. For example:
~MyPage() => Console.WriteLine("Finalizer for ~MyPage()");While navigating through your app, you can find out if entire pages are leaking:
living forever. This is a common symptom of a leak, because any View holds
.Parent.Parent.Parent, etc. all the way up to the Page object.
- Call
GC.Collect()somewhere in the app, such as the sub page's constructor:
public MyPage()
{
    GC.Collect(); // For debugging purposes only, remove later
    InitializeComponent();
}
This makes the GC more deterministic, in that we are forcing it to run more frequently. Each time we navigate to the sub page, we are more likely causing the old sub page's to go away. If things are working properly, we should see the log message from the finalizer.
Note
GC.Collect()is for debugging purposes only. You should not need this in your app after investigation is complete, so be sure to remove it afterward.
- With these changes in place, test a
Releasebuild of your app.
On iOS, Android, macOS, etc. you can watch console output of your app to
determine what is actually happening at runtime. adb logcat, for
example, is a way to view these logs on Android.
If running on Windows, you can also use Debug > Windows > Diagnostic Tools
inside Visual Studio to take memory snapshots as mentioned above.
Once you've determined a finalizer isn't running for a certain Page in your
.NET MAUI application, we can further narrow down what is wrong:
-
Comment out all the XAML, does the problem still occur?
-
Comment out all the C#, does the problem still occur?
-
Does the problem only happen on a certain platform?
Generally, navigating to an empty ContentPage, for example, should not leak.
Narrowing down the lines of code causing the problem might point us to which
control in .NET MAUI is the culprit -- or if there is an issue in your
application.
Take for example, the cross-platform Grid.ColumnDefinitions property:
public class Grid : Layout, IGridLayout
{
    public static readonly BindableProperty ColumnDefinitionsProperty = BindableProperty.Create("ColumnDefinitions",
        typeof(ColumnDefinitionCollection), typeof(Grid), null, validateValue: (bindable, value) => value != null,
        propertyChanged: UpdateSizeChangedHandlers, defaultValueCreator: bindable =>
        {
            var colDef = new ColumnDefinitionCollection();
            colDef.ItemSizeChanged += ((Grid)bindable).DefinitionsChanged;
            return colDef;
        });

    public ColumnDefinitionCollection ColumnDefinitions
    {
        get { return (ColumnDefinitionCollection)GetValue(ColumnDefinitionsProperty); }
        set { SetValue(ColumnDefinitionsProperty, value); }
}-
Gridhas a strong reference to itsColumnDefinitionCollectionvia theBindableProperty. -
ColumnDefinitionCollectionhas a strong reference toGrid
If you put a breakpoint on the line with ItemSizeChanged +=, you can see the
event has an EventHandler object where the Target is a strong reference back
to the Grid.
In some cases, circular references like this are completely OK. The .NET runtime(s)' garbage collectors know how to collect cycles of objects that point each other. When there is no "root" object holding them both, they can both go away.
The problem comes in with object lifetimes: what happens if the
ColumnDefinitionCollection lives for the life of the entire application?
Consider the following Style in Application.Resources or
Resources/Styles/Styles.xaml:
<Style TargetType="Grid" x:Key="GridStyleWithColumnDefinitions">
    <Setter Property="ColumnDefinitions" Value="18,*"/>
</Style>
If you applied this Style to a Grid on a random Page:
-
Application's mainResourceDictionaryholds theStyle. - The
Styleholds aColumnDefinitionCollection. - The
ColumnDefinitionCollectionholds theGrid. -
Gridunfortunately holds thePagevia.Parent.Parent.Parent, etc.
This situation could cause entire Page's to live forever!
Note The issue with
Gridis fixed in dotnet/maui#16145, but is an excellent example of illustrating how C# events can go wrong.
Note that the situation with C# events is not limited to just events, consider a
property that holds a Func<int>:
public Func<int>? GetValue { get; set; }

// Somewhere inside the class, the Func<int> is used
int x = GetValue?.Invoke() ?? 0;
Outside the class, a "parent" type might do:
public class Parent
{
    public Child TheChild { get; set; } = new Child();
    //...

// Somewhere in the class
TheChild.GetValue = OnGetValue;

// OnValue is defined as a member function of Parent:
private int OnGetValue() => 42;
Just as if this was a C# event, Child.GetValue will hold a Func<int> where
the Target points to the Parent. This situation is slightly less common than
a C# event, but we have the exact same result.
Even since the early days of Xamarin.iOS, there has existed an
issue with "circular references" even in a garbage-collected runtime like .NET.
C# objects co-exist with a reference-counted world on Apple platforms, and so a
C# object that subclasses NSObject can run into situations where they can
accidentally live forever -- a memory leak. Note that this situation does not
occur on Android or Windows platforms.
Take for example, the following circular reference:
class MyViewSubclass : UIView
{
    public UIView? Parent { get; set; }

    public void Add(MyViewSubclass subview)
    {
        subview.Parent = this;
        AddSubview(subview);
    }
}

//...

var parent = new MyViewSubclass();
var view = new MyViewSubclass();
parent.Add(view);
In this case:
-
parent->viewviaSubviews -
view->parentvia theParentproperty - The reference count of both objects is non-zero
- Both objects live forever
This problem isn't limited to a field or property, you can create similar situations with C# events:
class MyView : UIView
{
    public MyView()
    {
        var picker = new UIDatePicker();
        AddSubview(picker);
        picker.ValueChanged += OnValueChanged;
    }

    void OnValueChanged(object? sender, EventArgs e) { }

    // Use this instead and it doesn't leak!
    //static void OnValueChanged(object? sender, EventArgs e) { }
}
In this case:
-
MyView->UIDatePickerviaSubviews -
UIDatePicker->MyViewviaValueChangedandEventHandler.Target - Both objects live forever
A solution for this example, is to make OnValueChanged method static, which
would result in a null Target on the EventHandler instance.
Another solution, would be to put OnValueChanged in a non-NSObject subclass:
class MyView : UIView
{
    readonly Proxy _proxy = new();

    public MyView()
    {
        var picker = new UIDatePicker();
        AddSubview(picker);
        picker.ValueChanged += _proxy.OnValueChanged;
    }

    class Proxy
    {
        public void OnValueChanged(object? sender, EventArgs e) { }
    }
}
This is the pattern we've used in most .NET MAUI handlers and other UIView
subclasses.
See the MemoryLeaksOniOS sample repo, if you would like to play with some of these scenarios in isolation in an iOS application without .NET MAUI.
Considering the Grid.ColumnDefinition situation above:
var colDef = new ColumnDefinitionCollection();
colDef.ItemSizeChanged += ((Grid)bindable).DefinitionsChanged;
return colDef;
Since the ItemSizeChanged event is part of .NET MAUI, and the event is
non-virtual, we can use WeakEventManager:
readonly WeakEventManager _weakEventManager = new WeakEventManager();

public event EventHandler ItemSizeChanged
{
    add => _weakEventManager.AddEventHandler(value);
    remove => _weakEventManager.RemoveEventHandler(value);
}
To raise the event, we can call in the appropriate place:
_weakEventManager.HandleEvent(this, e, nameof(ItemSizeChanged));WeakEventManager holds each subscriber as a WeakReference.
A WeakReference is a special type that allows the subscriber to be collected
by the GC. You can access WeakReference.IsAlive or WeakReference.Target will
return null if the object is gone.
In the case of Grid.ColumnDefinition, .NET MAUI controls the implementation of
the event. But what if we don't? Take, for example, interfaces like
INotifyPropertyChanged, INotifyCollectionChanged, or ICommand, developers
can implement these interfaces themselves so there is no guarantee their events
will use WeakEventManager.
To solve this, .NET MAUI has an internal type named WeakEventProxy:
abstract class WeakEventProxy<TSource, TEventHandler>
    where TSource : class
    where TEventHandler : Delegate
{
    WeakReference<TSource>? _source;
    WeakReference<TEventHandler>? _handler;

    public bool TryGetSource([MaybeNullWhen(false)] out TSource source);

    public bool TryGetHandler([MaybeNullWhen(false)] out TEventHandler handler);

    public virtual void Subscribe(TSource source, TEventHandler handler);

    public virtual void Unsubscribe();
}
So, if we wanted to create a version of this for INotifyPropertyChanged:
class WeakNotifyCollectionChangedProxy : WeakEventProxy<INotifyCollectionChanged, NotifyCollectionChangedEventHandler>
{
    public override void Subscribe(INotifyCollectionChanged source, NotifyCollectionChangedEventHandler handler)
    {
        if (TryGetSource(out var s))
        {
            s.CollectionChanged -= OnCollectionChanged;
        }

        source.CollectionChanged += OnCollectionChanged;
        base.Subscribe(source, handler);
    }

    public override void Unsubscribe()
    {
        if (TryGetSource(out var s))
        {
            s.CollectionChanged -= OnCollectionChanged;
        }
        base.Unsubscribe();
    }

    void OnCollectionChanged(object? sender, NotifyCollectionChangedEventArgs e)
    {
        if (TryGetHandler(out var handler))
        {
            handler(sender, e);
        }
        else
        {
            Unsubscribe();
        }
    }
}
Then in the class that needs to subscribe, you would do:
// Member variables
WeakNotifyPropertyChangedProxy? _proxy = null;
PropertyChangedEventHandler? _propertyChanged;

// For subscribing
// Instead of: theChild.PropertyChanged += OnChildPropertyChanged;
_propertyChanged ??= OnChildPropertyChanged;
_proxy ??= new();
_proxy.Subscribe(theChild, _propertyChanged);

// For unsubscribing
// Instead of: theChild.PropertyChanged -= OnChildPropertyChanged;
_proxy?.Unsubscribe();

// Also unsubscribe in finalizer
~Parent() => _proxy?.Unsubscribe();
In this case:
-
Parentholds a reference to theChildthrough a regular property, field, etc. -
Parentholds a reference toPropertyChangedEventHandler; note the delegate itself could get collected otherwise! -
Childholds a reference to aWeakNotifyPropertyChangedProxyobject. -
If the
Parentis GC'd, its finalizer will unsubscribe. Otherwise we would just leak aWeakNotifyPropertyChangedProxyinstance instead!
With all this machinery, it is quite tricky to get right. I recommend writing two unit tests: one to check the leak, and one to check the event still fires after a GC. (see below for details on tests)
This is also just one solution for now. We might have a different option in the future, such as the proposal:
If we fix a leak in .NET MAUI, what prevents someone from coming along and introducing a new one? This is a tough problem to solve, but for now we can at least write a unit test for individual situations. This way we can catch a regression, if something leaks in a similar way in the future.
In the case of Grid.ColumnDefinition above, we could write a test such as:
[Fact]
public async Task ColumnDefinitionDoesNotLeak()
{
    // Long-lived column, like from a Style in App.Resources
    var column = new ColumnDefinition();
    WeakReference reference;

    {
        var grid = new Grid();
        grid.ColumnDefinitions.Add(column);
        reference = new(grid);
    }

    await Task.Yield();
    GC.Collect();
    GC.WaitForPendingFinalizers();

    Assert.False(reference.IsAlive, "Grid should not be alive!");
}
Here we use WeakReference to merely determine if Grid leaks or not. We use a
scope, { }, so the grid local can no longer be accessed after the closing brace.
At this point, we want to force the GC to run in a deterministic way -- but the GC is explicitly not deterministic... Through trial and error, I've found a way to run the GC in a unit test that seems to work well on .NET 6+:
-
await Task.Yield()- a simple way to get the second half of the test on a different thread. -
GC.Collect()- runs the GC, but it's not 100% what it decides actually clean up. -
GC.WaitForPendingFinalizers(), waits on any finalizers. It's possible we could remove this call and the test still pass.
Then the last assertion should actually pass if the Grid is indeed gone:
Assert.False(reference.IsAlive, "Grid should not be alive!");In the Xamarin days, we had to do more complicated gymnastics to write a test like this. Take for example xamarin/java.interop@220b87f, which required a deeply nested call stack to ensure the GC would run.
If you are writing a "device test", a good pattern to follow is something like:
[Theory("Handler Does Not Leak")]
[InlineData(typeof(Entry))]
[InlineData(typeof(Image))]
[InlineData(typeof(Label))]
public async Task HandlerDoesNotLeak(Type type)
{
    SetupBuilder();

    WeakReference viewReference = null;
    WeakReference platformViewReference = null;
    WeakReference handlerReference = null;

    await InvokeOnMainThreadAsync(() =>
    {
        var layout = new Grid();
        var view = (View)Activator.CreateInstance(type);
        layout.Add(view);
        var handler = CreateHandler<LayoutHandler>(layout);
        viewReference = new WeakReference(view);
        handlerReference = new WeakReference(view.Handler);
        platformViewReference = new WeakReference(view.Handler.PlatformView);
    });

    await AssertionExtensions.WaitForGC(viewReference, handlerReference, platformViewReference);
    Assert.False(viewReference.IsAlive, $"{type} should not be alive!");
    Assert.False(handlerReference.IsAlive, "Handler should not be alive!");
    Assert.False(platformViewReference.IsAlive, "PlatformView should not be alive!");
}
AssertionExtensions.WaitForGC() calls GC.Collect() in a way that has been
found reliable on all platforms. If WeakReference.IsAlive is true afterward,
the test has found a real memory leak.
For future changes to .NET MAUI, you might consider simply adding more
[InlineData] to this test -- or use it as a starting point for a new test.