#Monitoring
##Introduction Monitoring Web Application allows management of servers. The application includes several systems, as :
- Projects
- Controllers
- Alarms
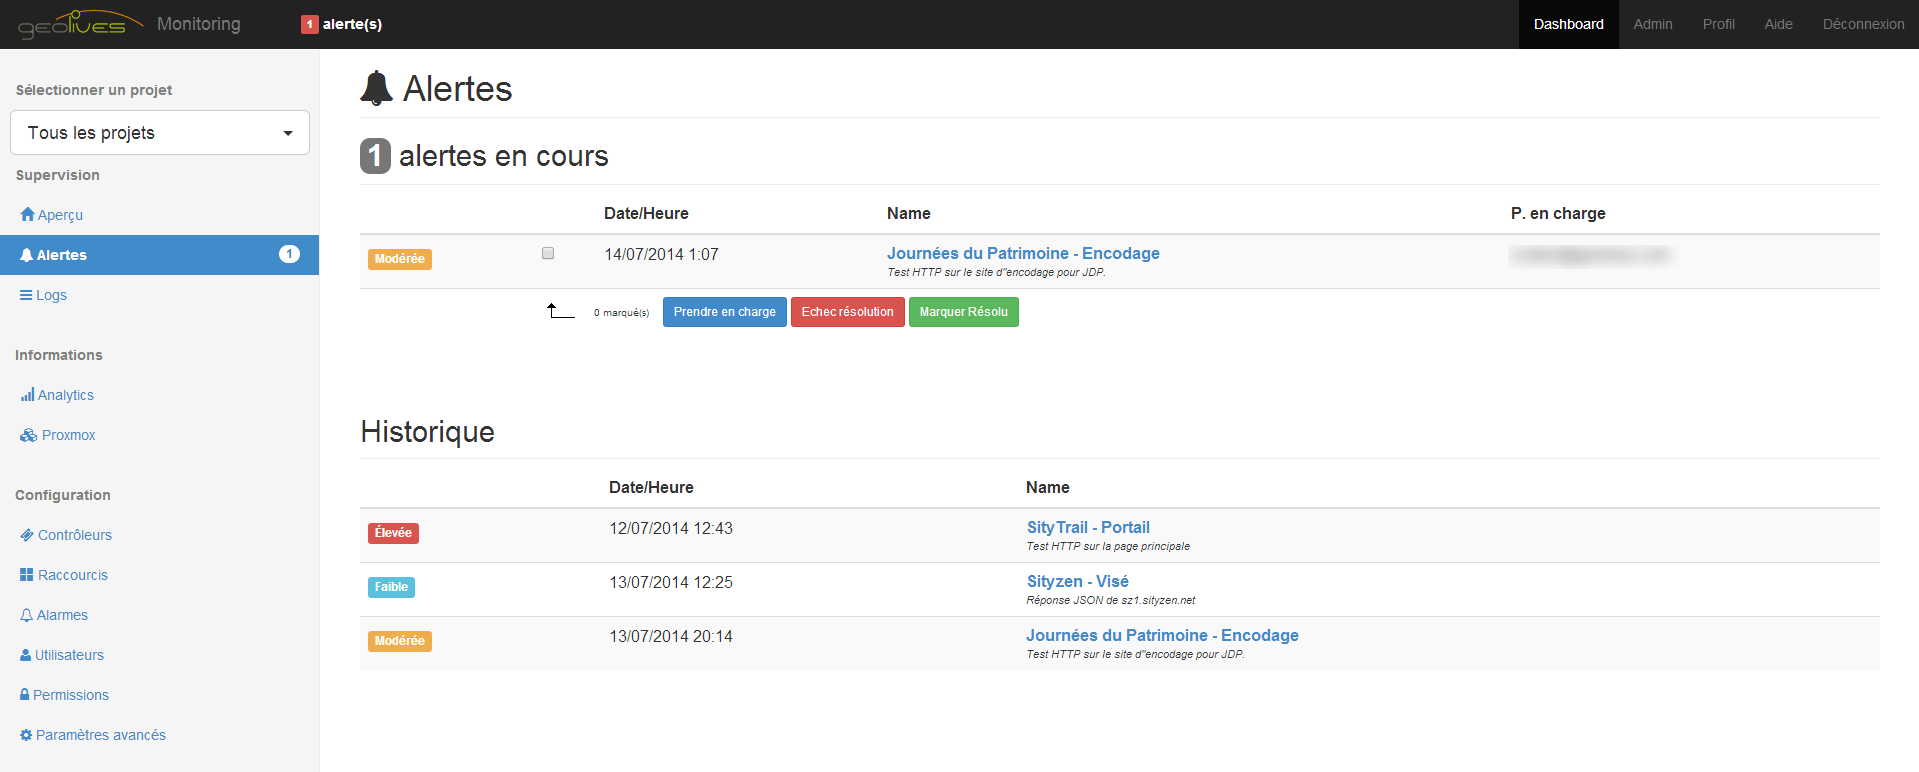
- Alerts
- Logs
- Shorcuts
- Users, Permissions, Roles
- Administration
- Daemon Checking Process
###Projects Many systems must be monitored? You can split them into several projects and allow users to manage some projects with a great system of roles and permissions.
###Controllers A controller is a control the application does every X minutes. It's defining something to control. If the control fails as describing in the Control Type, an alert is triggered, by using an alarm definition.
A controller can control with different cases :
- Status code of HTTP request
- Result set of a database query
- Body Answer of HTTP request
- ...
The Control Types are managed by a mechanism of plugins, so adding new Control Types is simple. Want to check the presence of a process inside UNIX ? Code it and let's rock.
###Alarms An alarm is the definition of what a controller must do when it fails. A controller is attached to an alarm. When a controller fails, the controller uses the alarm to trigger an alert. An alarm can define many things like the gravity of the failure and if the system must send an email or a SMS on trigger.
###Alerts An alert is the core part of what the Monitoring system do. An alert is created by a controller when it fails. They are shown in the Dashboard Overview and in the top navigation bar. An alert can be seen by all members of a project. When a user want handle the alert, he can mark the alert as "Taken in charge".
###Logs Great logging mechanism with stacktrace, allowing you to find specifically what is the problem in your infrastructure. Logs are shown in the Logs part of the web application. Logs are used in alert descriptions to help to solve your problems.
###Shorcuts Shortcuts are used to simplify complex actions that are redundant in your infrastructure, like restart two services because of a piece of software in the second service that needs the second service to be restarted. Actions are based of a mechanism of plugins, so adding new Actions is simple. As for Control Types, code it and let's rock. Shortcuts are very dangerous if wrongly used. For instance restart containers without checking what happening could be dangerous. So use it carrefully!
###Users, Permissions, Roles Users are grouped in roles with permissions splitted by projects. Administrator and Super-Adminitrator could move users and edit roles to belong to your infrastructure and human resources.
###Daemon Checking Process The crucial and core part of the Monitoring System is how it handle controls. A daemon process is launched and hosted as a service. When launched, the daemon process splits into 3 daemon child process that will check the controllers as defined in the Controller tab. Each child process is always checking for the health of others daemon childs, as the control process never end. If the database is not available, the processes will trigger an alert and will send themselves SMS and mails to Super-Administrator users.
##Install
- Dependencies: PHP5, SQL database, Cron.
- Tested on Unix Platform Debian.
- Only in French for the moment.
- Still in development.
- Easy-Intall feature not available for the moment.
Just put the complete GitHub project on your server in /var/www/ then browse to see the install page. Follow the instructions to install greatfully the Monitoring system.