


Create reports that visualizes geographic crimes to be able to gather informed decisions for law enforcement.
Crime data spans from 2001 to near present. Data is capture from Chicago Police department knowne as the CLEAR(Citizen Law Enforcement Analysis and Reporting) system. The data contains incidents to their blocks and crimes. This exploration is not just about numbers; it's a narrative of resilience and response, painted with the broad strokes of community engagement and the fine lines of detailed analysis. While the Chicago Police Department makes every effort to ensure the reliability of this data, the complexities of crime reporting mean that absolute accuracy and timeliness are aspirational goals.This presentation aims to provide a data-driven narrative on public safety in Chicago. We will delve into this dataset, publicly available under the terms provided by the City of Chicago and offered 'AS IS' by Google, to uncover patterns, understand trends, and offer insights into the complex domain of urban crime and safety. For more information visit: Chicago Crime
This project is designed for use by law enforcement professionals and individuals with an interest in crime data. Its primary objective is to increase awareness of criminal activities and to pinpoint crime hotspots. By providing detailed insights into crime trends and locations, the project aims to support proactive measures and informed decision-making in crime prevention and safety enhancement. This specifically highlights hotspots. For a quick EXCEL snapshot: click here.
- SQL Code
- Excel Data
- Tableau Dashboard
- R code - Geospatial Analysis
- PowerPoint

        SELECT *
        FROM `bigquery-public-data.chicago_crime.crime`
        WHERE year >= EXTRACT(YEAR FROM CURRENT_DATE()) - 5;
Copy the above SQL code snippet to query data from the last 5 years.
Click on image to link
Click on image to link
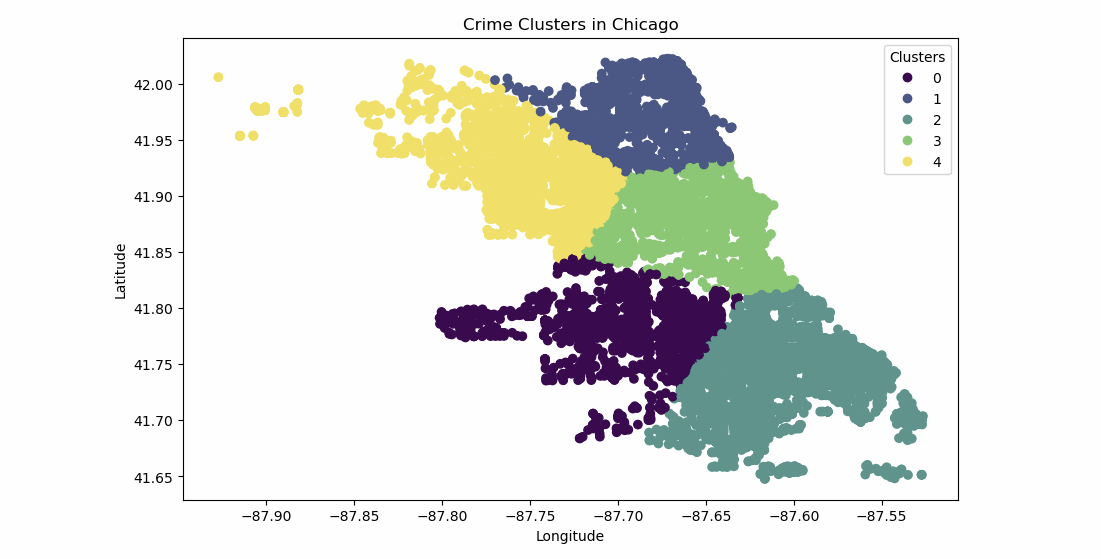
- Cluster 0: This is one group or 'cluster' of crime incidents as identified by the K-means algorithm. All points in this cluster are more similar to each other (in terms of their geographical location - latitude and longitude) than they are to points in other clusters.
- Cluster 1: This represents a different group of crime incidents, again grouped based on their proximity to each other.
- Clusters 2, 3, and 4: Similarly, these labels represent additional groups of crime incidents.
The goal of this clustering is to identify 'hotspots' of crime in Chicago based on geographical data. Each cluster represents a geographical area where crimes have occurred with higher density compared to other areas. By examining these clusters, you can gain insights into which areas require more attention or resources for crime prevention and law enforcement.
Click on image to link
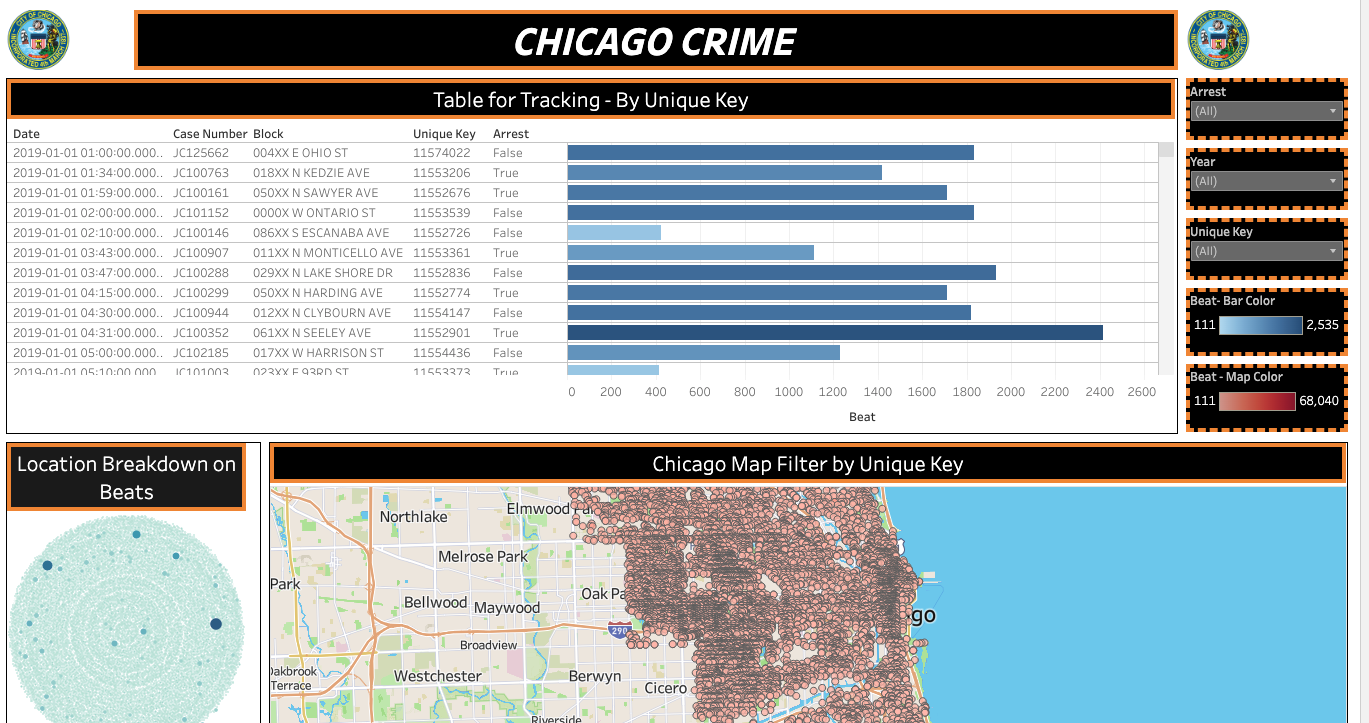
Visualizations: The goal is to craft compelling narratives for stakeholders.
My analysis of Chicago's 2022-2023 crime data spotlighted the top five crimes, showcasing my capability to simplify complex datasets into clear, actionable insights. This work not only brought to light prevalent crime trends, such as deceptive practices, but also employed sophisticated techniques like K-means clustering in Python for a comprehensive analysis of crime across a wider scope. This effort demonstrates my technical prowess, innovative problem-solving approach, and strategic thinking in crime prevention and safety.
I realized that real-time data is ever more necessary for sharing real-time results. Database is updated by the Chicago I.T. department, however, to solve real-case issues and helping law enforcments need to have acess to real time data. As data becomes more accessible for people through various mediums and networks then it is ever more important to have scanners for online crimes and fradualant crimes. Cybersecuirty will be more important than ever. I did use Python and R code to request retrievals for infromation that highlights important crime in the community and so from a geographical perspective this is a good lead for others to be aware about prevailing crimes. I learned in addition that databases needs more security since a lot of imformation can be immediately downloaded from online social media platforms that leave essentially footprints. In terms of the reports, I could have enhanced by connecting to API's(Live connected data). On the other hand, I learned important tasks for data manipulation and documentating progress. I was able to display work using html that can make it easier for others to replicate my work. I've come to realize the increasing necessity of real-time data for sharing immediate results. The database, maintained by the Chicago I.T. department, is crucial for addressing real-world issues and assisting law enforcement by providing access to up-to-the-minute data. As data becomes more accessible to the public via various platforms and networks, the importance of scanning for online and fraudulent crimes escalates. Consequently, cybersecurity is becoming more critical than ever before.
In summary, I've learned that enhancing database security is imperative, as vast amounts of information can be easily extracted from online social media platforms, leaving digital traces. Regarding my reports, they could have been improved by integrating APIs for live data connections. However, this experience has been instrumental in honing my skills in data manipulation and documenting progress.
Utilizing a free online database from Google BigQuery presented certain challenges, as some data had been pre-processed and sensitive information like actual names and full street addresses were omitted for security reasons. Ideally, in real-world scenarios, data should not be manipulated before conducting analysis and documenting specific alterations. Consequently, this report serves more as a conceptual demonstration rather than an exact representation of reality.
Moreover, dealing with real-world data is inherently more complex, requiring initial data engineering or scraping through frontend scripts to access comprehensive online information, including that from law enforcement databases. In essence, although this report was successful in creating a mock-up scenario, it highlights the significant gap between simulated environments and the intricacies of handling authentic datasets.