This notebook provides links and explanation for a handful or interesting use cases around Diagnostics with Dynatrace to identify hotspots in database access as well as hotspots in distributed traces.
Target Audience: Software & Performance Engineers, Architects, SREs
Got questions or feedback?: devrel@dynatrace.com
Problem Statement: A common performance problem are requests that either make a lot of database roundtrips or execute database queries that take a very long time.
How Dynatrace helps: Dynatrace makes it easy to find those traces so you can easily identify on whether to optimize your code to execute queries more efficient or talk with the database team to optimize those queries on the database engine.
Steps
- Open the Distributed Traces App
- Add and sort by database columns

- Use filter to find outliers top contributors

- Analyze the traces
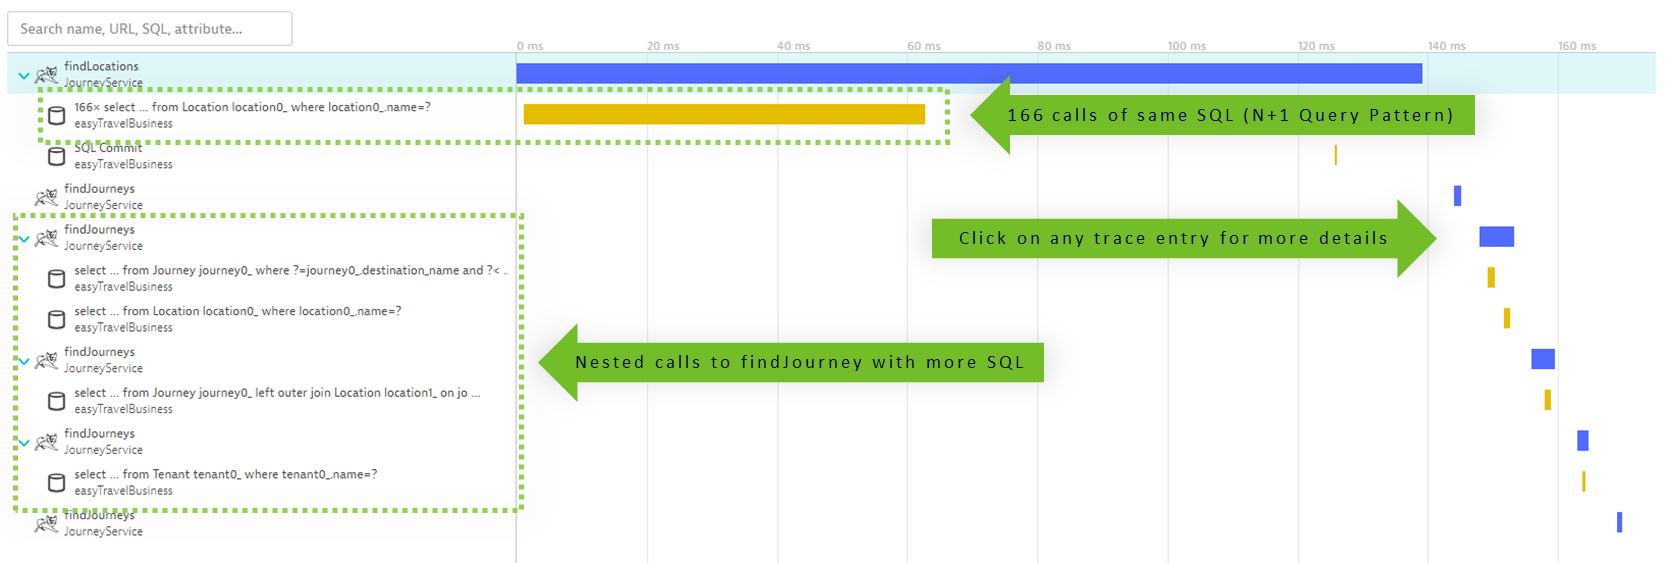
Problem Statement: Database performance problems can either be caused by inefficient queries or because services are making too many inefficient calls.
How Dynatrace helps: Dynatrace identifies the top inefficient queries and inefficient query patterns (N+1 Query, too much data queried, ...). Dynatrace does this by analyzing distributed traces (captured through OneAgent or ingested through OpenTelemetry). This makes it easy to optimize the queries or the code that executes queries inefficiently!
Steps:
- Open the Database App
- Click Top database statements to analyze across all databases
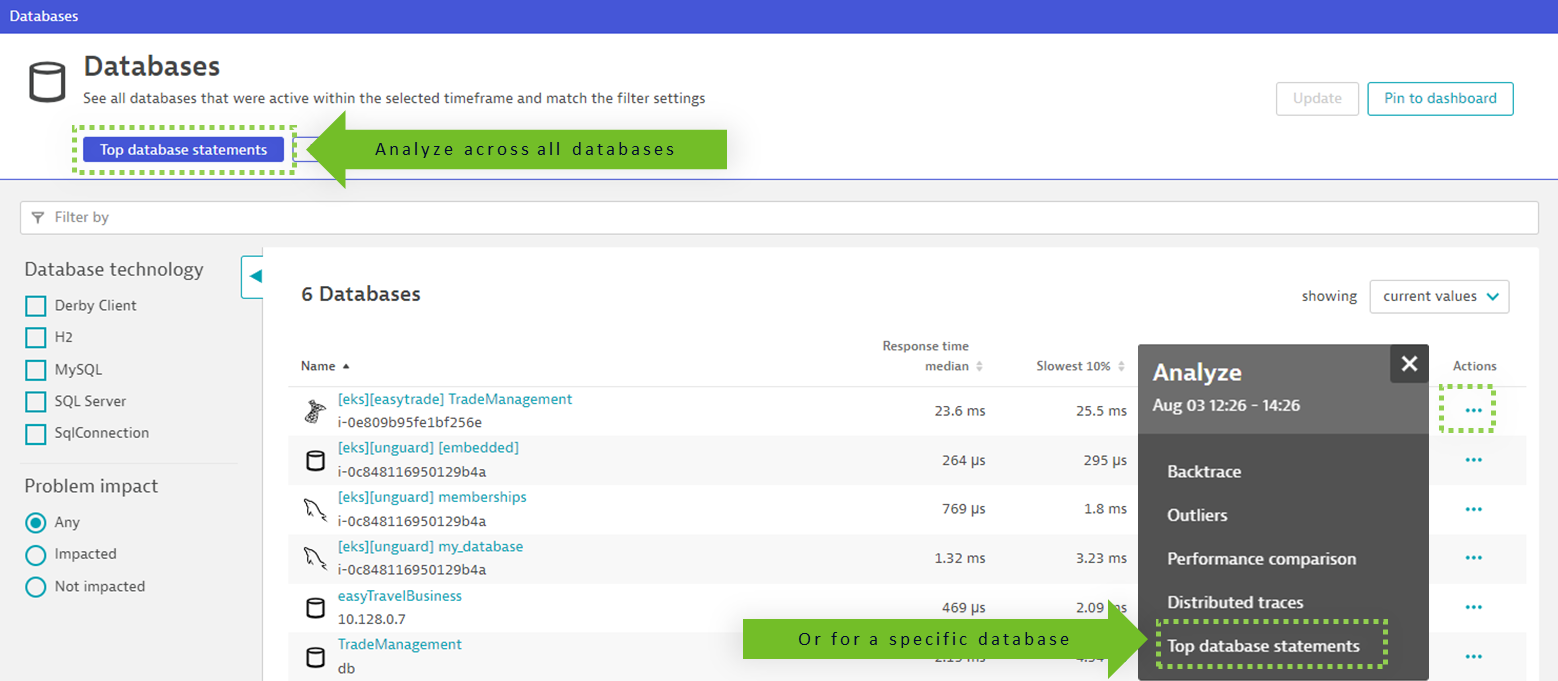
- Analyze by call frequency, response time, fetch count or errors!
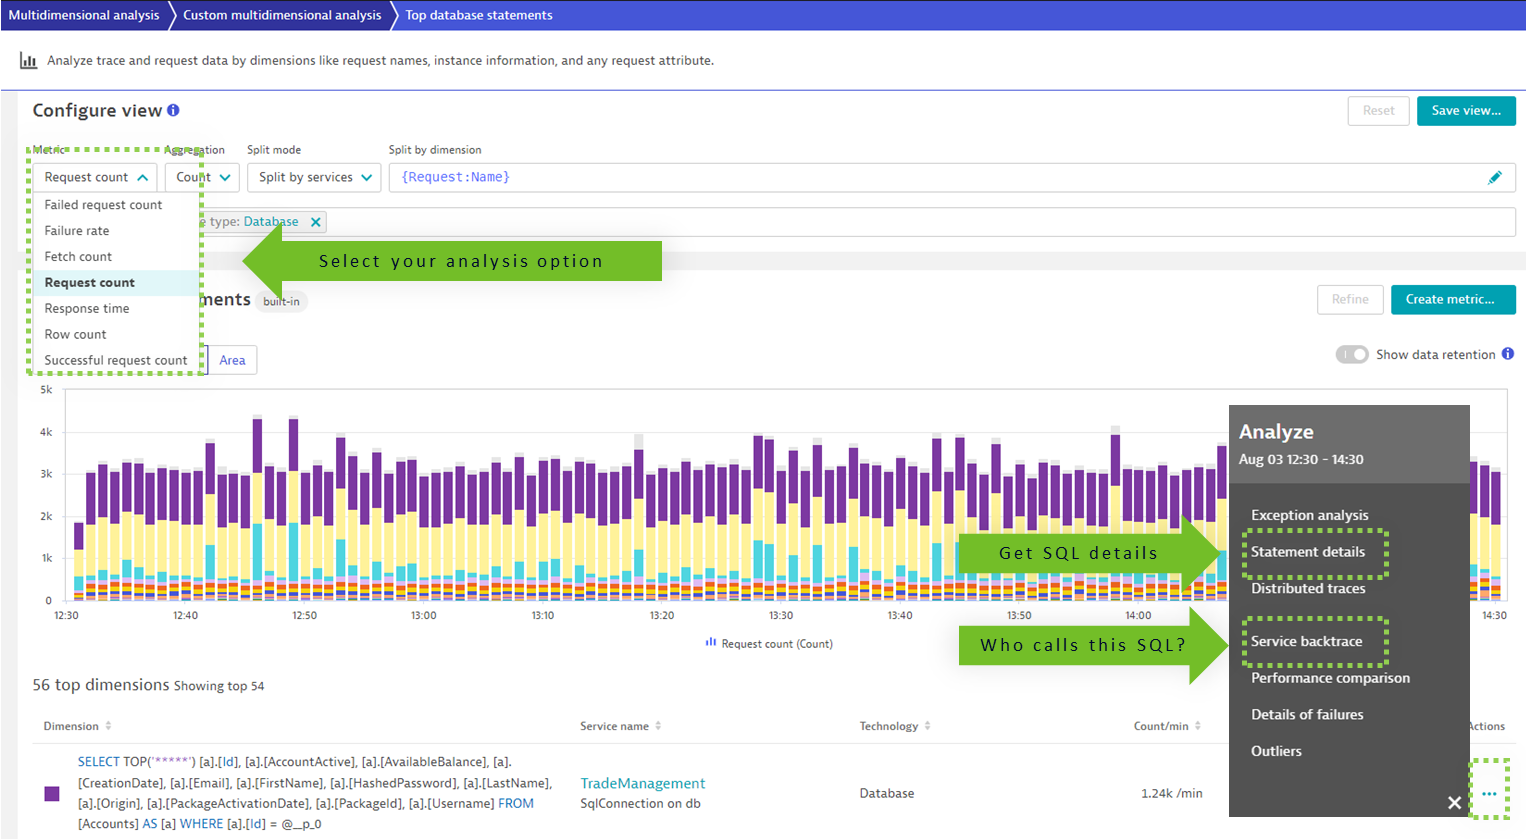
- Open the backtrace to identify where those calls come from!
