This repository contains supporting material for the episode What is Dynatrace and How to get started!
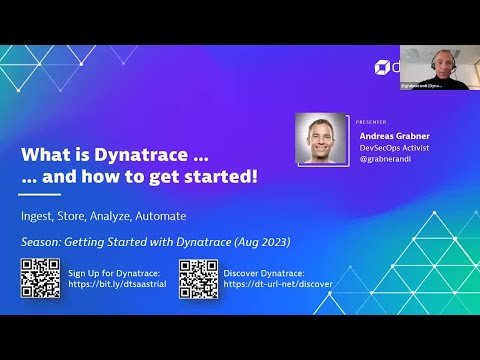
Table of Contents:
- Step 1: Get your own Dynatrace Trial
- Step 2: Discover Dynatrace Playground Tenant
- Step 3: Ingest Data into your own Tenant
- Step 4: Analyze your Data
- Step 5: Integrate and Automate based on your data
- Step 6: Extend Dynatrace with an Extension or App
If you have questions or feedback:
- Create an issue on this GitHub Repository if you found an issue with the tutorial:
- Ask the Dynatrace community on https://community.dynatrace.com
- For everything else: devrel@dynatrace.com
Sign up for a new Dynatrace trial: https://bit.ly/dtsaastrial
Every Dynatrace Trial user has access to a special Discover Dynatrace (Playground) Tenant that allows you to explore Dynatrace and all our use cases and capabilities. The Playground tenant is observing several applications running on k8s clusters.
Some shared read-only Dynatraced Dashboards I've uploaded for you:
- (Live Dashboard) Getting Started Dashboard
- (Live Dashboard) K8s Cluster Overview
- (Live Dashboard) K8s Namespace Overview
- (Live Dashboard) EasyTrade Dashboard
- (Live Dashboard) How to get Ownership Overview
And some read only Dynatrace Notebooks to play around with (more to come):
I also added some Hands-On Tutorial Notebooks with Step-by-Step instructions:
- (Live Tutorial Notebook) How to do Distributed Trace and Database Diagnostics
- (Live Tutorial Notebook) How to Anlayze Infrastructure with Dynatrace
- (Live Tutorial Notebook) How to Analyze Kubernetes Clusters and Workloads with Dynatrace
- (Live Tutorial Notebook) How to Analyze Synthetic Tests with Dynatrace
- (Live Tutorial Notebook) How to work with Davis-detected Problems
- (Live Tutorial Notebook) How to do Application Security with Dynatrace
- (Live Tutorial Notebook) How to analyze logs relevant to me
I added new Notebooks for my The Observability Guide to Platform Engineering Series:
- (Live Tutorial Notebook) How to make your K8s Platform Observable
- (Live Tutorial Notebook) How to analyze DORA Metrics with Dynatrace
- (Live Tutorial Notebook) How to enable Release Observability with Dynatrace
- (Live Tutorial Notebook) How to define Ownership in Dynatrace
Also make sure to explore the following Dynatrace Apps and Use Cases:
- (App) Davis Detected Problems explore the power of automated root cause detection
- Kubernetes (App) Clusters & (App) Workloads
- Understand your (App) SLOs (Service Level Objectives)
- (App) A service running in a K8s workload
- (App) Application Security Overview, (App) Vulnerabilities and (App) Attacks
- Diagnose and analyze (App) distributed traces
- Explore your (App) logs in a Notebook
- Understand (App) Real End Users Performance and analyze indvidual users through (App) Session Replay
- Monitor your SLAs and functionality through (App) Dynatrace Synthetics
- Build custom (App) Dashboards, (App) Notebooks to analyze your logs, metrics, events, traces ...
- Automate and Integrate through Data & Event Driven (App) Dynatrace Workflows
- ... and more
In your own tenant simply follow the steps to data into Dynatrace. The most popular options are
- Deploy the Dynatrace OneAgent on VMs, Kubernetes, OpenShift or CloudFoundry
- Ingest OpenTelemetry, Prometheus(https://www.dynatrace.com/support/help/extend-dynatrace/extend-metrics/ingestion-methods/prometheus) or external logs
- Monitor your Cloud Platforms such as AWS, Google Cloud Platform, Azure or Heroku
- Enable 600+ extensions such as SNMP, WMI, JMX, SQL and many more through the Dynatrace Hub
Like we did on the Playground Tenant - start exploring your data by opening the respective Dynatrace App for your Use Case.
You can also follow my Hands-On Tutorial Notebooks on the Discover Dynatrace Tenant:
- (Live Tutorial Notebooks) How to do Distributed Trace and Database Diagnostics
- (Live Tutorial Notebooks) How to Anlayze Infrastructure with Dynatrace
- (Live Tutorial Notebooks) How to Analyze Kubernetes Clusters and Workloads with Dynatrace
- (Live Tutorial Notebook) How to Analyze Synthetic Tests with Dynatrace
- (Live Tutorial Notebook) How to work with Davis-detected Problems
- (Live Tutorial Notebook) How to do Application Security with Dynatrace
- (Live Tutorial Notebook) How to analyze logs relevant to me
- (Live Tutorial Notebook) How to make your K8s Platform Observable
- (Live Tutorial Notebook) How to analyze DORA Metrics with Dynatrace
- (Live Tutorial Notebook) How to enable Release Observability with Dynatrace
- (Live Tutorial Notebook) How to define Ownership in Dynatrace
If you dont have access to the Discover Dynatrace Tenant then check them out in these readme's:
- (Readme) How to do Distributed Trace and Database Diagnostics
- (Readme) How to Anlayze Infrastructure with Dynatrace
- (Readme) How to Analyze Kubernetes Clusters and Workloads with Dynatrace
- (Readme) How to Analyze Synthethic Tests with Dynatrace
- (Readme) How to work with Davis-detected Problems
- (Readme) How to do Application Security with Dynatrace
- (Readme) How to Analyze Logs relevant for me
- (Readme) How to make your K8s Platform Observable
- (Readme) How to analyze DORA with Dynatrace
- (Readme) How to enable Release Observability with Dynatrace
- (Readme) How to define Ownership in Dynatrace
Start by building workflows to connect Dynatrace with your tool ecosystem.
The Playground Tenant has some Workflows setup to showcase automated release validation with the (App) Site Reliability Guardian
In your own tenant feel free to explore all the capabilities of Dynatrace Workflows. To learn more about Workflows check out:
Learn more about building your own Dynatrace App based on AppEngine on the Dynatrace Developer Portal
Also explore the (App) Dynatrace Hub with apps that are already available
To learn more go to: