- 1712766 - Nguyễn Chí Thanh
- 18120606 - Trần Thị Trang
- 18120609 - Hồ Khắc Minh Trí
- 18120634 - Nguyễn Lê Anh Tuấn
Build and analyze data about car accidents in the UK over 3-4 years
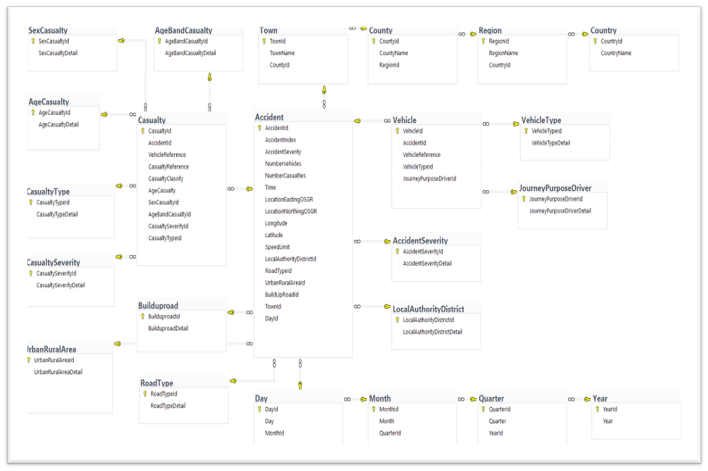
- Data Description: Describe meaning of the properties of the following data sources (only describe the properties necessary for the project):
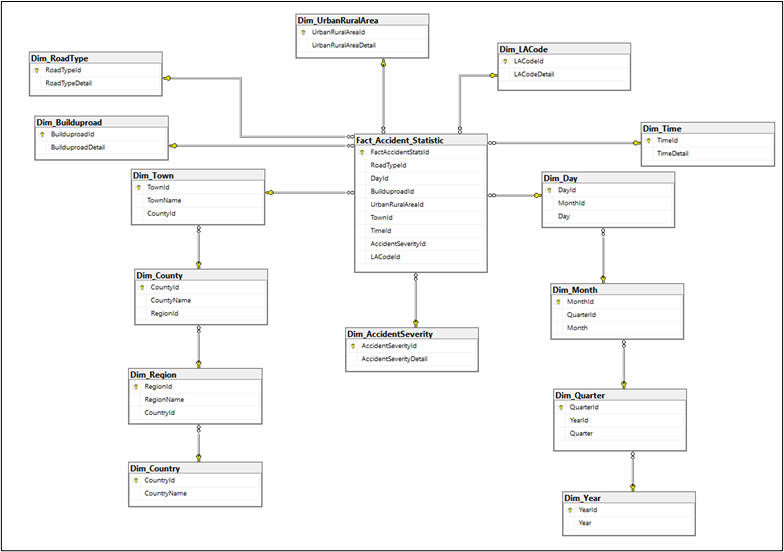
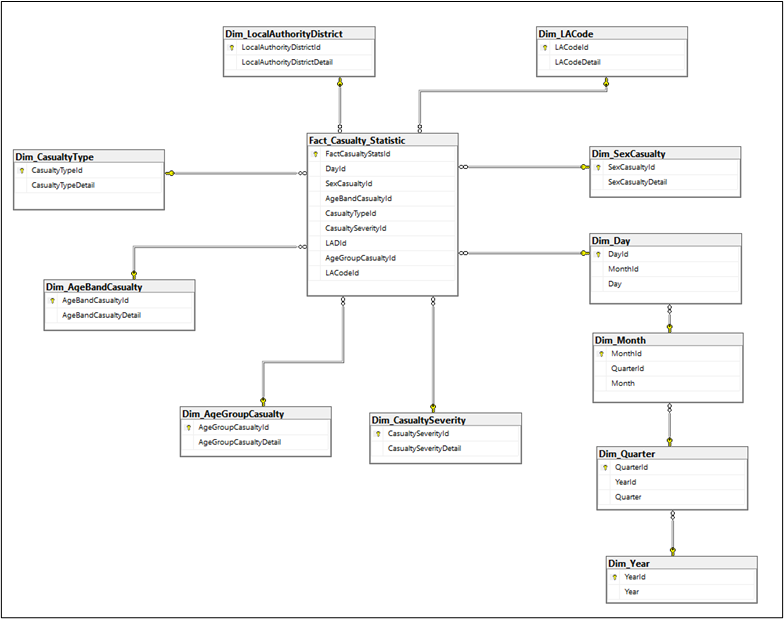
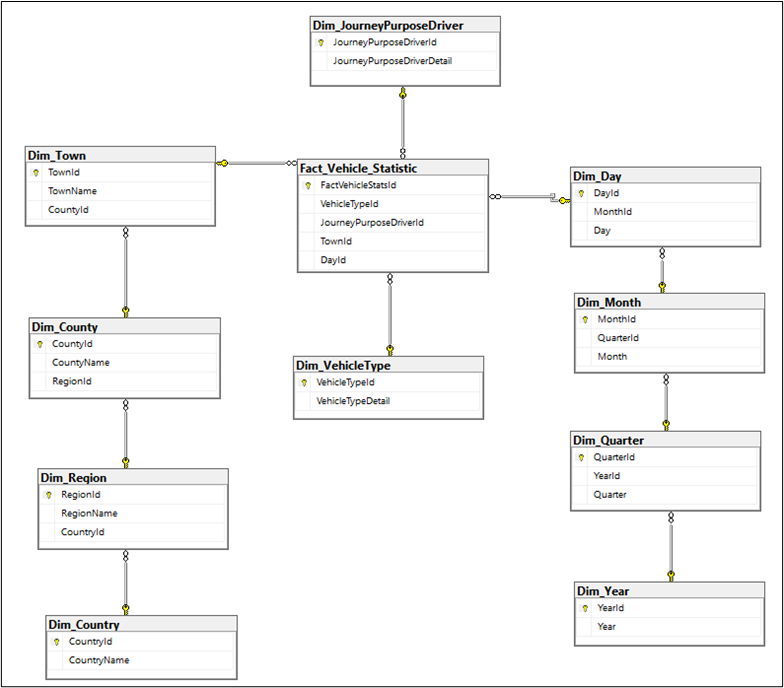
- Design data warehouse (DW), synthesize, load data from the sources into DW,
then design and build Cube: Suggestions.
- For England and Wales: map the above data sources to get the values for building Geography dimension with dimensional hierarchy as follows: Country > Region > County > Town City.
- For Scotland and North Ireland, students need to suggest solutions to create values for Geography dimension.
- Transform the datetime data to create the Date dimension with dimensional hierarchy: Year > Quarter > Month > Day.
- Define and design other dimensional hierarchies to meet OLAP and Report requirements.
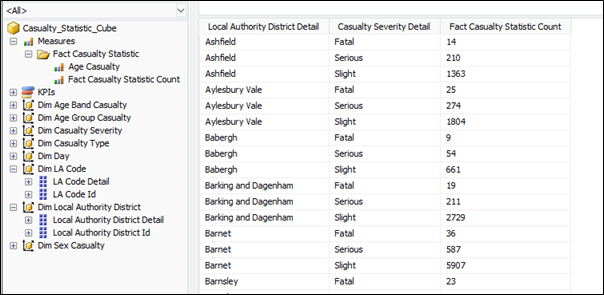
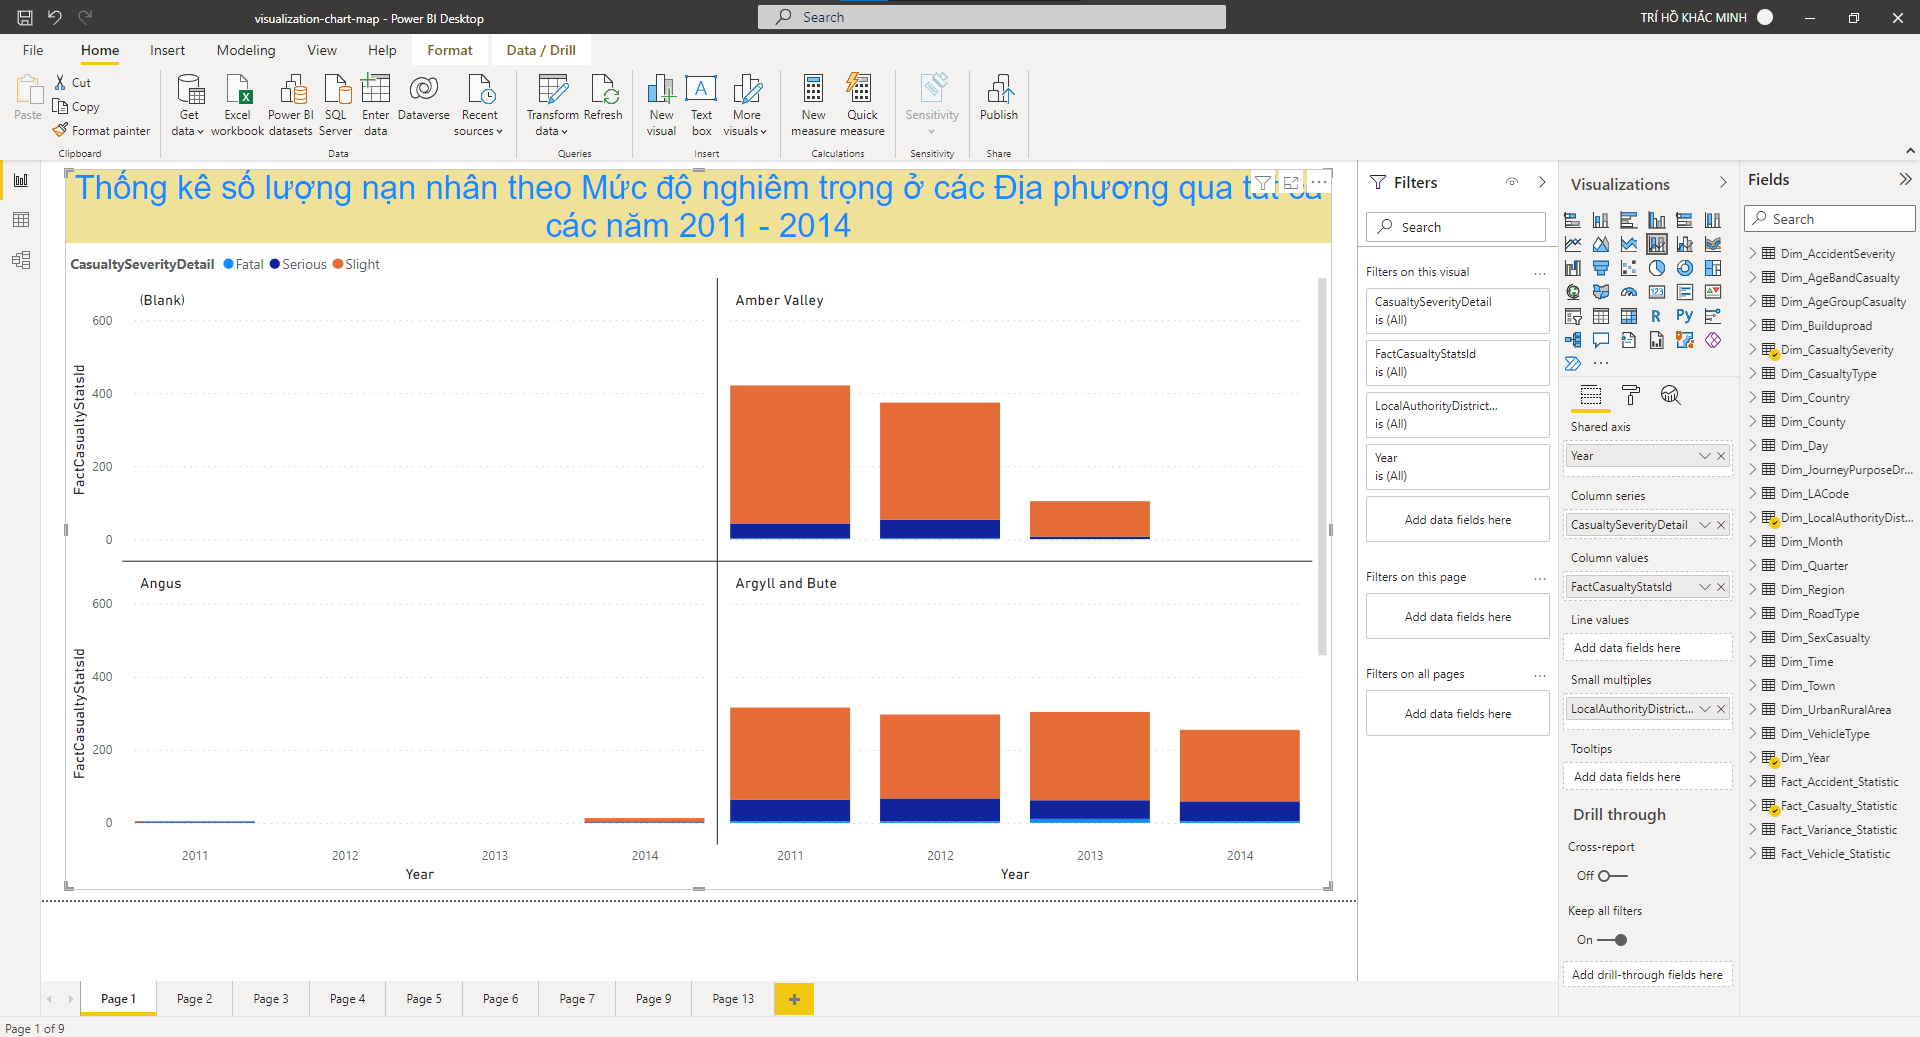
- Report the number of calsulities by Severity (Fatal, Serious, Slight) in the Local Authority Districts over years.
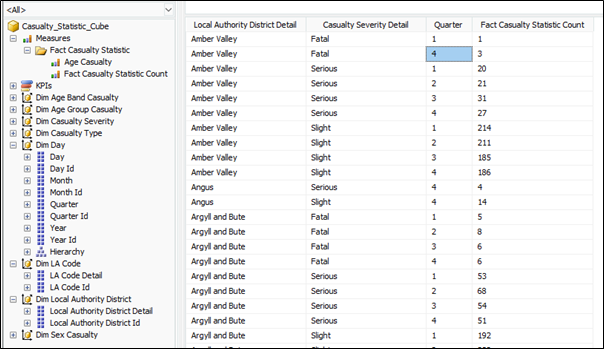
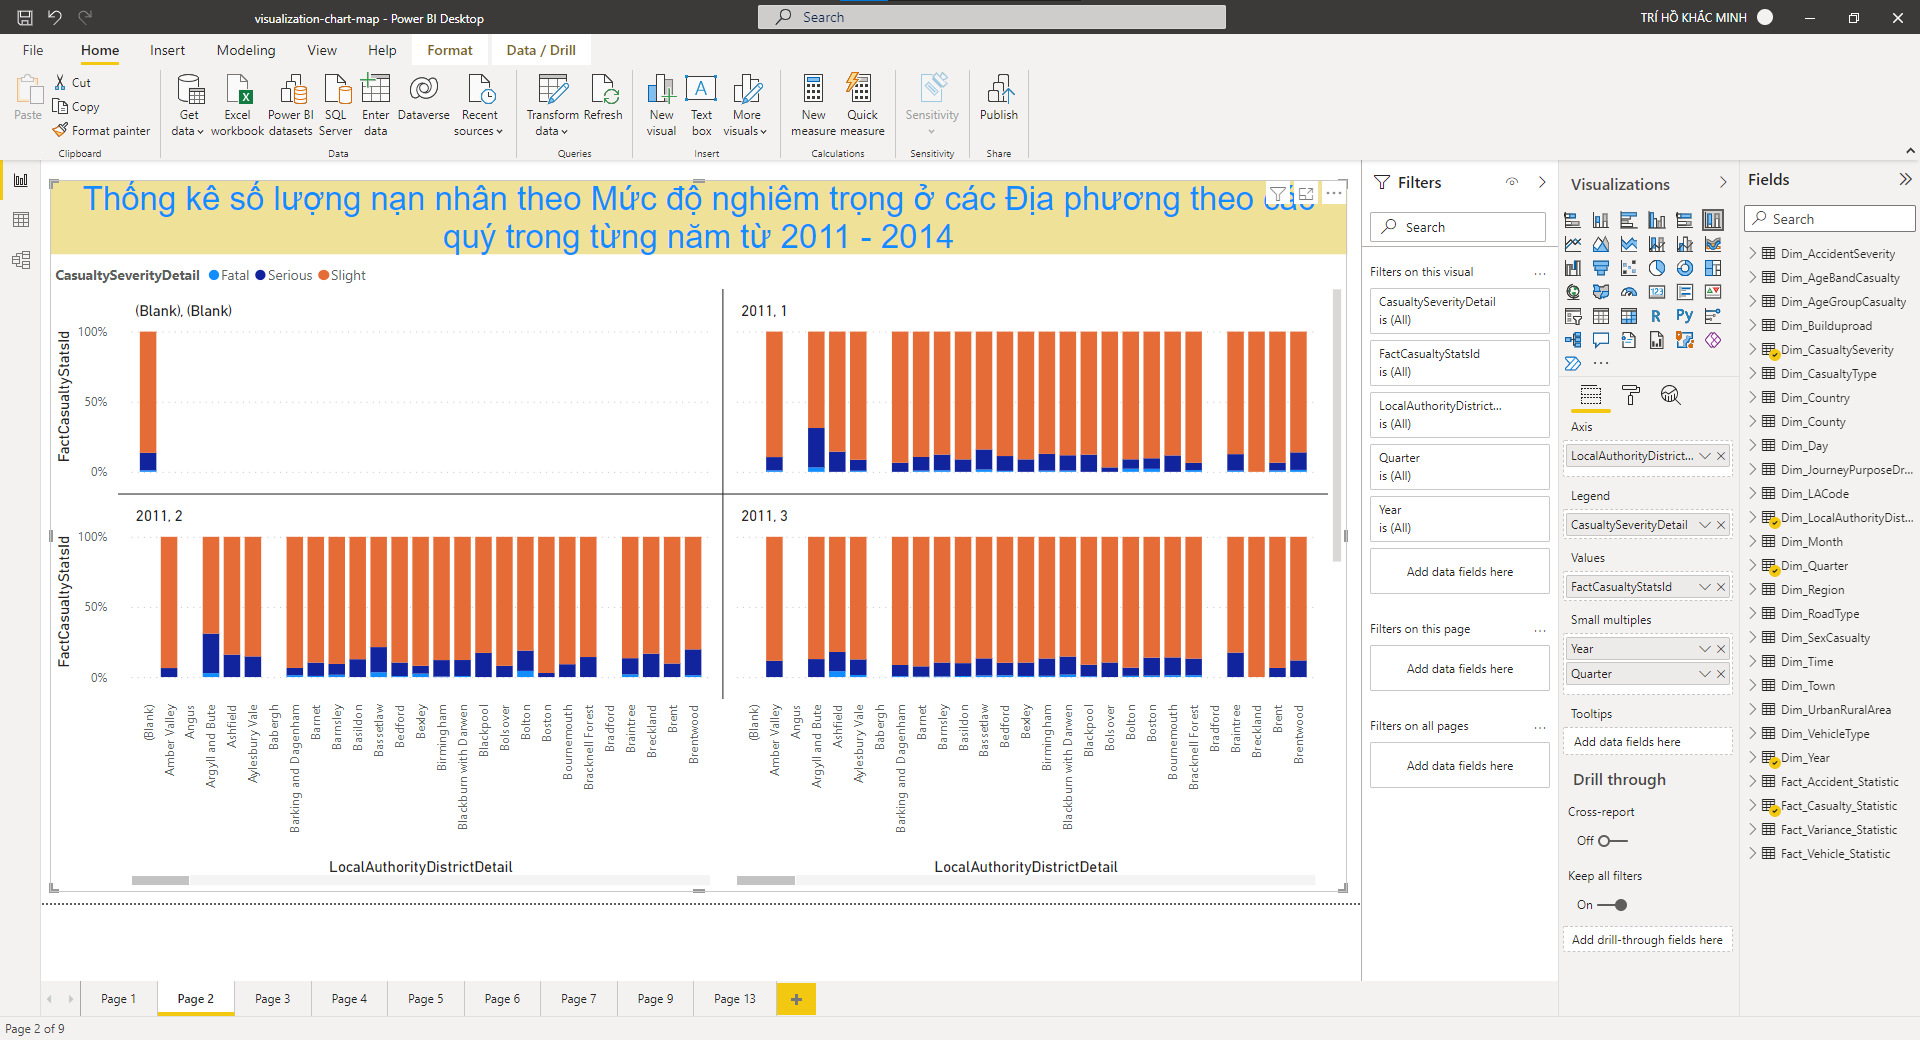
- Report the number of calsulities by Severity (Fatal, Serious, Slight) in the Local Authority Districts by Quarters in years.
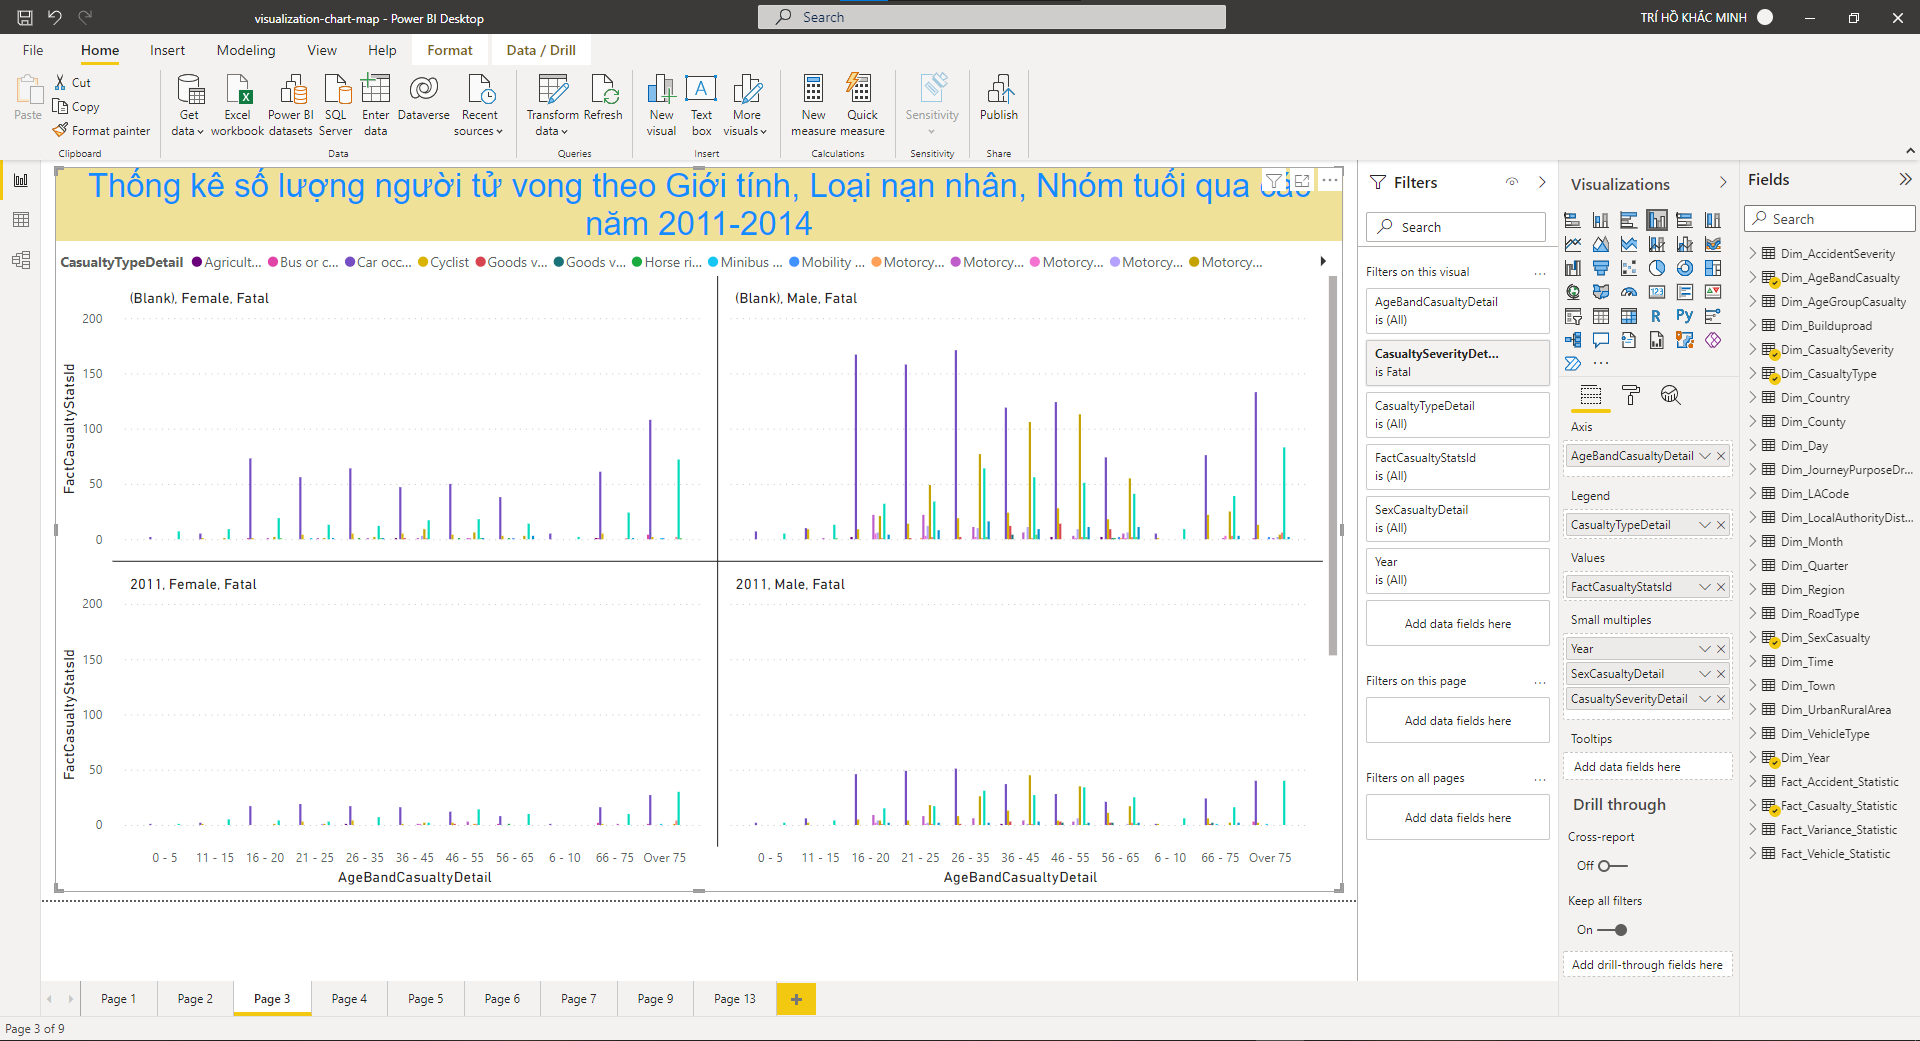
- Report the number of faltal calsulities by Gender, Casualty Type and Age Band over years.
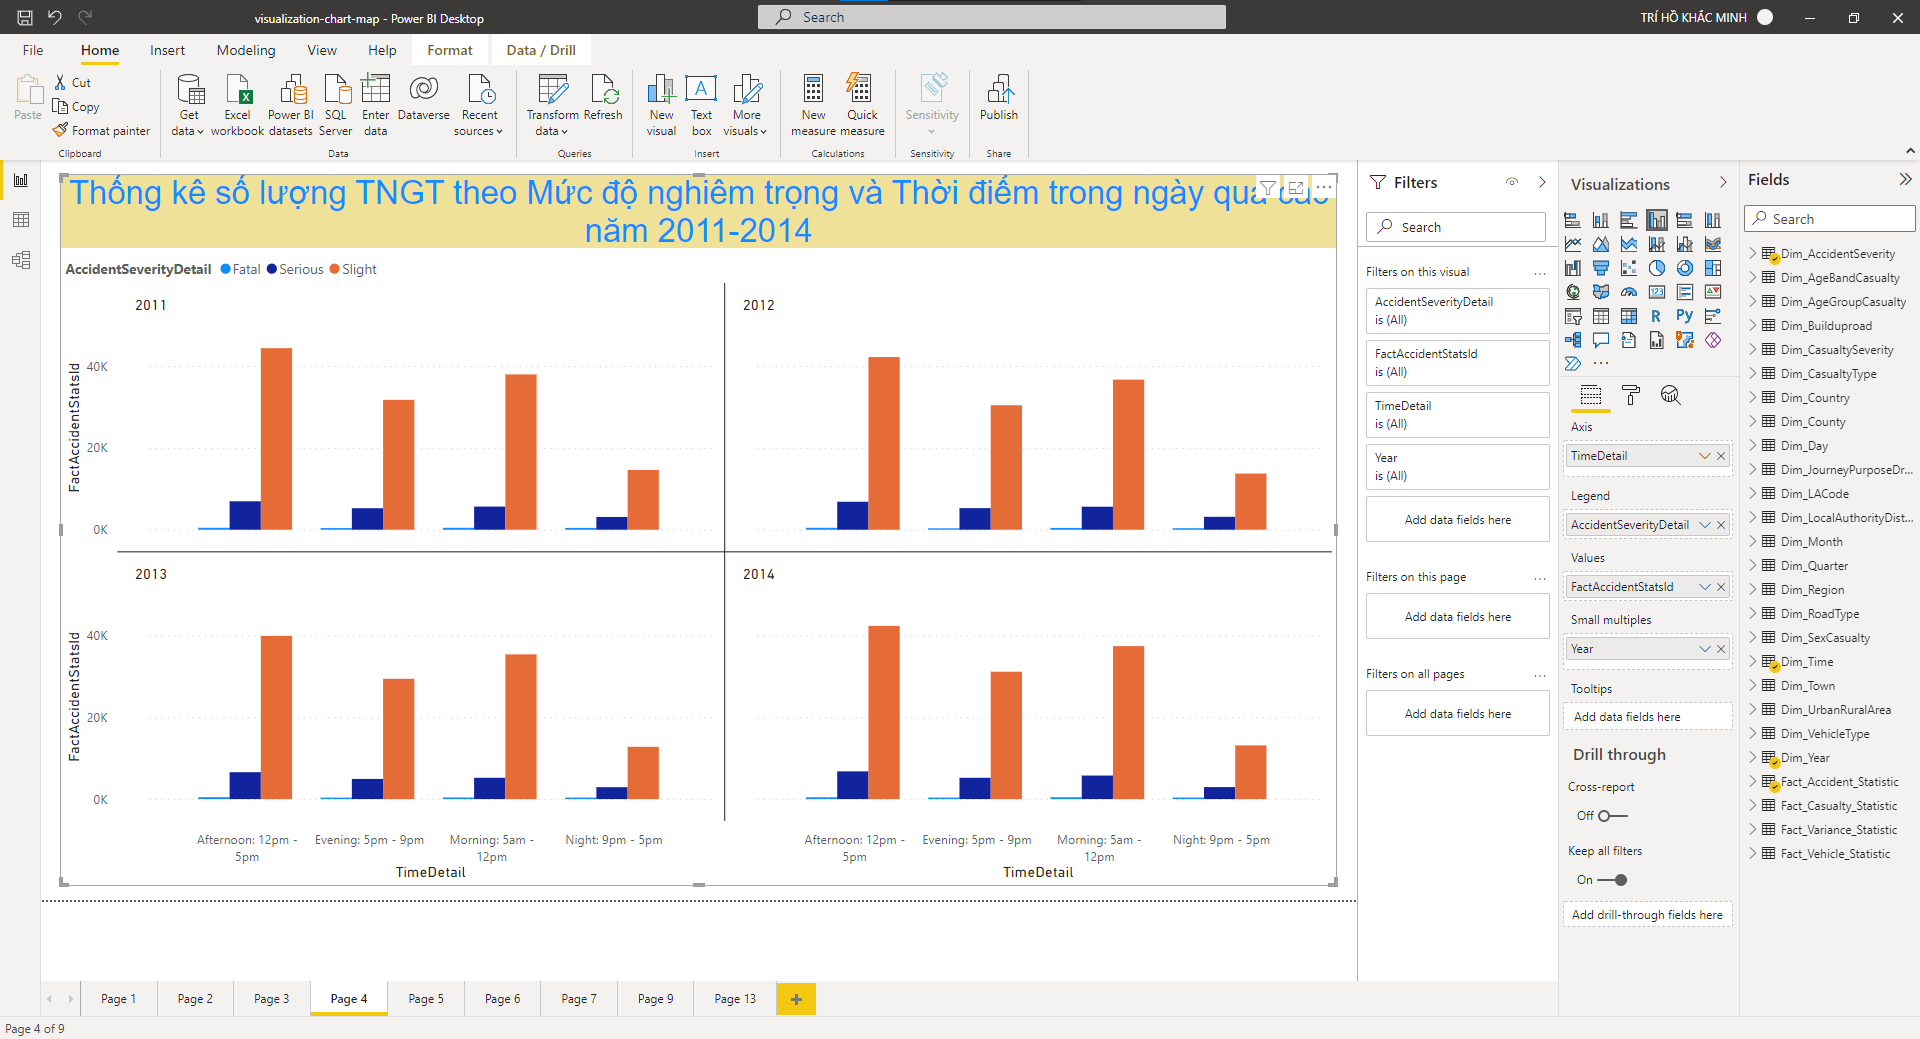
- Report the number of accidents by Severity and Time of Day (Morning: 5am-12pm, Afternoon: 12pm-5pm, Evening: 5pm-9pm, Night: 9pm-5am) over years.
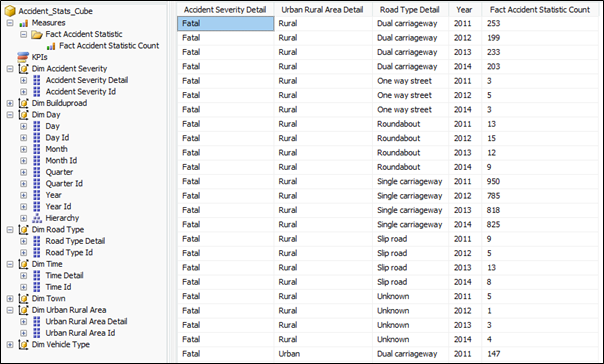
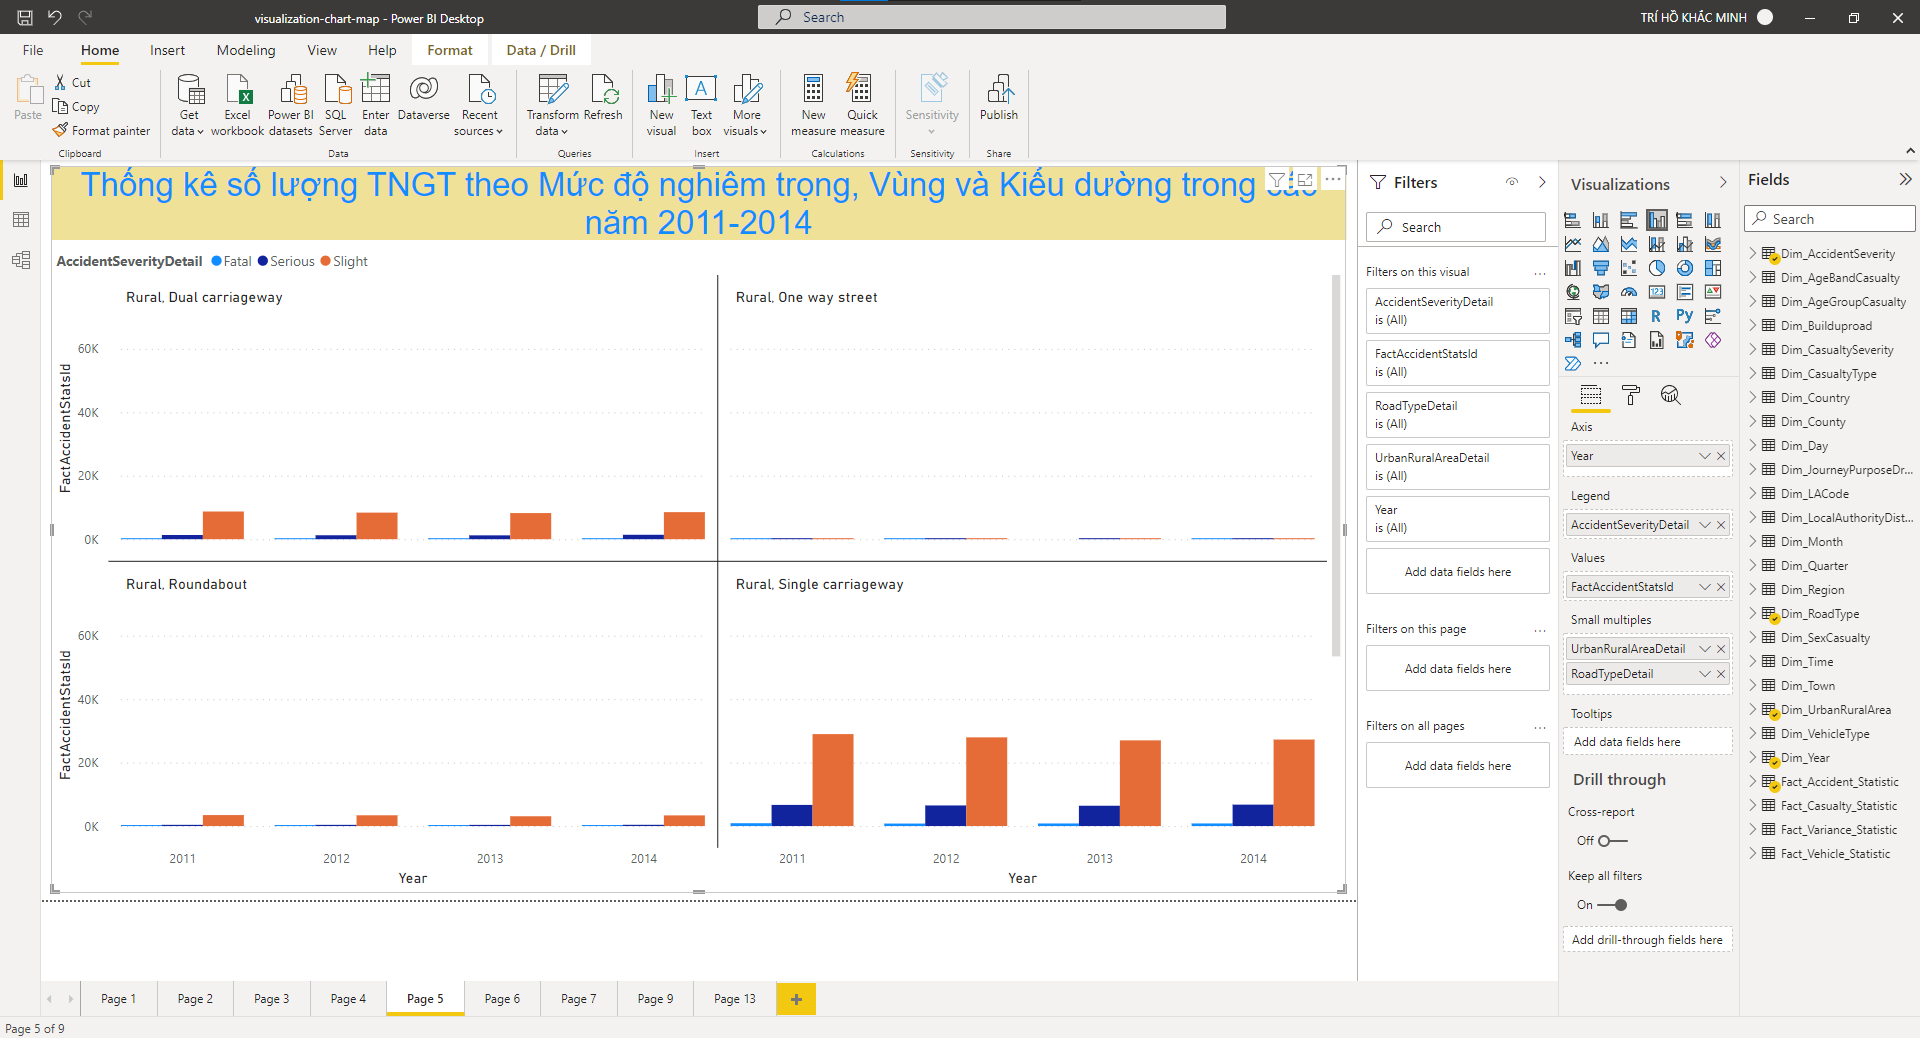
- Report the number of accidents by Severity, Urban or Rural Area and Road Type over years.
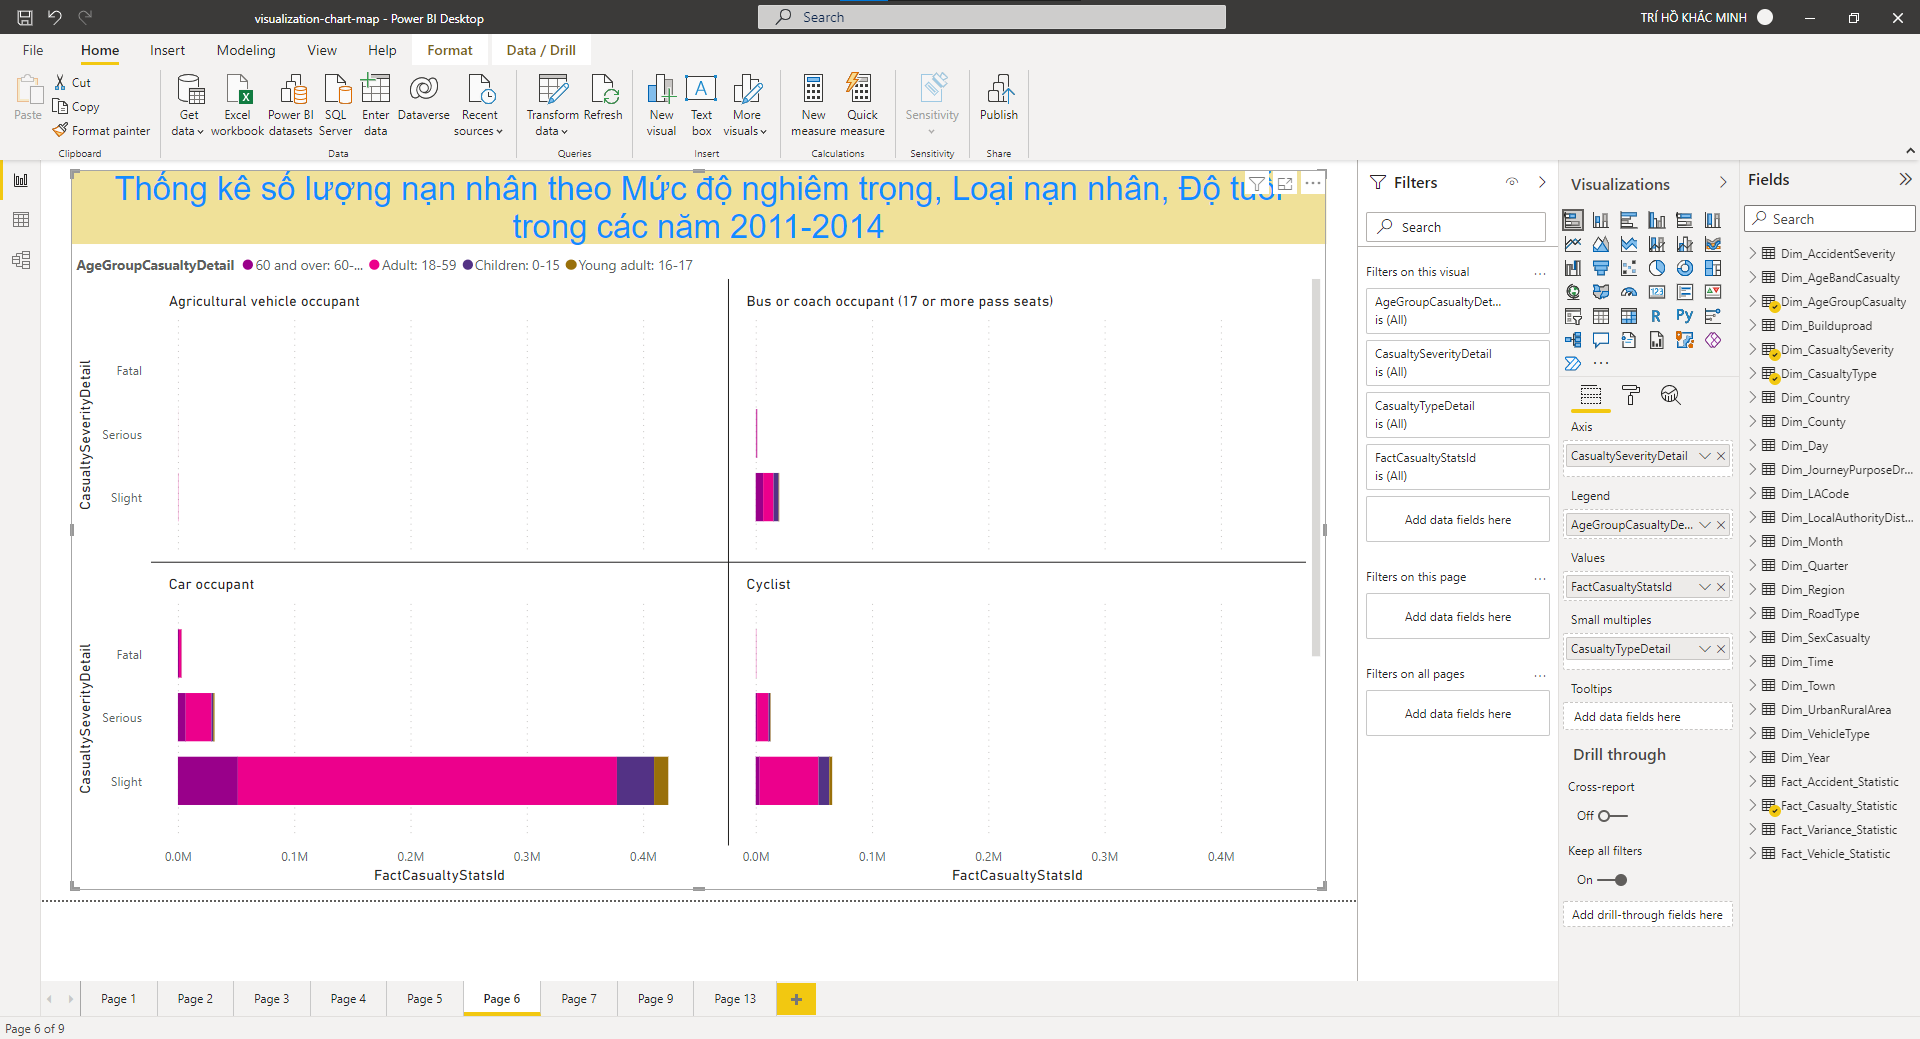
- Report the number of calsulities by Severity, Casualty Type and Age Group over years, Age Group is defined as below
- Children: 0-15
- Young adult: 0-17
- Adult: 18-59
- 60 and over: 60-...
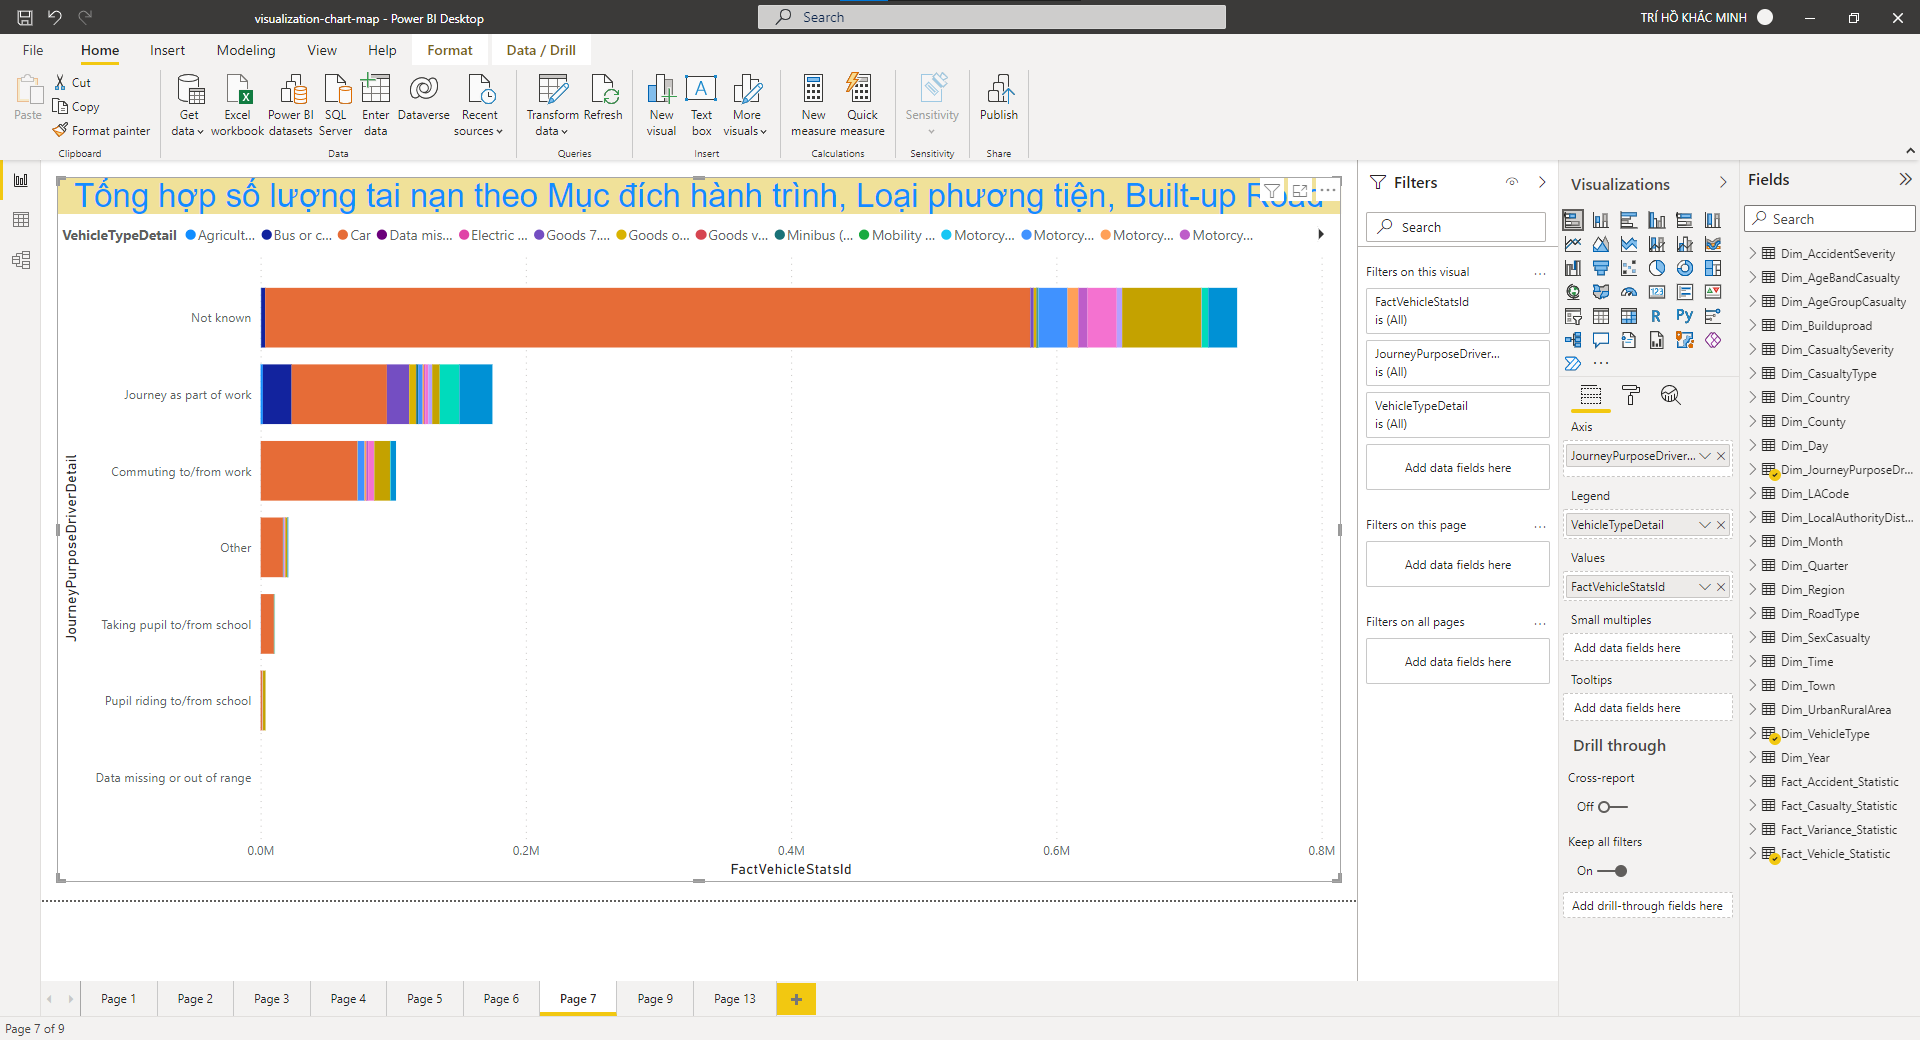
- Report the number of accidents by Journey Purpose and Vehicle Type.
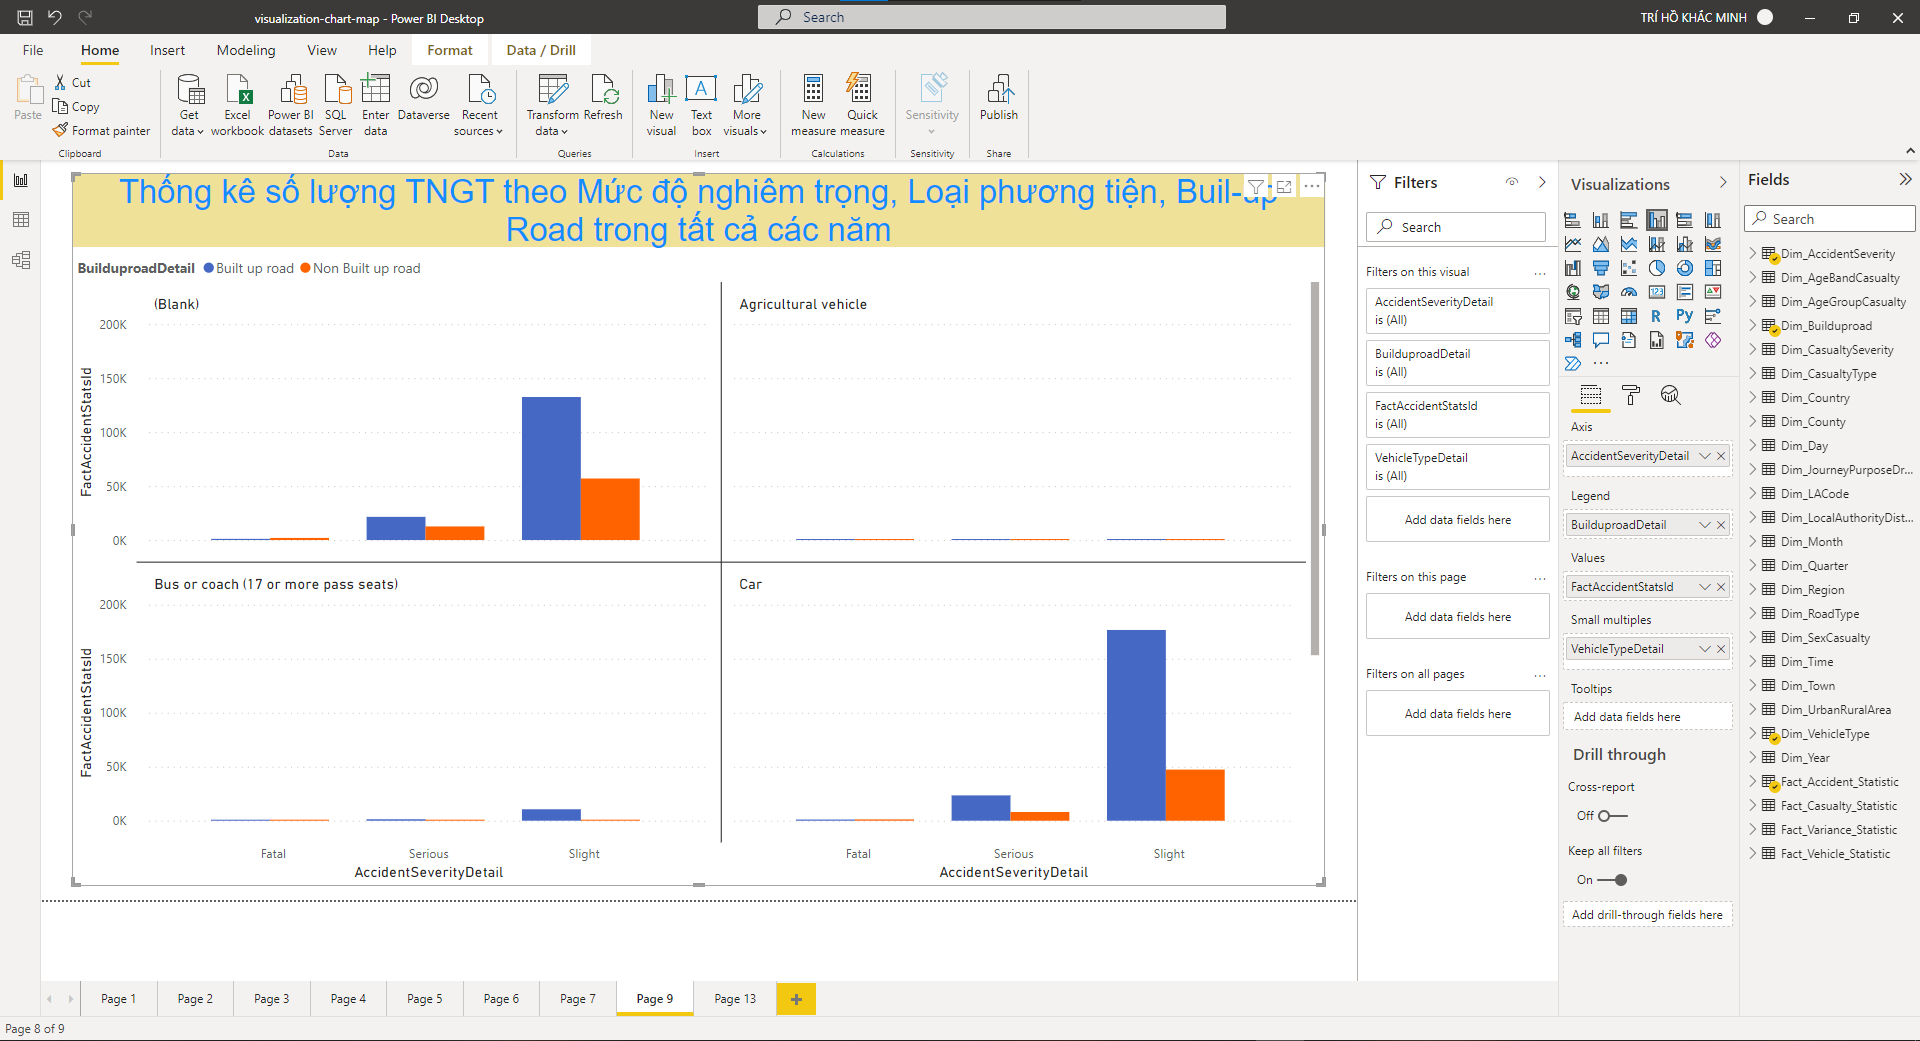
- Create a new attribute Built-up Road in Accidients table. Built-up Road may have 2 values.
- Built-up road: if Speed Limit below 50 mph
- Non Built-up road: if Speed Limit above 50 mph
- Report the number of accidents by Severity, Vehicle Type, Built-up Road over years.
- Students design other reports about UK car accident.
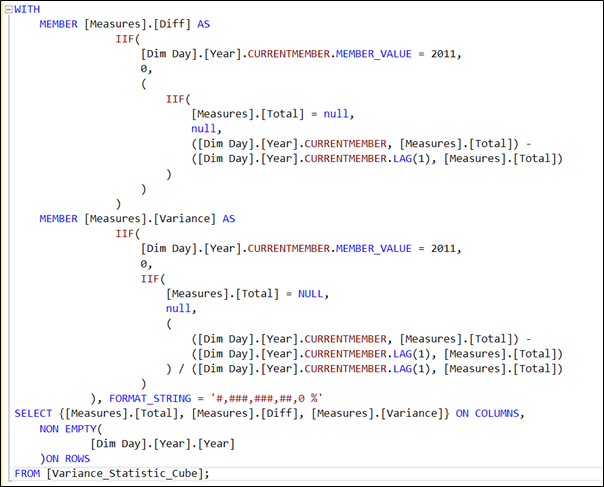
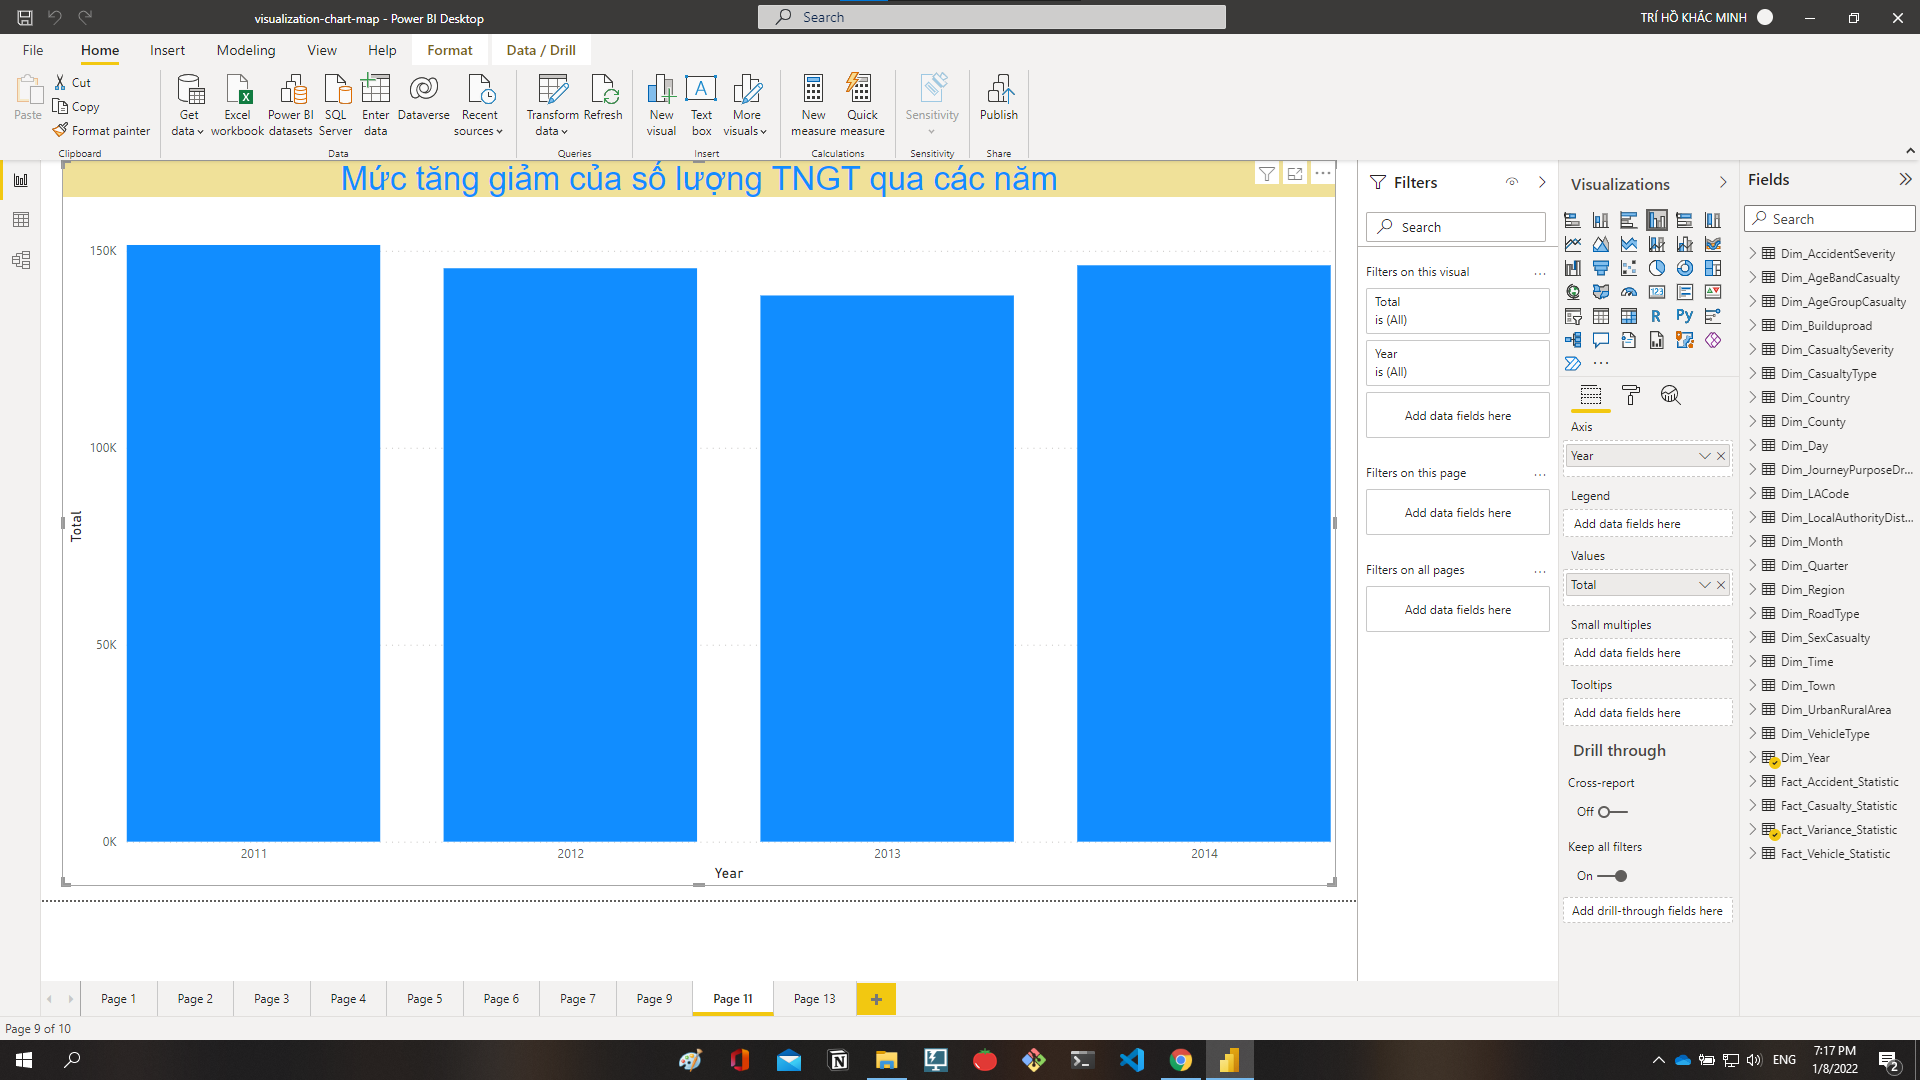
- Define fact Variance to calculate the increase and the decrease of the number of car accidents in percent over years.
- Build graphs/charts for the above reports
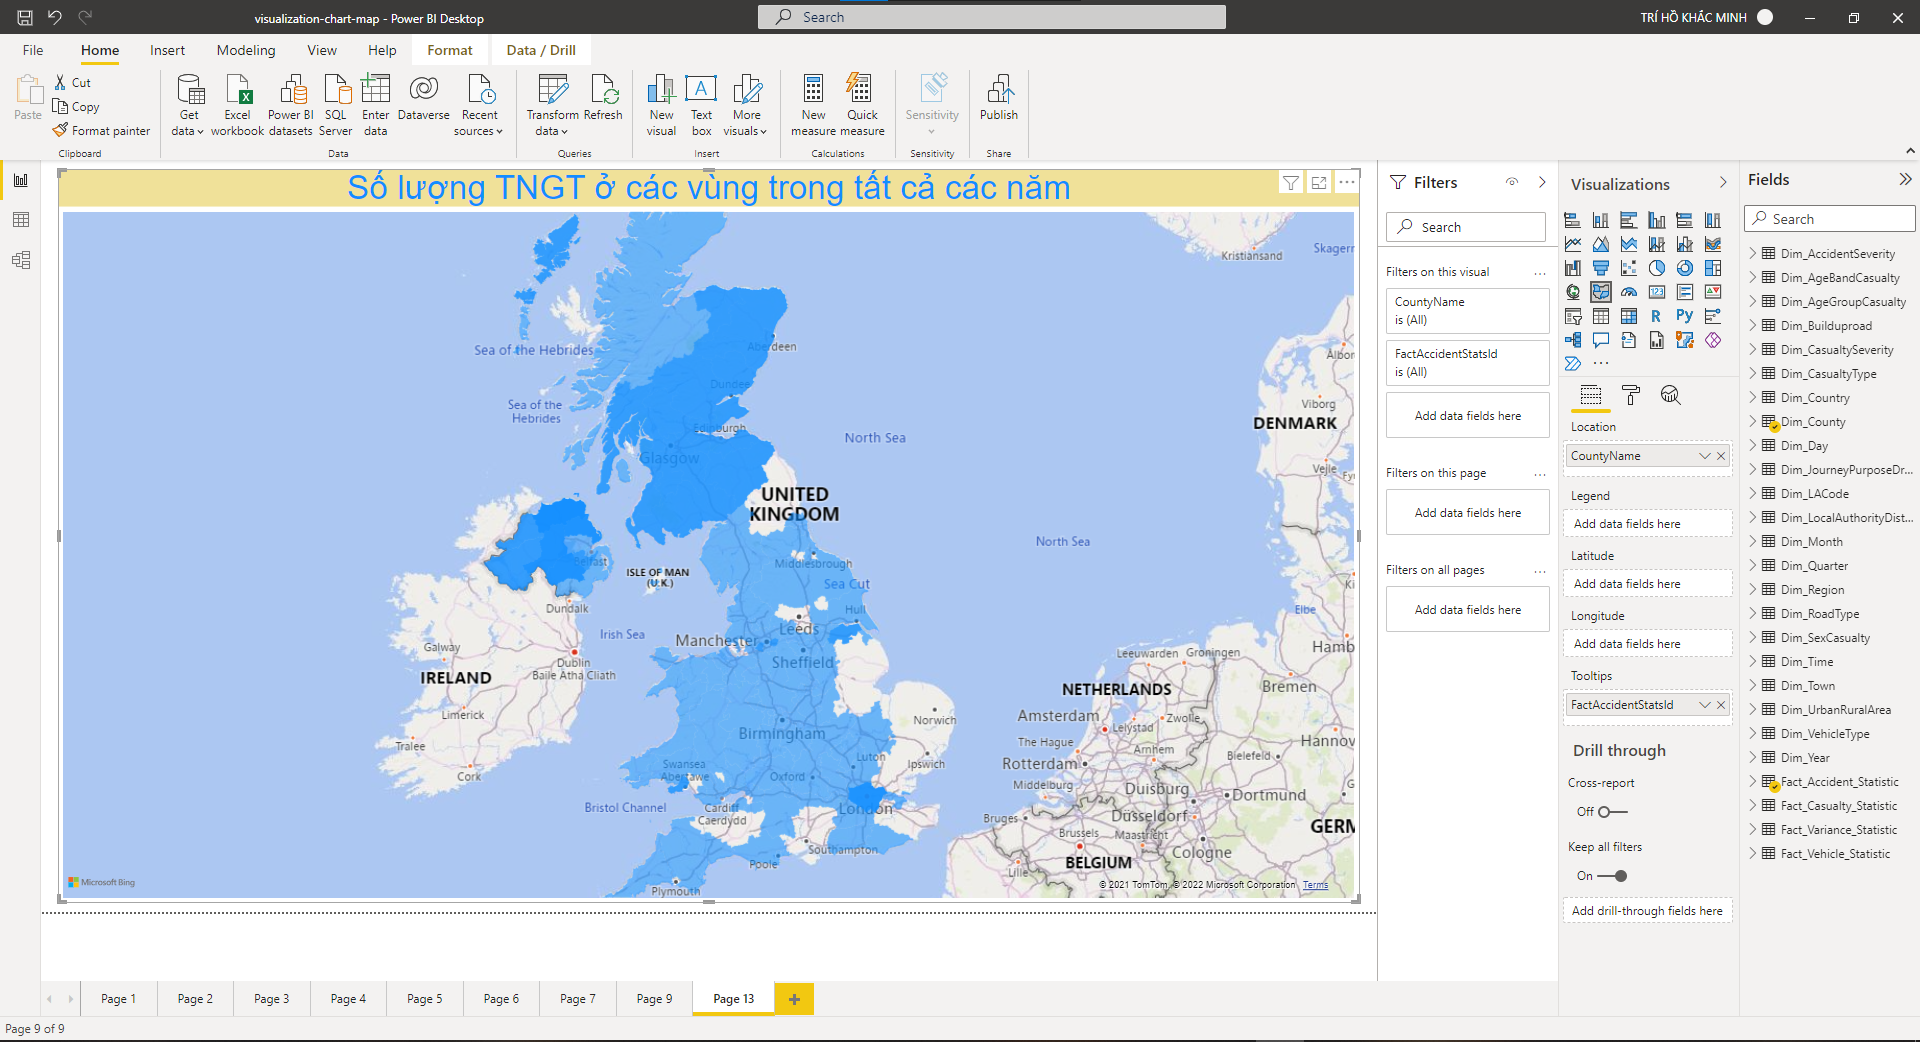
- Use regional map to visually represent (by color) the number of car accidents in regions during a year.
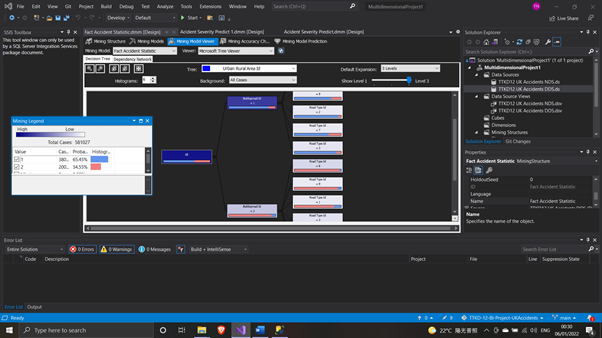
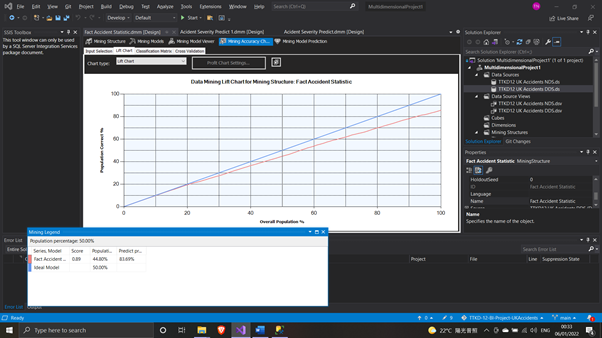
- Using models to predict the severity of accidents
- Students propose applications of any case, explain the algorithm used, why, how the results are, etc.