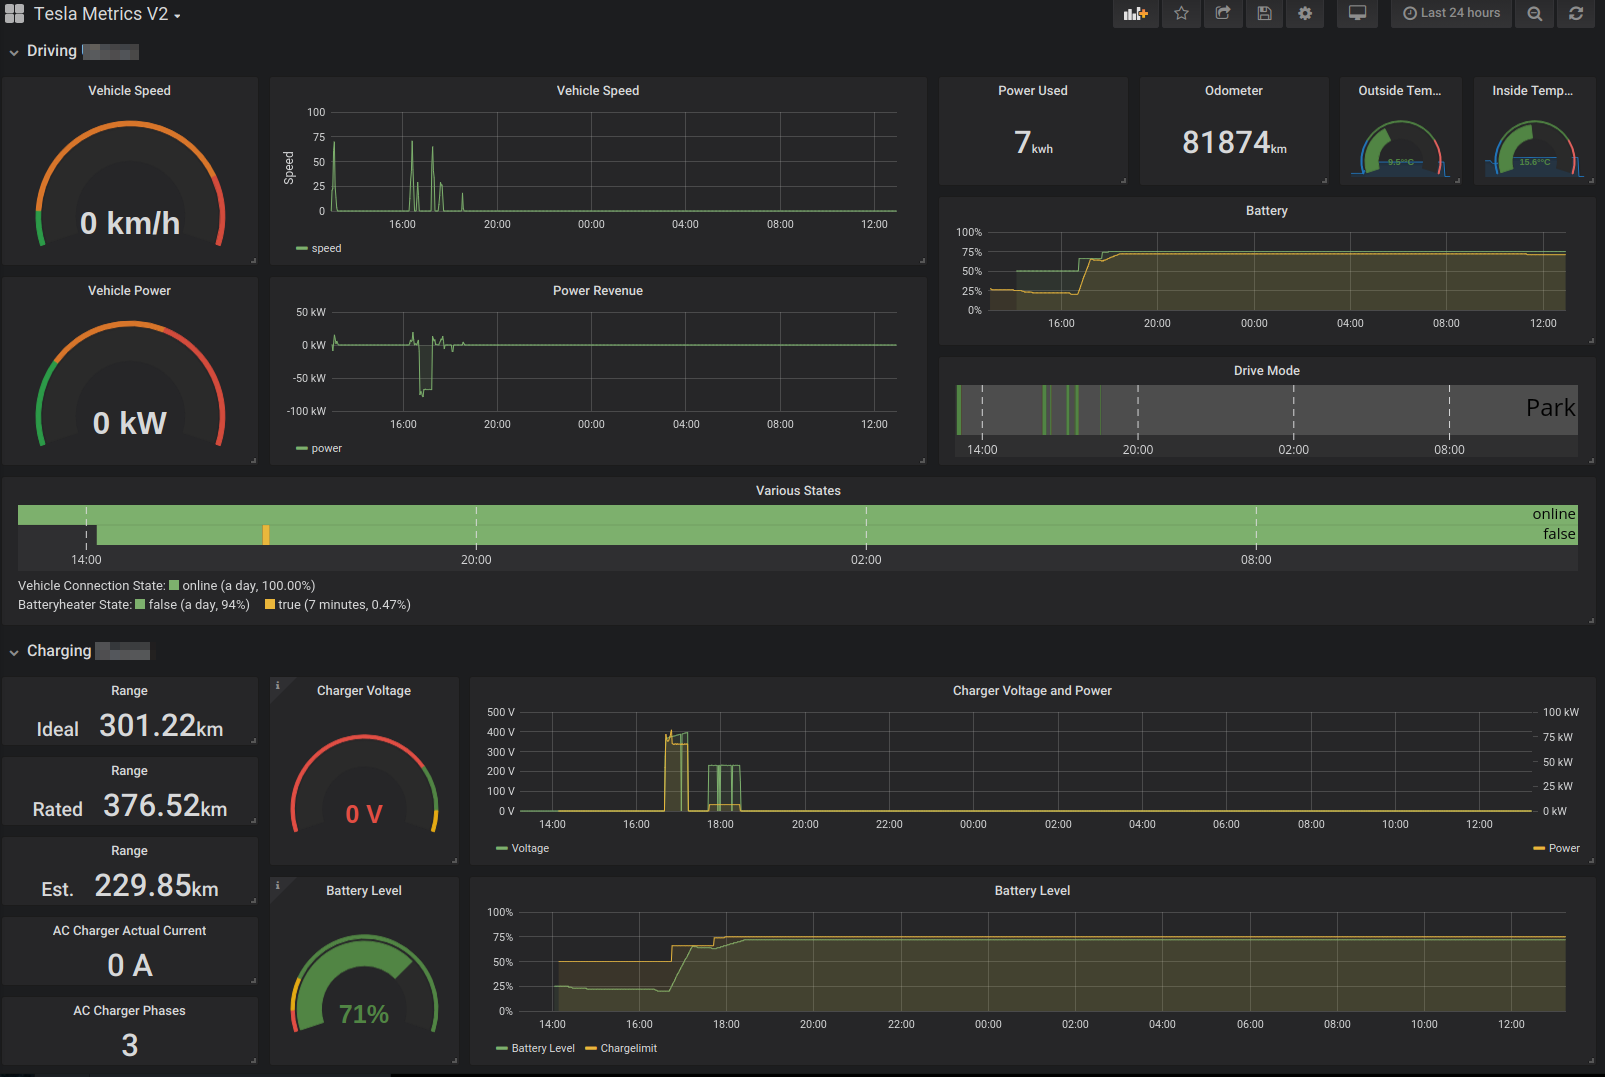
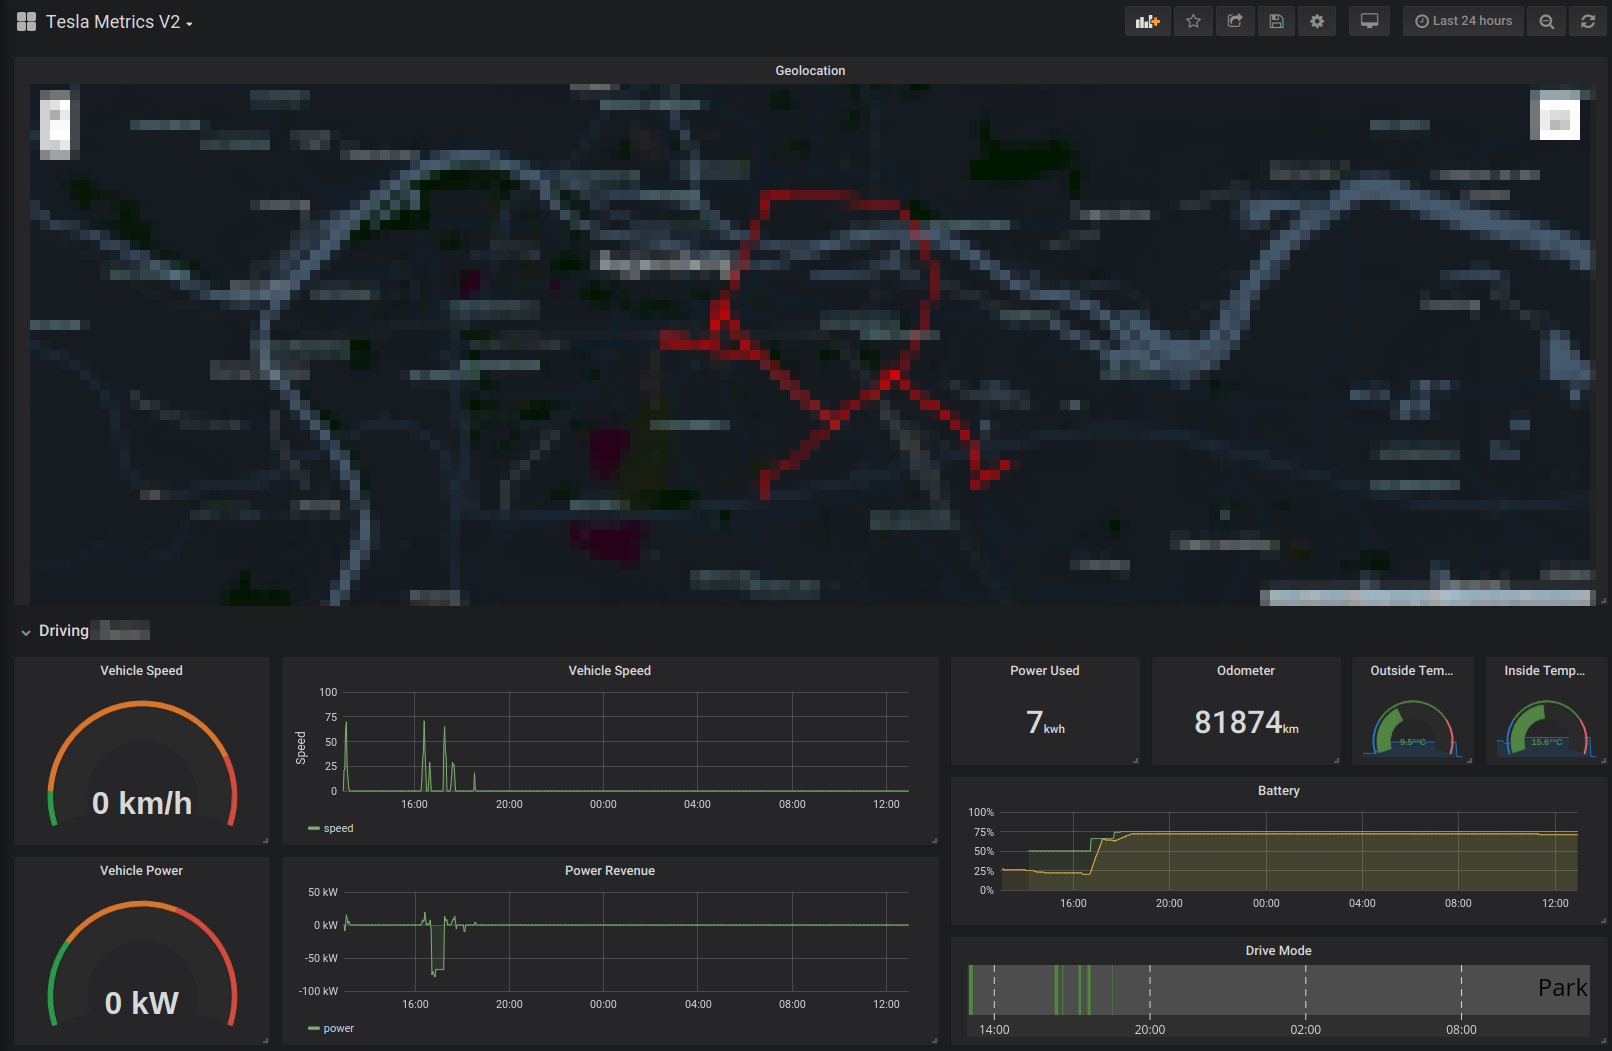
Selfhosted API Scraper for pulling Vehicle Telemetry from the Tesla Owner API into an InfluxDB visualisation on Grafana Dashboards.
Known to work with Model S, X and 3.
Current Release: v2019.5
Putting an end to handing out the Key for your 100+ Grand Car to a third party you don't know.
This can be hosted on any System that's capable of running InfluxDB, Grafana and Python. In this short guide I assume you're using a Debian'ish OS. It can run on a dedicated Linuxserver out there on the Internets or on your home Raspberry Pi.
It also has it's own API for use with an Android app or your own custom implementation, this will make sure you can start/stop/resume scraping your car. The App for Android is available on here on Google Play
The current App Version is 1.2.8
- Capable of handling multiple Vehicles in one Tesla Account
- Extended Sleep support: Car will fall asleep after certain time of no charging and no driving. Monitoring will continue withing 60 Seconds on car usage.
- Control, comes with built-in API for use with an Android app or custom implementation to stop/resume scraping
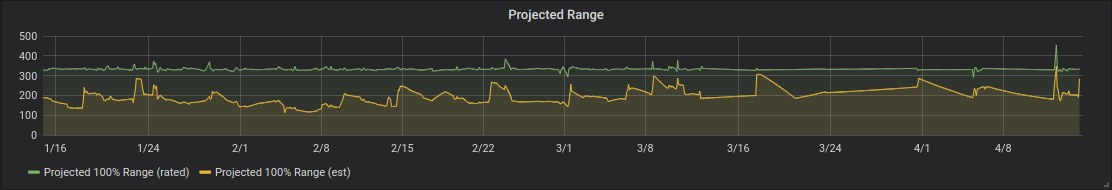
Projected 100% Range:
We updated to Python3 since Python2 is being phased out soon. Python2 is unsupported as of now.
- Install Python3
eg:
sudo apt install python3 python3-pathlib python3-pip python3-influxdb
- Install InfluxDB as in https://docs.influxdata.com/influxdb/v1.7/introduction/installation/ and create a Database where you want to store your Data in:
user@horst:~$ influx
Connected to http://localhost:8086 version 1.7.2
InfluxDB shell version: 1.7.2
Enter an InfluxQL query
> create database tesla
Additionally I suggest you to setup authentication or close the InfluxDB Port with a Packetfileter of your choice, if the Machine you use for Scraping has a Internetfacing Interface.
-
Install Grafana as in http://docs.grafana.org/installation/debian/
-
Get Grafana grafana-trackmap-panel (and required node package manager)
apt install npm
cd /var/lib/grafana/plugins
git clone https://github.com/lephisto/grafana-trackmap-panel
cd grafana-trackmap-panel
git checkout v2.0.4-teslascraper
npm install
npm run build
- Get Grafana natel-discrete-panel
grafana-cli plugins install natel-discrete-panel
- Restart grafana-server afterwards
systemctl restart grafana-server.service
- Import the Dashboard JSON Files included in this repository.
Note to the US-Users: Since the API reports all Range Values in Miles, i included two dashboard variables to match your preferences. By default the Conversion to km / kph is done, to get rid of this go to the dashboard settings:
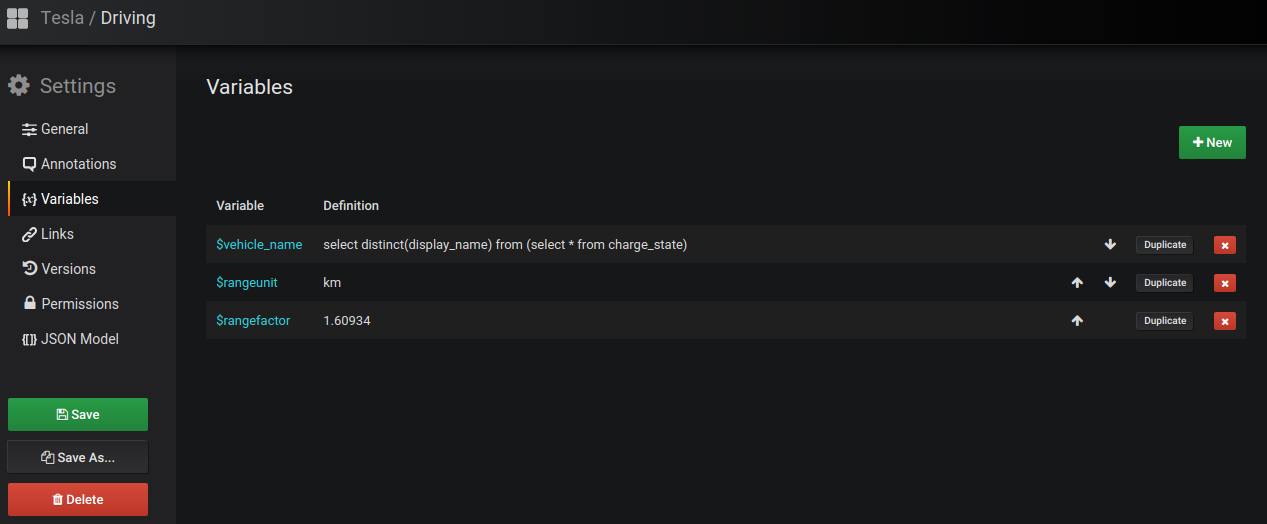
There you can change $rangeunit "km" to "mi" and $rangefactor 1.60934 to 1.0 and you're good to go.
- Get API Scraper
git clone https://github.com/lephisto/tesla-apiscraper
- Install requirements for Elevation Calculation
git clone https://github.com/tkrajina/srtm.py
cd srtm.py
python3 ./setup.py install --user
cd ..
Important:
rm -rf srtm.py
- Always pick a release
eg:
cd tesla-apiscraper
git checkout v2019.5
- Configure API Scraper
cd tesla-apiscraper
cp config.py.dist config.py
nano config.py
Set Tesla and Influxdb Credentials there.
Afterwards start the Scraping:
python3 ./apiscraper.py
Once you know everything is running fine you can start the scraper to keep running with screen or tmux, or feel free to write down a systemd service definition file.
tmux new-session -s apiscraper 'python3 apiscraper.py'
Alternatively, you can build and run tesla-apiscraper via Docker. There are two methods to run Docker stuff: Standalone and docker-compose. I recommend docker-compose in terms of the ability to update components properly.
mkdir -p /opt/apiscraper/influxdb
docker build ./ -t tesla-apiscraper
Run:
docker run -p 3000:3000 -p 8023:8023 -v /opt/apiscraper/influxdb:/var/lib/influxdb -e "TESLA_USERNAME=<your tesla email>" -e "TESLA_PASSWORD=<your tesla password>" tesla-apiscraper:latest
In this case the timeseries data will persist in /opt/apiscraper/influxdb on your Dockerhost. Feel free to adjust to your needs.
Copy config
cp config.py.compose config.py
Edit your settings, at least put in your MyTesla credentials
nano config.py
The configuration is mapped outside the container, so you can conventiently change the Configuration the same way you would without running docker, restart the container and you're good to go. Same goes for the Logfile.
Important: Create empty Log, otherwise bindmount will fail.
touch apiscraper.log
Create Directories for persistent Data:
sudo mkdir -p /opt/apiscraper/influxdb
sudo mkdir -p /opt/apiscraper/grafana
sudo chown 472 /opt/apiscraper/grafana
Start Docker Stack
./dashboard2docker.sh
docker-compose up
to keep the Console detached:
docker-compose up -d
to stop the Stack:
docker-compose down
to update and rebuild the whole Stack: to rebuild the whole Stack:
docker-compose pull
docker-compose build --build-arg CACHEBUST=$(date +%s) apiscraper
docker-compose up --force-recreate --build
You can now reach your Grafana Instance at http://localhost:3000
Raspian comes with a fairly outdated Version of Docker. Get a current one with:
curl -fsSL get.docker.com -o get-docker.sh && sh get-docker.sh
apt-get install docker-compose
Since you maybe want to handle Docker as non-root User, type:
usermod -aG docker pi
reboot
... adds pi or any other user you would like to the Docker Group.
Make it start on boot:
cp tesla-apiscraper.service /lib/systemd/system
sudo systemctl daemon-reload
sudo systemctl enable tesla-apiscraper.service
Note for Pi Zero Users: Since there's a glitch in 18.10.* on the ArmV6 you want to downgrade to docker-ce=18.06.1ce3-0~raspbian
This probably won't work on a Pi zero W, since ArmV6 is too weak.
There's a little Android App, that can help you letting your car sleep and immidiately turn on scraping when needed. You need to uncomment and configure the follwing Values for it in config.py:
a_enableapi = True
a_apikey = 'somerandomnumberwithenoughdigitsthatcantbeguessedeasily'
a_apiport = 8023
I strongly recommend to put all this behind a reverse Proxy, probably with HTTP Basic authentication in addition to the API Key.
When calling from a custom implementation ensure you set the headers correctly and format your data as JSON. Examples in curl are included below
# Getting status:
curl --header "Content-type: application/json" --header "apikey: somerandomnumberwithenoughdigitsthatcantbeguessedeasily" http://127.0.0.1:8023/state
# Start/resume scrape:
curl -X POST --header "Content-type: application/json" --header "apikey: somerandomnumberwithenoughdigitsthatcantbeguessedeasily" http://127.0.0.1:8023/switch --data '{"command":"scrape","value":""}'
# Stop scrape:
curl -X POST --header "Content-type: application/json" --header "apikey: somerandomnumberwithenoughdigitsthatcantbeguessedeasily" http://127.0.0.1:8023/switch --data '{"command":"scrape","value":"False"}'
# Single call
curl -X POST --header "Content-type: application/json" --header "apikey: somerandomnumberwithenoughdigitsthatcantbeguessedeasily" http://127.0.0.1:8023/switch --data '{"command":"oneshot","value":""}'
An exmple Apache Reverseproxy configuration would look like:
#Apiscraper ProxyPass /scraperapi http://localhost:8023 ProxyPassReverse /scraperapi http://localhost:8023 #Grafana ProxyPass /grafana http://localhost:3000 ProxyPassReverse /grafana http://localhost:3000
## Known Limitations and issues

- If you narrow down Timefilter too much, and there are no Measurements, you won't see anything in the Graph and Discrete.
- The Code is far from being clean and in some way spaghetti'ish. This will be cleaned up in future Versions.
- Boolean Values from the API currently won't show

## Some remarks about the Owner APIScraper

- As stated below, the owner API is crafted for being used by the ios or android app. One challenge was to implement a reliable sleepmode. If the car is awake, the API keeps it awake, as long as requests occur. Once it falls asleep, parts of the API can be called to check the sleep state without waking up the car, however, when the scraper detects that the car doesn't change Values (not driving, not charging), it increases the Poll interval until the Car falls asleep. Once it's asleep it checks the sleepstate every Minute. This ensures, that the stats don't miss relevant portions of rides when the car was just woken up, an issue some other monitoring implementations suffer from.

## No

- Due to incoming inquiries: I won't host an Instance of this for you nor provide any extensive Setup Support. This is aimed at people who know what they're doing. If there are Issues, open a Github Issue.

## More Disclaimer

- Please note that the use of the Tesla REST API in general and the use of this software in particular is not endorsed by Tesla. You use this software at your own risk. The author does not take responsibility for anything related to the use of this software.

## Roadmap

- Multithreaded statpulling
- Code Cleanup (feel free to send PR :)
- Move from influxql to it's successor flux, the upcoming query language for InfluxDB
- Write some Tickscripts for alerting
- Have a color gradient on geolocation that reflects any metric like speed for instance
- Improve sleepinitiation

## Credits

- Tesla API Interface forked from Greg Glockner https://github.com/gglockner/teslajson (removed pulling Tesla API Credentials from a pastebin whish seemed fishy..)
- Things stolen from basic Script from cko from the german tff-forum.de