This repo contains scripts to process GAIA DR3+ data and convert it into a Three.js visualization for the web, allowing one to either fly through the stars using WASD and mouse movement, or visit interesting spots in the galactic neighbourhood via the built-in tour facility.
https://ejtaal.github.io/gaia-web/gaia-web-starfield.html
The demo is courtesy of Github Pages and currently hosts these datasets through the gaia-web-data repository:
- 'wp-open-clusters-150ly' (~290 MB, this only contains the data surrounding points of interest)
- 'px80_2000ly_15mag' (~175 MB, px over error > 80, up to 2000ly away and up to absolute magnitude 15, i.e. all stars)
- 'px50_4000ly_-1mag' (~220MB)
- 'px20_10000ly_-3mag' (~200MB)
- 'px20_10000ly_15mag' (~1.4GB)
Please note that with standard webserver gzip compression, actual data transferred is around 30-40% of the numbers above.
A good GPU is recommended (RTX2060 / RTX 3060 Mobile or better). If rendering still only gives low FPS then ensure the browser is using the right GPU in your machine. Check task manager-> Performance to see which GPU is being used for rendering. If your built-in is being used instead of your AMD/NVidia one, enable the latter by:
- Go to Display settings
- "Graphics settings"
- Select Browse
- Select your browser executable (e.g. C:\Progfram files\Mozilla Firefox\firefox.exe)
- Select options for the browser executable you just selected
- Select 'High performance' and Save
- Restart your browser
Enjoy a high performance 3D star field 😎
To avoid downloading all this data over the internet and host it locally instead, create an empty folder on your machine, then clone the gaia-web and gaia-web-data repositories both in there. Then run a http server from the folder, e.g.:
$ mkdir gaia && cd gaia
$ git clone https://github.com/ejtaal/gaia-web
$ git clone https://github.com/ejtaal/gaia-web-data
$ python3 -m http.server --directory . 8082
You should then be able to see the website at: http://127.0.0.1:8082/gaia-web/gaia-web-starfield.html
A word only conveys a milli-picture, so here is a screenshot of work in progress, showing a side view of the Hyades cluster with Sol at the axes origin:

A video can be found here:

The video shows off the "tour" feature, where the camera visits some open clusters and flys around them. (Yes, annotations and smoother orbits are already on TODO list 😉 )
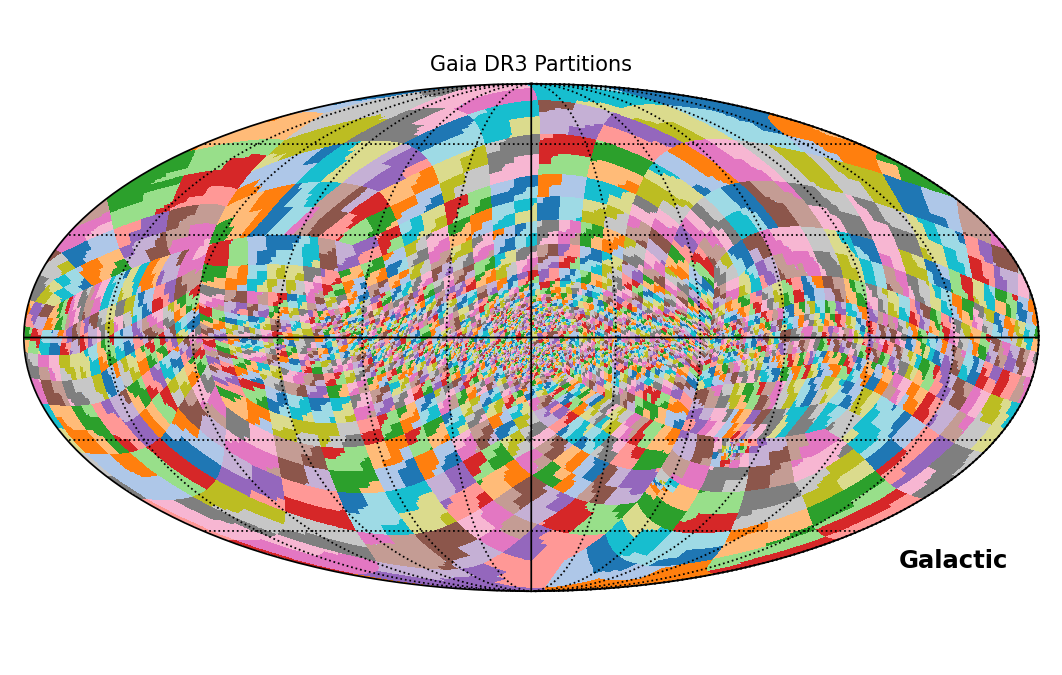
The orange stripes are there because at the time of creating the video I only had about 10% of all Gaia data files, chosen at random. Because the Milky Way is overrepresented according to the HEALPix division of the data (See https://www.cosmos.esa.int/web/gaia-users/archive/extract-data and this lovely picture: https://www.cosmos.esa.int/documents/3414525/8760265/GaiaDR3_partitions_galactic.png/a2852722-bd04-d86c-ffc4-ed877b22fc93?t=1667563775853), this will result in "streams" of stars appearing to eminate from the origin/Sol as long as a full data download hasn't been done yet.
One could say a picture only conveys a mill-VR scene, so hopefully I can host a semi-finished version somewhere that can handle some data usage.
Ever since learning about the Gaia mission I knew that, besides the obviously real science grown-ups would use it for, a visualization like this one would also be an amazingly awesome use of the data. Instead of watching the USS Enterprise flying through randomly generated star fields, one could explore our galaxy the way it actually is. I was hoping to one day create this project, but was intimidated by the learning curve of all 3D software. When I recently used Three.js for a work project which also featured a 3D scatter plot, it was much less painful than I imagined and hence applied the knowledge learned there to this project.
Tech details of how data is extracted/stored/processed:
- csv files are downloaded from ESA's server
- stars with suitable parallax values are stored locally in sqlite
- all sqlite data is then stored in a large Postgres table with indexes on suitable columns to allow various data exports.
- data exports are prepared as JS arrays and split over 100 files each.
- only those with high confidence parallax are stored in a .js
- the starfield html page loads all .js files
- star data is loaded, black body colour is calculated according to stated temperatures and size according to absolute magnitude
- ...
- Some way of pausing the whole rendering stuff so the GPU fan can have a rest and/or data transfer is stopped.
- Process complete data set and split in interesting sections, e.g.:
- Galactic outline (if descernable)
- Local neighbourhood only
- Search data for clusters by calculating star densities
- Datasets:
Add nebulae / dust clouds based on suitable astro photographs- add many more
- could use help from a GLSL expert on how to efficiently create volumetric clouds as this seems to be a highly tricky thing to make
- focus on high density anomolies (globular/open clusters/nebulae), so this will rely on prior appropriate binning and using that to generate only star data for high density regions found.
- Import more nebulae
- Annotate interesting features, e.g.:
done: Open clusters- Globular clusters (if present in data?)
- Famous constellations / star systems (binaries etc)
- known exoplanet hosts
- Use Gaia Sky data for annotations?
- Make stars glow (i.e. use GSLS trickery to create light sources instead of a sprite)
- Implement waypoint tour
- Done, but need some way of interacting with it / sharing / adding items / tagging tour stops etc...
Create open cluster waypoint tour dataset- stretched out clusters have been contracted according to their highly unlike stretched out coordinates based on DR3 data alone, a contraction in the distance dimension only so to speak
Add hud view for camera viewing angle- add speed vector
- some sort of galactic or RA/dec minimap HUD view? Or grid on sky background option?
Better tour navigation, i.e. next/prev/reset buttons at least
- Allow sharing of location / camera angle via url, e.g. http://site/gwsf#12,45,56@0.5,0.5,0.5 (would need to include selected dataset)
- Separate viewer and dataset for Gaia galactic candidates data set, using red-shift to calculate 3D position. Other datasets may have additional/more/better data too (SLOAN?).
- Incorporate some 3D version of:
- Gaia Sky (also awesome!): https://zah.uni-heidelberg.de/gaia/outreach/gaiasky
- Gaia's own visualization page: https://gea.esac.esa.int/archive/visualization/
- Inspiration was gained from the awesome pioneering work done by @flimshaw who used the 2016 Gaia DR1 data to construct a 3D visualization of it:
- The Fifth Catalogue of Nearby Stars (CNS5) - https://dc.zah.uni-heidelberg.de/tableinfo/cns5.main
- Astrometry.net for providing Astrobin with the data I desperately need for the data files (i.e. ra, dec, rotation, field radius)
- Astrobin and it's users, namely for their beautiful nebulae etc images (permission pending unless otherwise specified):
- Andromeda_Galaxy: Yann SAINTY - https://www.astrobin.com/69vhka/
- Barnards_Loop: -
- Butterfly: n/a
- California_Nebula: David McGarvey - https://www.astrobin.com/8j3q6b/0/
- Carina: Bray Falls - https://www.astrobin.com/81eie2/
- Cave_Nebula: Chuck's Astrophotography - https://www.astrobin.com/370910/D/
- Crab: AdamDudko - https://www.astrobin.com/8bfggs/C/
- Dumbbell: Victor Van Puyenbroeck - https://www.astrobin.com/d49fu9/
- HST_Butterfly: NASA et al - https://www.nasa.gov/multimedia/imagegallery/image_feature_2526.html
- HST_Helix: NASA et al. - https://hubblesite.org/contents/media/images/2004/32/1608-Image.html
- HST_M57: n/a
- Horsehead_Nebula: Bernhard Zimmermann - https://www.astrobin.com/391473/
- LMC: Astro_m - https://www.astrobin.com/0n125h/
- Lagoon: Jae Lee - https://www.astrobin.com/dctny6/
- Little Dumbbell: Jim Matzger - https://www.astrobin.com/391294/
- M16_Eagle_Nebula_wide: David (Deddy) Dayag - https://en.wikipedia.org/wiki/File:Eagle_nebula_by_Deddy_Dayag.jpg
- Orion: Jeff Marston - https://www.astrobin.com/gbree6/
- RCW58: Neil Corke - https://www.astrobin.com/afl92i/
- Ring_Nebula: Łukasz Sujka - https://www.astrobin.com/jgv4i3/
- SMC: Evan Tsai - https://www.astrobin.com/5viswi/B/
- Sag_Astar: -
- Sh2-54: John Favalessa - https://www.astrobin.com/c3az1p/
- Swan: AstroDinsk - https://www.astrobin.com/tsrhks/
- Trifid: Charles Pevsner - https://www.astrobin.com/ohi7s6/
- Veil: Clément Ver Eecke - https://www.astrobin.com/wx5lp1/ (Used with permission)
- ...