[SLES15]: Fleet-server Agent gets into offline state on machine reboot. #2431
Comments
|
@manishgupta-qasource Please review |
|
Secondary review for this ticket is Done |
|
The fleet state is starting and Fleet server reports itself as reconfiguring: fleet_state: 0
fleet_message: ""
#...
state:
state: 2
message: 'Healthy: communicating with pid ''1022'''
units:
? unittype: 0
unitid: fleet-server-default-fleet-server-fleet_server-5cc1bc7e-20d8-4174-9af3-4023ec1cd024
: state: 1
message: Re-configuring
? unittype: 1
unitid: fleet-server-default
: state: 1
message: Re-configuring
version_info:
name: fleet-server
version: 8.7.0
meta:
build_time: 2023-03-07 15:37:52 +0000 UTC
commit: aca39518 |
|
These are the Fleet server logs, it seems like it can't connect to Elasticsearch {"log.level":"info","@timestamp":"2023-03-14T13:20:43.941Z","message":"Setting cache config options","component":{"binary":"fleet-server","dataset":"elastic_agent.fleet_server","id":"fleet-server-default","type":"fleet-server"},"log":{"source":"fleet-server-default"},"ecs.version":"1.6.0","service.name":"fleet-server","cfg":{"APIKeyJitter":300000000000,"APIKeyTTL":900000000000,"ActionTTL":300000000000,"ArtifactTTL":86400000000000,"EnrollKeyTTL":60000000000,"MaxCost":52428800,"NumCounters":500000},"ecs.version":"1.6.0"}
{"log.level":"info","@timestamp":"2023-03-14T13:20:43.947Z","message":"Starting","component":{"binary":"fleet-server","dataset":"elastic_agent.fleet_server","id":"fleet-server-default","type":"fleet-server"},"log":{"source":"fleet-server-default"},"ecs.version":"1.6.0","service.name":"fleet-server","state":"STARTING","ecs.version":"1.6.0"}
{"log.level":"info","@timestamp":"2023-03-14T13:20:43.948Z","message":"initial server configuration","component":{"binary":"fleet-server","dataset":"elastic_agent.fleet_server","id":"fleet-server-default","type":"fleet-server"},"log":{"source":"fleet-server-default"},"ecs.version":"1.6.0","service.name":"fleet-server","new":{"Fleet":{"Agent":{"ID":"a2f4b285-57ed-42f0-9cde-fedd137b6474","Logging":{"Level":"info"},"Version":"8.7.0"},"Host":{"ID":"","Name":""}},"HTTP":{"Enabled":true,"Host":"unix:///opt/Elastic/Agent/data/tmp/fleet-server-default.sock","Port":5066,"SecurityDescriptor":"","User":""},"Inputs":[{"Cache":{"APIKeyJitter":0,"APIKeyTTL":0,"ActionTTL":0,"ArtifactTTL":0,"EnrollKeyTTL":0,"MaxCost":0,"NumCounters":0},"Monitor":{"FetchSize":0,"PollTimeout":0},"Policy":{"ID":""},"Server":{"Bulk":{"FlushInterval":250000000,"FlushMaxPending":8,"FlushThresholdCount":2048,"FlushThresholdSize":1048576},"CompressionLevel":1,"CompressionThresh":1024,"GC":{"CleanupAfterExpiredInterval":"30d","ScheduleInterval":3600000000000},"Host":"0.0.0.0","Instrumentation":{"APIKey":"","Enabled":false,"Environment":"","GlobalLabels":"","Hosts":null,"SecretToken":"","TLS":{"ServerCA":"","ServerCertificate":"","SkipVerify":false},"TransactionSampleRate":""},"InternalPort":8221,"Limits":{"AckLimit":{"Burst":100,"Interval":10000000,"Max":50,"MaxBody":2097152},"ArtifactLimit":{"Burst":25,"Interval":5000000,"Max":50,"MaxBody":0},"CheckinLimit":{"Burst":1000,"Interval":1000000,"Max":0,"MaxBody":1048576},"EnrollLimit":{"Burst":100,"Interval":10000000,"Max":50,"MaxBody":524288},"MaxAgents":0,"MaxConnections":0,"MaxHeaderByteSize":8192,"PolicyThrottle":5000000,"StatusLimit":{"Burst":25,"Interval":5000000,"Max":50,"MaxBody":0},"UploadChunkLimit":{"Burst":10,"Interval":3000000,"Max":5,"MaxBody":4194304},"UploadEndLimit":{"Burst":5,"Interval":2000000000,"Max":2,"MaxBody":1024},"UploadStartLimit":{"Burst":8,"Interval":3000000000,"Max":3,"MaxBody":5242880}},"Port":8220,"Profiler":{"Bind":"localhost:6060","Enabled":false},"Runtime":{"GCPercent":0},"TLS":{"CASha256":null,"CAs":null,"Certificate":{"Certificate":"-----BEGIN CERTIFICATE-----\nMIIDSjCCAjKgAwIBAgICBnowDQYJKoZIhvcNAQELBQAwLDEWMBQGA1UEChMNZWxh\nc3RpYy1mbGVldDESMBAGA1UEAxMJbG9jYWxob3N0MB4XDTIzMDMxNDEzMTQzOFoX\nDTMzMDMxNDEzMTQzOFowMzEWMBQGA1UEChMNZWxhc3RpYy1mbGVldDEZMBcGA1UE\nAxMQaXAtMTcyLTMxLTU3LTEwOTCCASIwDQYJKoZIhvcNAQEBBQADggEPADCCAQoC\nggEBAL2xkV5OKCL9ZqFgoH7/y/xvlM6EABykXOpZjP3/+ugx/nAMA0dFaeUHU7MN\nqvMw91kgrVGkJ8nb6uRXa6PbBVY/U5QVPVC1QHxNXpo9Ye9vDaf7C336UEr12+IF\nCC12i3SyAOD5gWmckgeRDJsVIkJ+W1r5JWUkWjIB6QjQzZlX3Jz6DH92VmMKEEfe\nKaWS28O73pNjVVxh0TePL+1+ADogIiGpEIOxv0wq9q6bJcyDhBFKHhYBgCFH30W+\ns31RIt2npK9BvD5/PbpcKSKqhz1lsJOTO0YMY1KGcZWiyKQH/xkEpBaN6SpfTn7a\n/QH7J6sXed7uzWLfOlHpXKqcQ1sCAwEAAaNvMG0wDgYDVR0PAQH/BAQDAgeAMB0G\nA1UdJQQWMBQGCCsGAQUFBwMCBggrBgEFBQcDATAfBgNVHSMEGDAWgBQbcyE1Fo5b\nrmOtwGsfEN8DZkgLNDAbBgNVHREEFDASghBpcC0xNzItMzEtNTctMTA5MA0GCSqG\nSIb3DQEBCwUAA4IBAQANYSIoOoxi1epv/6u4bvNHSNEIUSBkL/+uTAAQwcrvc2/R\nA/xXphu9/DGBx17SOOz+L07NBkCsZdZFPYQ2czb58PW9uiqMIi62D3RmuMAl8clw\ng4U96cnNRB1e2ZyQHHnpOgiMeu1Mp/aUSnJJd+C5b044sMLreeukJVVGsS/Asb+w\nuzBYVcA0EHQueTwnCD9ZcqTLtMJ6RGn+eJs2qSOrDML+xcnSpdWTlF8g+wK2pBds\nVa004Y+fq0lG3eENpU3JAH5O/krIvaf2TYZvs6z0wQK5jqvyfOiSQwTe0/djlyql\nzkJV6b5n/SjRb6F9YhW+jOSrCgjrwMHYLDA4Nc+8\n-----END CERTIFICATE-----\n","Key":"[redacted]","Passphrase":""},"CipherSuites":null,"ClientAuth":0,"CurveTypes":null,"Enabled":null,"VerificationMode":"full","Versions":null},"Timeouts":{"CheckinJitter":30000000000,"CheckinLongPoll":300000000000,"CheckinTimestamp":30000000000,"Idle":30000000000,"Read":60000000000,"ReadHeader":5000000000,"Write":600000000000}},"Type":""}],"Logging":{"Files":null,"Level":"info","Pretty":false,"ToFiles":true,"ToStderr":true},"Output":{"Elasticsearch":{"APIKey":"","Headers":null,"Hosts":["ca3df1e600684321ac547810f0fa3235.europe-west1.gcp.cloud.es.io:443"],"MaxConnPerHost":128,"MaxContentLength":104857600,"MaxRetries":3,"Path":"","Protocol":"https","ProxyDisable":false,"ProxyHeaders":{},"ProxyURL":"","ServiceToken":"[redacted]","TLS":null,"Timeout":90000000000},"Extra":null}},"ecs.version":"1.6.0"}
{"log.level":"info","@timestamp":"2023-03-14T13:20:43.948Z","message":"starting server on configuration change","component":{"binary":"fleet-server","dataset":"elastic_agent.fleet_server","id":"fleet-server-default","type":"fleet-server"},"log":{"source":"fleet-server-default"},"ecs.version":"1.6.0","service.name":"fleet-server","ecs.version":"1.6.0"}
{"log.level":"info","@timestamp":"2023-03-14T13:20:43.950Z","message":"Starting stats endpoint","component":{"binary":"fleet-server","dataset":"elastic_agent.fleet_server","id":"fleet-server-default","type":"fleet-server"},"log":{"source":"fleet-server-default"},"ecs.version":"1.6.0","service.name":"fleet-server","log.logger":"fleet-metrics.api","@timestamp":"2023-03-14T13:20:43.95Z","ecs.version":"1.6.0"}
{"log.level":"info","@timestamp":"2023-03-14T13:20:44.003Z","message":"Metrics endpoint listening on: /opt/Elastic/Agent/data/tmp/fleet-server-default.sock (configured: unix:///opt/Elastic/Agent/data/tmp/fleet-server-default.sock)","component":{"binary":"fleet-server","dataset":"elastic_agent.fleet_server","id":"fleet-server-default","type":"fleet-server"},"log":{"source":"fleet-server-default"},"ecs.version":"1.6.0","service.name":"fleet-server","log.logger":"fleet-metrics.api","ecs.version":"1.6.0"}
{"log.level":"error","@timestamp":"2023-03-14T13:20:44.209Z","message":"fail elasticsearch info","component":{"binary":"fleet-server","dataset":"elastic_agent.fleet_server","id":"fleet-server-default","type":"fleet-server"},"log":{"source":"fleet-server-default"},"ecs.version":"1.6.0","service.name":"fleet-server","cluster.addr":["ca3df1e600684321ac547810f0fa3235.europe-west1.gcp.cloud.es.io:443"],"cluster.maxConnsPersHost":128,"error.message":"dial tcp: lookup ca3df1e600684321ac547810f0fa3235.europe-west1.gcp.cloud.es.io on [::1]:53: read udp [::1]:53506->[::1]:53: read: connection refused","ecs.version":"1.6.0"}
{"log.level":"info","@timestamp":"2023-03-14T13:20:44.209Z","message":"Stats endpoint (/opt/Elastic/Agent/data/tmp/fleet-server-default.sock) finished: accept unix /opt/Elastic/Agent/data/tmp/fleet-server-default.sock: use of closed network connection","component":{"binary":"fleet-server","dataset":"elastic_agent.fleet_server","id":"fleet-server-default","type":"fleet-server"},"log":{"source":"fleet-server-default"},"log.logger":"fleet-metrics.api","ecs.version":"1.6.0","service.name":"fleet-server","ecs.version":"1.6.0"}
{"log.level":"info","@timestamp":"2023-03-14T13:20:44.209Z","message":"Error - dial tcp: lookup ca3df1e600684321ac547810f0fa3235.europe-west1.gcp.cloud.es.io on [::1]:53: read udp [::1]:53506->[::1]:53: read: connection refused","component":{"binary":"fleet-server","dataset":"elastic_agent.fleet_server","id":"fleet-server-default","type":"fleet-server"},"log":{"source":"fleet-server-default"},"state":"FAILED","ecs.version":"1.6.0","service.name":"fleet-server","ecs.version":"1.6.0"}
{"log.level":"error","@timestamp":"2023-03-14T13:20:44.210Z","message":"Fleet Server failed","component":{"binary":"fleet-server","dataset":"elastic_agent.fleet_server","id":"fleet-server-default","type":"fleet-server"},"log":{"source":"fleet-server-default"},"ecs.version":"1.6.0","service.name":"fleet-server","error.message":"dial tcp: lookup ca3df1e600684321ac547810f0fa3235.europe-west1.gcp.cloud.es.io on [::1]:53: read udp [::1]:53506->[::1]:53: read: connection refused","@timestamp":"2023-03-14T13:20:44.21Z","ecs.version":"1.6.0"}
{"log.level":"error","@timestamp":"2023-03-14T13:20:44.210Z","log.origin":{"file.name":"coordinator/coordinator.go","file.line":857},"message":"Unit state changed fleet-server-default-fleet-server-fleet_server-5cc1bc7e-20d8-4174-9af3-4023ec1cd024 (STARTING->FAILED): Error - dial tcp: lookup ca3df1e600684321ac547810f0fa3235.europe-west1.gcp.cloud.es.io on [::1]:53: read udp [::1]:53506->[::1]:53: read: connection refused","log":{"source":"elastic-agent"},"component":{"id":"fleet-server-default","state":"HEALTHY"},"unit":{"id":"fleet-server-default-fleet-server-fleet_server-5cc1bc7e-20d8-4174-9af3-4023ec1cd024","type":"input","state":"FAILED","old_state":"STARTING"},"ecs.version":"1.6.0"}
{"log.level":"error","@timestamp":"2023-03-14T13:20:44.210Z","log.origin":{"file.name":"coordinator/coordinator.go","file.line":857},"message":"Unit state changed fleet-server-default (STARTING->FAILED): Error - dial tcp: lookup ca3df1e600684321ac547810f0fa3235.europe-west1.gcp.cloud.es.io on [::1]:53: read udp [::1]:53506->[::1]:53: read: connection refused","log":{"source":"elastic-agent"},"component":{"id":"fleet-server-default","state":"HEALTHY"},"unit":{"id":"fleet-server-default","type":"output","state":"FAILED","old_state":"STARTING"},"ecs.version":"1.6.0"}
I believe this is a DNS lookup failure, this can also been seen in the error messages from the Beats started by agent: {"log.level":"warn","@timestamp":"2023-03-14T13:20:47.401Z","message":"DNS lookup failure \"ca3df1e600684321ac547810f0fa3235.europe-west1.gcp.cloud.es.io\": lookup ca3df1e600684321ac547810f0fa3235.europe-west1.gcp.cloud.es.io on [::1]:53: read udp [::1]:57757->[::1]:53: read: connection refused","component":{"binary":"metricbeat","dataset":"elastic_agent.metricbeat","id":"beat/metrics-monitoring","type":"beat/metrics"},"log":{"source":"beat/metrics-monitoring"},"log.logger":"transport","log.origin":{"file.line":52,"file.name":"transport/tcp.go"},"service.name":"metricbeat","ecs.version":"1.6.0","ecs.version":"1.6.0"}
{"log.level":"error","@timestamp":"2023-03-14T13:20:47.401Z","message":"Error dialing lookup ca3df1e600684321ac547810f0fa3235.europe-west1.gcp.cloud.es.io on [::1]:53: read udp [::1]:57757->[::1]:53: read: connection refused","component":{"binary":"metricbeat","dataset":"elastic_agent.metricbeat","id":"beat/metrics-monitoring","type":"beat/metrics"},"log":{"source":"beat/metrics-monitoring"},"address":"ca3df1e600684321ac547810f0fa3235.europe-west1.gcp.cloud.es.io:443","service.name":"metricbeat","network":"tcp","ecs.version":"1.6.0","log.logger":"esclientleg","log.origin":{"file.line":38,"file.name":"transport/logging.go"},"ecs.version":"1.6.0"} |
|
Interestingly the same failure happens later but Fleet server reports itself as configuring instead of failed: {"log.level":"info","@timestamp":"2023-03-14T13:20:43.941Z","message":"Setting cache config options","component":{"binary":"fleet-server","dataset":"elastic_agent.fleet_server","id":"fleet-server-default","type":"fleet-server"},"log":{"source":"fleet-server-default"},"ecs.version":"1.6.0","service.name":"fleet-server","cfg":{"APIKeyJitter":300000000000,"APIKeyTTL":900000000000,"ActionTTL":300000000000,"ArtifactTTL":86400000000000,"EnrollKeyTTL":60000000000,"MaxCost":52428800,"NumCounters":500000},"ecs.version":"1.6.0"}
{"log.level":"info","@timestamp":"2023-03-14T13:20:43.947Z","message":"Starting","component":{"binary":"fleet-server","dataset":"elastic_agent.fleet_server","id":"fleet-server-default","type":"fleet-server"},"log":{"source":"fleet-server-default"},"ecs.version":"1.6.0","service.name":"fleet-server","state":"STARTING","ecs.version":"1.6.0"}
{"log.level":"info","@timestamp":"2023-03-14T13:20:43.948Z","message":"initial server configuration","component":{"binary":"fleet-server","dataset":"elastic_agent.fleet_server","id":"fleet-server-default","type":"fleet-server"},"log":{"source":"fleet-server-default"},"ecs.version":"1.6.0","service.name":"fleet-server","new":{"Fleet":{"Agent":{"ID":"a2f4b285-57ed-42f0-9cde-fedd137b6474","Logging":{"Level":"info"},"Version":"8.7.0"},"Host":{"ID":"","Name":""}},"HTTP":{"Enabled":true,"Host":"unix:///opt/Elastic/Agent/data/tmp/fleet-server-default.sock","Port":5066,"SecurityDescriptor":"","User":""},"Inputs":[{"Cache":{"APIKeyJitter":0,"APIKeyTTL":0,"ActionTTL":0,"ArtifactTTL":0,"EnrollKeyTTL":0,"MaxCost":0,"NumCounters":0},"Monitor":{"FetchSize":0,"PollTimeout":0},"Policy":{"ID":""},"Server":{"Bulk":{"FlushInterval":250000000,"FlushMaxPending":8,"FlushThresholdCount":2048,"FlushThresholdSize":1048576},"CompressionLevel":1,"CompressionThresh":1024,"GC":{"CleanupAfterExpiredInterval":"30d","ScheduleInterval":3600000000000},"Host":"0.0.0.0","Instrumentation":{"APIKey":"","Enabled":false,"Environment":"","GlobalLabels":"","Hosts":null,"SecretToken":"","TLS":{"ServerCA":"","ServerCertificate":"","SkipVerify":false},"TransactionSampleRate":""},"InternalPort":8221,"Limits":{"AckLimit":{"Burst":100,"Interval":10000000,"Max":50,"MaxBody":2097152},"ArtifactLimit":{"Burst":25,"Interval":5000000,"Max":50,"MaxBody":0},"CheckinLimit":{"Burst":1000,"Interval":1000000,"Max":0,"MaxBody":1048576},"EnrollLimit":{"Burst":100,"Interval":10000000,"Max":50,"MaxBody":524288},"MaxAgents":0,"MaxConnections":0,"MaxHeaderByteSize":8192,"PolicyThrottle":5000000,"StatusLimit":{"Burst":25,"Interval":5000000,"Max":50,"MaxBody":0},"UploadChunkLimit":{"Burst":10,"Interval":3000000,"Max":5,"MaxBody":4194304},"UploadEndLimit":{"Burst":5,"Interval":2000000000,"Max":2,"MaxBody":1024},"UploadStartLimit":{"Burst":8,"Interval":3000000000,"Max":3,"MaxBody":5242880}},"Port":8220,"Profiler":{"Bind":"localhost:6060","Enabled":false},"Runtime":{"GCPercent":0},"TLS":{"CASha256":null,"CAs":null,"Certificate":{"Certificate":"-----BEGIN CERTIFICATE-----\nMIIDSjCCAjKgAwIBAgICBnowDQYJKoZIhvcNAQELBQAwLDEWMBQGA1UEChMNZWxh\nc3RpYy1mbGVldDESMBAGA1UEAxMJbG9jYWxob3N0MB4XDTIzMDMxNDEzMTQzOFoX\nDTMzMDMxNDEzMTQzOFowMzEWMBQGA1UEChMNZWxhc3RpYy1mbGVldDEZMBcGA1UE\nAxMQaXAtMTcyLTMxLTU3LTEwOTCCASIwDQYJKoZIhvcNAQEBBQADggEPADCCAQoC\nggEBAL2xkV5OKCL9ZqFgoH7/y/xvlM6EABykXOpZjP3/+ugx/nAMA0dFaeUHU7MN\nqvMw91kgrVGkJ8nb6uRXa6PbBVY/U5QVPVC1QHxNXpo9Ye9vDaf7C336UEr12+IF\nCC12i3SyAOD5gWmckgeRDJsVIkJ+W1r5JWUkWjIB6QjQzZlX3Jz6DH92VmMKEEfe\nKaWS28O73pNjVVxh0TePL+1+ADogIiGpEIOxv0wq9q6bJcyDhBFKHhYBgCFH30W+\ns31RIt2npK9BvD5/PbpcKSKqhz1lsJOTO0YMY1KGcZWiyKQH/xkEpBaN6SpfTn7a\n/QH7J6sXed7uzWLfOlHpXKqcQ1sCAwEAAaNvMG0wDgYDVR0PAQH/BAQDAgeAMB0G\nA1UdJQQWMBQGCCsGAQUFBwMCBggrBgEFBQcDATAfBgNVHSMEGDAWgBQbcyE1Fo5b\nrmOtwGsfEN8DZkgLNDAbBgNVHREEFDASghBpcC0xNzItMzEtNTctMTA5MA0GCSqG\nSIb3DQEBCwUAA4IBAQANYSIoOoxi1epv/6u4bvNHSNEIUSBkL/+uTAAQwcrvc2/R\nA/xXphu9/DGBx17SOOz+L07NBkCsZdZFPYQ2czb58PW9uiqMIi62D3RmuMAl8clw\ng4U96cnNRB1e2ZyQHHnpOgiMeu1Mp/aUSnJJd+C5b044sMLreeukJVVGsS/Asb+w\nuzBYVcA0EHQueTwnCD9ZcqTLtMJ6RGn+eJs2qSOrDML+xcnSpdWTlF8g+wK2pBds\nVa004Y+fq0lG3eENpU3JAH5O/krIvaf2TYZvs6z0wQK5jqvyfOiSQwTe0/djlyql\nzkJV6b5n/SjRb6F9YhW+jOSrCgjrwMHYLDA4Nc+8\n-----END CERTIFICATE-----\n","Key":"[redacted]","Passphrase":""},"CipherSuites":null,"ClientAuth":0,"CurveTypes":null,"Enabled":null,"VerificationMode":"full","Versions":null},"Timeouts":{"CheckinJitter":30000000000,"CheckinLongPoll":300000000000,"CheckinTimestamp":30000000000,"Idle":30000000000,"Read":60000000000,"ReadHeader":5000000000,"Write":600000000000}},"Type":""}],"Logging":{"Files":null,"Level":"info","Pretty":false,"ToFiles":true,"ToStderr":true},"Output":{"Elasticsearch":{"APIKey":"","Headers":null,"Hosts":["ca3df1e600684321ac547810f0fa3235.europe-west1.gcp.cloud.es.io:443"],"MaxConnPerHost":128,"MaxContentLength":104857600,"MaxRetries":3,"Path":"","Protocol":"https","ProxyDisable":false,"ProxyHeaders":{},"ProxyURL":"","ServiceToken":"[redacted]","TLS":null,"Timeout":90000000000},"Extra":null}},"ecs.version":"1.6.0"}
{"log.level":"info","@timestamp":"2023-03-14T13:20:43.948Z","message":"starting server on configuration change","component":{"binary":"fleet-server","dataset":"elastic_agent.fleet_server","id":"fleet-server-default","type":"fleet-server"},"log":{"source":"fleet-server-default"},"ecs.version":"1.6.0","service.name":"fleet-server","ecs.version":"1.6.0"}
{"log.level":"info","@timestamp":"2023-03-14T13:20:43.950Z","message":"Starting stats endpoint","component":{"binary":"fleet-server","dataset":"elastic_agent.fleet_server","id":"fleet-server-default","type":"fleet-server"},"log":{"source":"fleet-server-default"},"ecs.version":"1.6.0","service.name":"fleet-server","log.logger":"fleet-metrics.api","@timestamp":"2023-03-14T13:20:43.95Z","ecs.version":"1.6.0"}
{"log.level":"info","@timestamp":"2023-03-14T13:20:44.003Z","message":"Metrics endpoint listening on: /opt/Elastic/Agent/data/tmp/fleet-server-default.sock (configured: unix:///opt/Elastic/Agent/data/tmp/fleet-server-default.sock)","component":{"binary":"fleet-server","dataset":"elastic_agent.fleet_server","id":"fleet-server-default","type":"fleet-server"},"log":{"source":"fleet-server-default"},"ecs.version":"1.6.0","service.name":"fleet-server","log.logger":"fleet-metrics.api","ecs.version":"1.6.0"}
{"log.level":"error","@timestamp":"2023-03-14T13:20:44.209Z","message":"fail elasticsearch info","component":{"binary":"fleet-server","dataset":"elastic_agent.fleet_server","id":"fleet-server-default","type":"fleet-server"},"log":{"source":"fleet-server-default"},"ecs.version":"1.6.0","service.name":"fleet-server","cluster.addr":["ca3df1e600684321ac547810f0fa3235.europe-west1.gcp.cloud.es.io:443"],"cluster.maxConnsPersHost":128,"error.message":"dial tcp: lookup ca3df1e600684321ac547810f0fa3235.europe-west1.gcp.cloud.es.io on [::1]:53: read udp [::1]:53506->[::1]:53: read: connection refused","ecs.version":"1.6.0"}
{"log.level":"info","@timestamp":"2023-03-14T13:20:44.209Z","message":"Stats endpoint (/opt/Elastic/Agent/data/tmp/fleet-server-default.sock) finished: accept unix /opt/Elastic/Agent/data/tmp/fleet-server-default.sock: use of closed network connection","component":{"binary":"fleet-server","dataset":"elastic_agent.fleet_server","id":"fleet-server-default","type":"fleet-server"},"log":{"source":"fleet-server-default"},"log.logger":"fleet-metrics.api","ecs.version":"1.6.0","service.name":"fleet-server","ecs.version":"1.6.0"}
{"log.level":"info","@timestamp":"2023-03-14T13:20:44.209Z","message":"Error - dial tcp: lookup ca3df1e600684321ac547810f0fa3235.europe-west1.gcp.cloud.es.io on [::1]:53: read udp [::1]:53506->[::1]:53: read: connection refused","component":{"binary":"fleet-server","dataset":"elastic_agent.fleet_server","id":"fleet-server-default","type":"fleet-server"},"log":{"source":"fleet-server-default"},"state":"FAILED","ecs.version":"1.6.0","service.name":"fleet-server","ecs.version":"1.6.0"}
{"log.level":"error","@timestamp":"2023-03-14T13:20:44.210Z","message":"Fleet Server failed","component":{"binary":"fleet-server","dataset":"elastic_agent.fleet_server","id":"fleet-server-default","type":"fleet-server"},"log":{"source":"fleet-server-default"},"ecs.version":"1.6.0","service.name":"fleet-server","error.message":"dial tcp: lookup ca3df1e600684321ac547810f0fa3235.europe-west1.gcp.cloud.es.io on [::1]:53: read udp [::1]:53506->[::1]:53: read: connection refused","@timestamp":"2023-03-14T13:20:44.21Z","ecs.version":"1.6.0"}
{"log.level":"error","@timestamp":"2023-03-14T13:20:44.210Z","log.origin":{"file.name":"coordinator/coordinator.go","file.line":857},"message":"Unit state changed fleet-server-default-fleet-server-fleet_server-5cc1bc7e-20d8-4174-9af3-4023ec1cd024 (STARTING->FAILED): Error - dial tcp: lookup ca3df1e600684321ac547810f0fa3235.europe-west1.gcp.cloud.es.io on [::1]:53: read udp [::1]:53506->[::1]:53: read: connection refused","log":{"source":"elastic-agent"},"component":{"id":"fleet-server-default","state":"HEALTHY"},"unit":{"id":"fleet-server-default-fleet-server-fleet_server-5cc1bc7e-20d8-4174-9af3-4023ec1cd024","type":"input","state":"FAILED","old_state":"STARTING"},"ecs.version":"1.6.0"}
{"log.level":"error","@timestamp":"2023-03-14T13:20:44.210Z","log.origin":{"file.name":"coordinator/coordinator.go","file.line":857},"message":"Unit state changed fleet-server-default (STARTING->FAILED): Error - dial tcp: lookup ca3df1e600684321ac547810f0fa3235.europe-west1.gcp.cloud.es.io on [::1]:53: read udp [::1]:53506->[::1]:53: read: connection refused","log":{"source":"elastic-agent"},"component":{"id":"fleet-server-default","state":"HEALTHY"},"unit":{"id":"fleet-server-default","type":"output","state":"FAILED","old_state":"STARTING"},"ecs.version":"1.6.0"}I suspect Fleet server isn't reliably reporting the failed state here. @michel-laterman is this something we can improve? |
|
@dikshachauhan-qasource per my comment in #2431 (comment) this doesn't seem like a bug in the agent, DNS look ups for Elasticsearch on Fleet server are failing. Is this reproducible? If it is, was there any special network configuration that had to be set up? |
|
Hi @cmacknz We have reproduced this issue on 8.7.0 BC6 and found it still reproducible.
Build details: Screenshot:
Please let us know if we are missing anything you require. Thanks |


|
Thank you, so the machine can still resolve the hostname but the agent can't. That is very strange. |
|
Hi @cmacknz We have revalidated this issue on latest 8.8 BC6 kibana cloud build and found it still reproducible. Observations:
Build details: Screen-shot Agent Diagnostic logs: Please let us know if anything else is required from our end. Thanks! |

|
If we hadn't already released this bug I would consider this a blocker. Moving this to the Fleet Server area and adding to the current sprint as a P1. FYI @jlind23 |
|
I'm seeing the same ES connection and DNS lookup failure errors in the latest diagnostics. EDIT: I found that the DNS lookup error is temporary, and the connection to ES is established after that. I could reproduce the issue with a SLES VM and enrolling it to a staging cloud instance. After the VM reboot, I still see Agent logs and metrics showing up in Kibana, though the status is Offline, so looks like the Seeing these errors as well, which indicates that the fleet-server is not started on port 8221. I tried doing an agent restart and then the agent went back to HEALTHY status. I think what seems to happen is that after reboot, the fleet-server process tries to start, but hits the temporary DSN lookup issue, and remains in stopped state. Is there any retry logic which should kick in? Any ideas @michel-laterman @cmacknz ? |
|
Thank you for looking into this issue. We have installed SLES 15 fleet server host on 8.8.0 BC6 Kibana Cloud Build. Impacted Testcase: Please let us know if anything else is required from our end. Thanks! |
|
@harshitgupta-qasource Do we have the same testcase on a different OS where the agent is back healthy after reboot? |
|
@juliaElastic Fleet server might not be handling the error properly if it can't reach ES at init time. The fleet-server/internal/pkg/es/client.go Lines 51 to 57 in 247c4bd This is called by fleet-server/internal/pkg/server/fleet.go Lines 360 to 364 in 247c4bd That error eventually gets handled in the fleet-server/internal/pkg/server/fleet.go Lines 192 to 195 in 247c4bd I can see the {"log.level":"error","@timestamp":"2023-05-23T07:05:50.409Z","message":"Fleet Server failed","component":{"binary":"fleet-server","dataset":"elastic_agent.fleet_server","id":"fleet-server-default","type":"fleet-server"},"log":{"source":"fleet-server-default"},"ecs.version":"1.6.0","service.name":"fleet-server","error.message":"dial tcp: lookup 34e1583f2a2a41b09e9d33d9d390def6.europe-west1.gcp.cloud.es.io on [::1]:53: read udp [::1]:38455->[::1]:53: read: connection refused","ecs.version":"1.6.0"}The function should just be called again 2s later, and I can see the Fleet server transition back to configuring 2s later the logs but nothing else happens afterwards. It's possible some of the state wasn't cleaned up properly to actually let it recover. {"log.level":"info","@timestamp":"2023-05-23T07:05:52.415Z","log.origin":{"file.name":"coordinator/coordinator.go","file.line":972},"message":"Unit state changed fleet-server-default-fleet-server-fleet_server-93fbe5b0-f937-11ed-af24-a79b52bd536f (FAILED->CONFIGURING): Re-configuring","log":{"source":"elastic-agent"},"component":{"id":"fleet-server-default","state":"HEALTHY"},"unit":{"id":"fleet-server-default-fleet-server-fleet_server-93fbe5b0-f937-11ed-af24-a79b52bd536f","type":"input","state":"CONFIGURING","old_state":"FAILED"},"ecs.version":"1.6.0"}fleet-server/internal/pkg/server/agent.go Lines 288 to 298 in 247c4bd |
|
I wonder if Fleet server is deadlocked. You can look at the goroutine profile with |
|
We have test cases for setting up the fleet server on various OSs for kibana cloud build and rebooting the fleet server as part of exploratory testing. We have re-validated this issue on the 8.8 BC8 kibana cloud build with Windows and Ubuntu fleet server agents. We have observed that after restarting these fleet servers, the fleet server agent came back Healthy. So the issue is only reproducible for the SLES15 Fleet server. Testcases for setup Fleet server:Please let us know if anything else is required from our end. Thanks! |
|
I'm skeptical that this is truly a SLES-specific issue, though maybe with the default configuration it's more likely to happen with SLES OOTB. It seems likely that this can happen on other systems if they hit a DNS lookup failure on startup. We definitely need to be resilient to such errors, so I'm inclined to leave this as a high priority issue that should be fixed relatively soon. |
|
@michel-laterman will you have time to take a look at this as soon as you can? |
|
@michel-laterman assigning this to you in this sprint. |
|
I'm digging into this. I can recreate on an AWS SLES15 instance with the latest 8.9.0-SNAPSHOT and see all the same symptoms as reported. Here it fails on the initial startup, and restarts, but the fleet-server is not reporting the failed state on that attempt: I think we need more robust handling around how elasticsearch readiness is detected by the fleet-server (which is the same issue as #2683 that @jsoriano is assigned to). |
|
Actually, I think there is a deadlock occuring, but I'm not sure why. We can see on the instance that this occurs that fleet-server is running, however the ports are not being used (internal/external api and metrics). |
For a deadlock you should be able to spot it with just the goroutine profile if you have that already. That will give you the stack trace of every goroutine. The diagnostics collect it by default. |
|
I think I found the issue, our error channel is being created on each iteration of the run loop: https://github.com/elastic/fleet-server/blob/main/internal/pkg/server/fleet.go#L136 However, runServer call actually occurs in a different goroutine: https://github.com/elastic/fleet-server/blob/main/internal/pkg/server/fleet.go#L117. Which can lead to a config change being read before the runServer method is ran and leaking a channel; the error passed to the channel is lost and thus the fleet-server is stuck as it should signal that it's failed but has not. I've added some logging around the error channel to try to show what's going on: |
I think we should commit these in as debug logs. |
|
Upon reviewing these discussions, I recently executed a "systemctl restart elastic-agent" command on the fleet server. I find myself needing to perform this action after every machine reboot. Consequently, I have created a cronjob to automatically handle this task until a permanent solution is implemented. |
|
The fix should be in 8.9.0 |
|
Hi Team, We have re-validated this issue on the latest 8.9.0 BC3 Kibana cloud environment and found it fixed now. Observations:
Build details: Screen-shot: Hence, we are marking this issue as QA: Validated. Thanks |

|
Hi, I reported this issue months ago (RHEL 8) and I solved just adding After=syslog.target network.target in /etc/systemd/system/elastic-agent.service Hope it helps! |
|
HI @SINOX22 tried your solution on my RHEL 8 and it still showing Offline Status. |
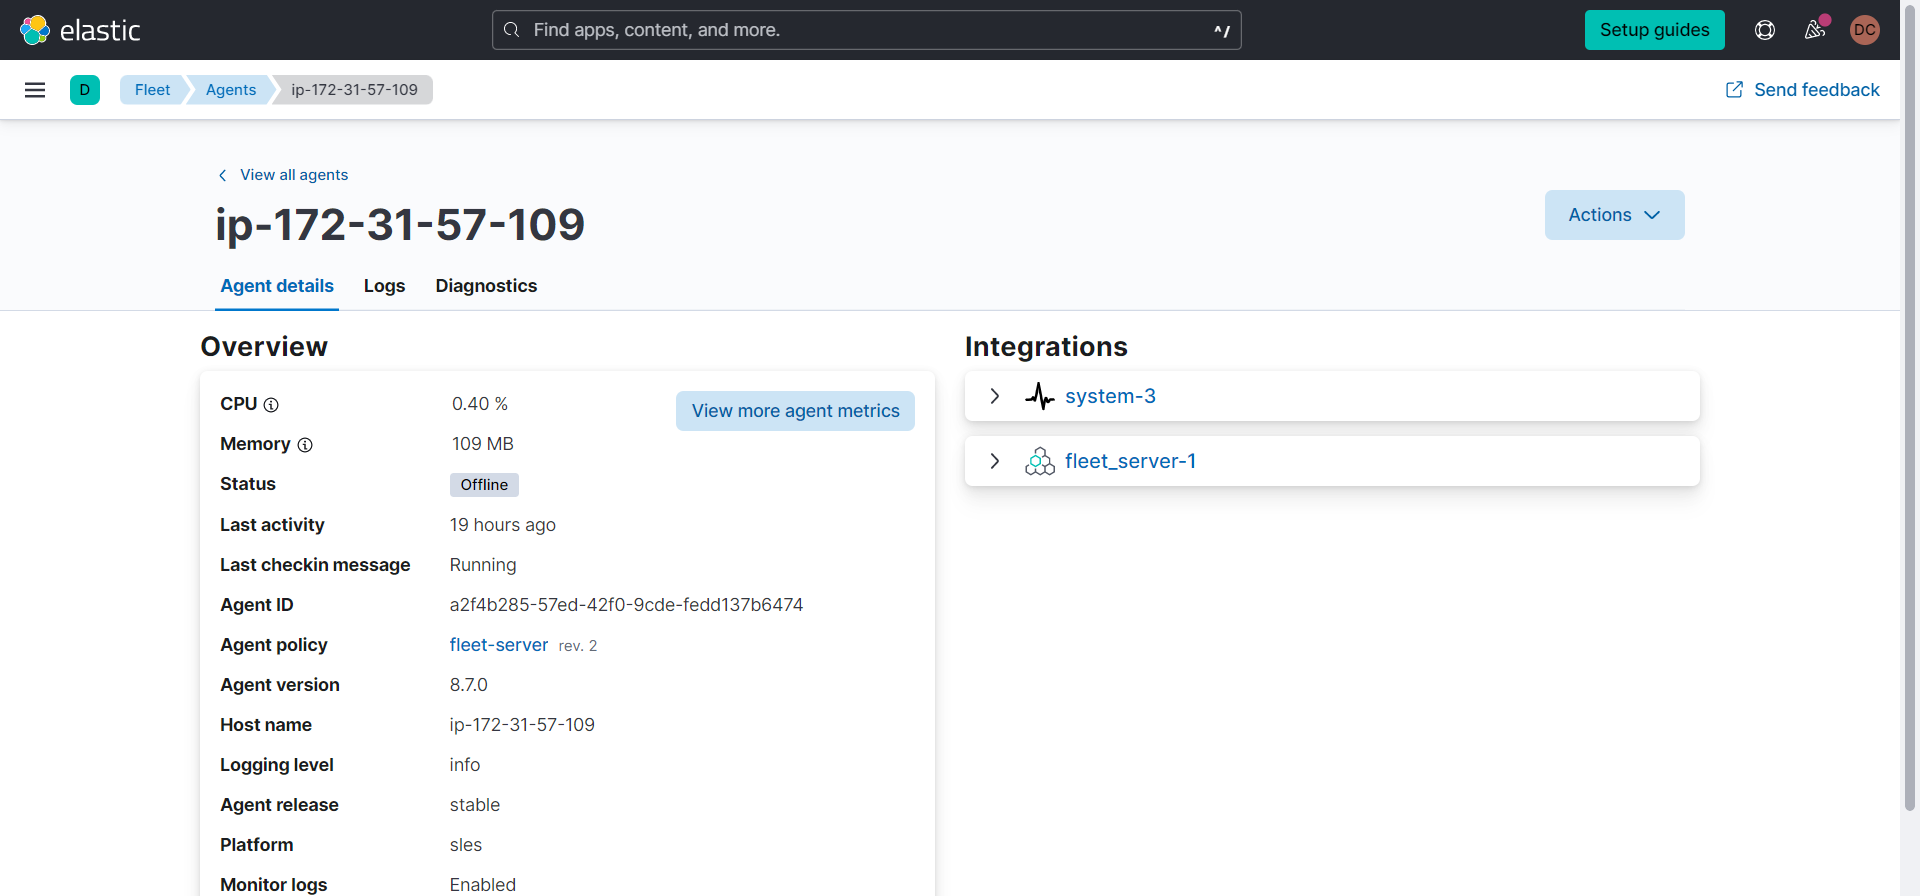
Kibana version: 8.7.0 Prod Kibana cloud environment
Host OS: SLES
Build details:
VERSION: 8.7.0 BC5
BUILD: 61017
COMMIT: e70452f9697a18a8458f3d4618e001b7e3681bed
Artifact: https://staging.elastic.co/8.7.0-69b36bf6/summary-8.7.0.html
Preconditions:
Steps to reproduce:
Screenshots:
Testcase Reference:
https://elastic.testrail.io/index.php?/tests/view/2056682
Logs:
elastic-agent-diagnostics-2023-03-15T08-11-08Z-00.zip
The text was updated successfully, but these errors were encountered: