New Visual Editor #17076
Comments
|
Summary of mockup meeting in EAH: General new layout for the editor
|

|
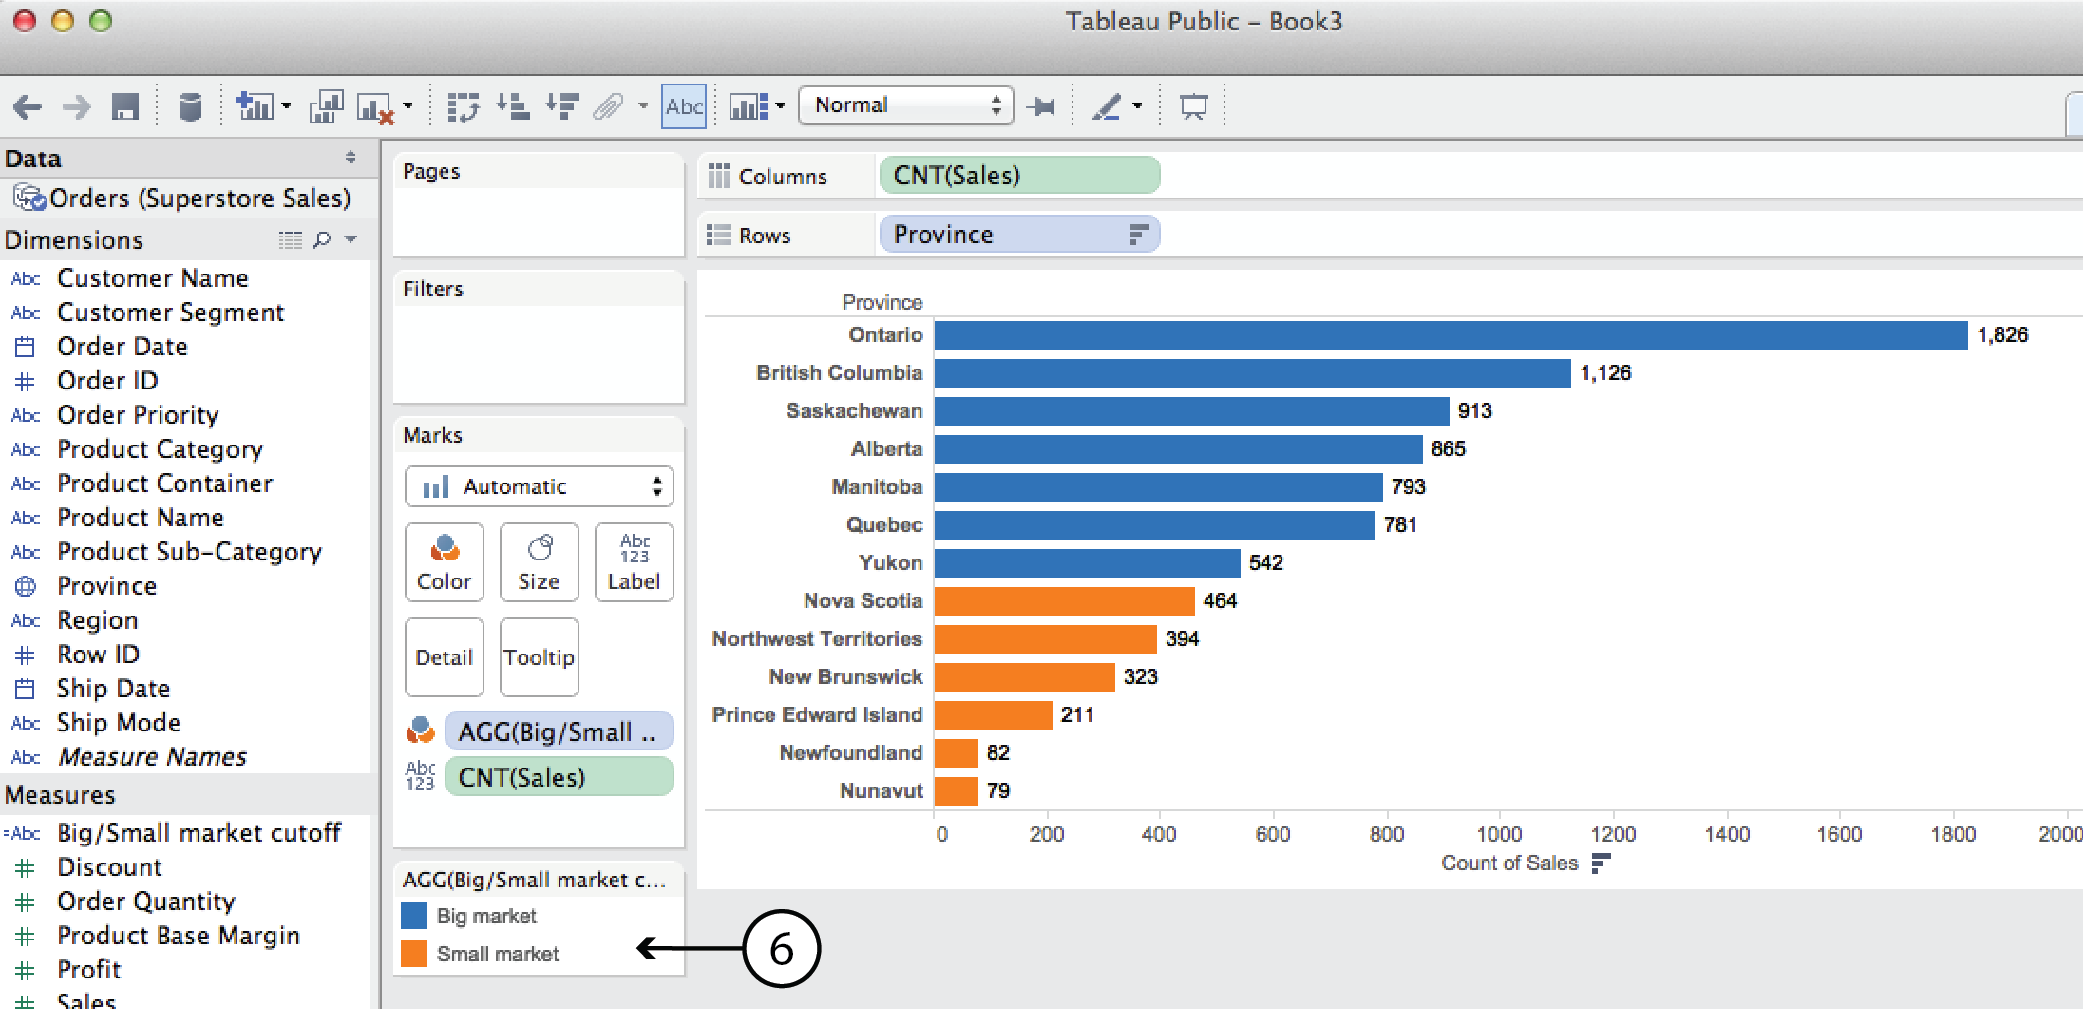
Requirements: data first approachMost of the times users don’t know what chart type to start it, but rather know what data they want to represent. We want to try a data first approach with the new editor (similar to Tableau) where you first select the fields you are interested in and are allowed to switch between the chart types after. Identified components: easy switching between chartsThis is one of the main complains about the current editor. Tableau way of switching between different kind of charts is very easy to use so we could try something in that direction. Identified components: switching between index patternsAnother big complaint about the current editor. Identified components: easy access to view sample dataTo build visualization users move back and forth between Discover and visualize to find the fields needed for a visualization, few users mentioned they always work with 2 tabs open when trying to create a visualization, one for Discover and one for Visualize Identified component: building aggregationsWe need to support building aggregations. As we can see in our current editor that is quite a complicated process. We need to define what kind of aggregation we want to run and what field to run it on. There might also be (many) additional parameters to each aggregation. With each aggregation we also need to define what the results represent (splits, x-axis, y-axis, color, size, tooltip, level). Identified components: changing data sourcesIn first step i see this as ability to change between the es aggregations and as documents. When doing so the Data editor (with aggregation configurator if your datasource is es aggregations) is replaced by another Data editor for es documents. Identified components: support for multiple indexesOr general support for multiple datasources ? pipeline configurationIf we are going to base new editor on the new pipeline approach we might want to expose the pipeline expression as well. Identified components: chart configurationThis will require to expose many confiugration options so it needs to be extendable on many levels. Accordions or Modals could give us that Identified components: |
|
@ppisljar, that google doc is not public. |
|
thanks, i removed it for now, we plan to bring its content to this issue in a week or so. |
|
Linking the FT visual vocabulary here, as it's in line with the vision of starting from wants and needs, rather than the means: https://github.com/ft-interactive/chart-doctor/tree/master/visual-vocabulary pls correct me if it's one of the docs already
|

|
Just wanted to add a perspective based on my experience in the field helping people use Kibana for the first time. First, I love this new 'simple and familiar' approach as well as using Tableau as an example UI. As already pointed out in the issue by Alona, most people are unfamiliar with search industry and Elasticsearch terminology. While we do have to respect those who use the platform today and their understanding of it, we may also want to consider folks who come from a database background, or business users who may be unfamiliar with both sets of terminology. The issue has "Prior knowledge of Elastic aggregation terms is needed (term, significant term, top hits etc..)" listed. However, in the design screenshot we are still using the term "index" to reference data, which is an 'inside the bubble' Elasticsearch / Search term. In my experience, most first time users are confused by terms like 'Index' where a database person would expect to see 'Table' and a business person my be more comfortable with 'Data'. Tableau is referenced in the issue as well and they use Data as the top level identifier for finding data. It's simple and everyone will get it. The developer will understand index, table, and data. The business guy will understand data better. Can we use it? |
|
I'll agree that "index" is very much inside the ES bubble. However, I think there may not be much we can do around that mainly when it comes to allowing the user to choose a data source that may not be an ES index. For instance, we might be able to allow them to upload a CSV or point to a URL of JSON data. I think the generalized "Data source" will be used, but then you have to specifically choose what that data source is and one of them may need to be "Elasticsearch index". We won't be able to generalize "Index" as "Data". |
|
Understood, what about just using 'Data' or 'Data Source' as the higher context with JSON, URL, CSV, ES Index as the sub context? Here is an example screenshot from Tableau (see top left tab). Or, is this what you mean by using the generalize "Data source" will be used. |
|
Yeah, that's what I was trying to explain with the "Data Source". Like:
|
|
The first version of Lens has been releases into beta now, and thus we'll be closing this issue. You can further track Lens progress via the following issues:
|
We track a lot of challenges and ideas in the New Visualize Editor project.
What are we trying to solve?
User perspective:
becomes a bigger problem as more users starting to use Kibana which are not familiar with ES
and mainly uses Kibana to explore their data
Infrastructure:
Process:
UX First Phase Suggestion:
The user can switch between different visualizations types - initially, we can provide 2 visualizations that users can switch between. These visualizations can be 2 of our existing visualizations that have similarities which will allow easy switching (line to area or area to bar chart). That can give us more time to absorb feedback before we address other types of visualizations that might have different structure (pie chart, table etc...)
The user will be able to switch between different index pattern:
- If the same field name exists it will populate it with the new index
- If the field name doesn't exist in the new index, the visual editor will have empty fields which the
users will be able to fill manually
- Advance feature for index pattern where instead of selecting the index name from a drop down
users can type their index pattern name similar to TSVB, which will allow using multiple indices
Usability first stab :
Fields preview in the visual editor screen which will allow seeing possible values of the index.
Visual ability to quickly differentiate between fields type (numbers, strings, dates, IP etc..)
Simple auto populate visualization from the beginning so users are not landing on an empty screen (e.g use timestamp in line chart and other popular values)
Basic auto fill of aggregation type based on the field which users can edit based on the field type e.g(sum, count etc...)
Basic visualization formatting :
Legend position
Legend title
Axis: vertical or horizontal - titles
Checkbox to show values on visualization, on top of a stacked bar, line chart or pie
Future wish list:
@elastic/kibana-visualizations
The text was updated successfully, but these errors were encountered: