[Security Solution] [Attack discovery] Fixes zero connectors and zero alerts empty states #182904
Conversation
|
Pinging @elastic/security-solution (Team: SecuritySolution) |
x-pack/plugins/security_solution/public/attack_discovery/pages/helpers.ts
Show resolved
Hide resolved
x-pack/plugins/security_solution/public/attack_discovery/pages/index.tsx
Show resolved
Hide resolved
x-pack/plugins/security_solution/public/attack_discovery/pages/no_alerts/index.tsx
Outdated
Show resolved
Hide resolved
There was a problem hiding this comment.
Checked out, tested locally, and code reviewed -- LGTM! Thanks for the added tests and cleaned up flow @andrew-goldstein! 🎉
Added a couple nits, one around updating docs location (should be fine as-as for now though), and one little bug I found myself in around the connector selector. I was deleting localStorage keys, so not sure if it's a real issue users would find themselves in. I will continue to try and repro and post steps on the comment.
c0af48a
to
50f32bc
Compare
…ero alerts empty states ### Summary This PR fixes usability issues in _Attack discovery_ by displaying an [Empty prompt](https://eui.elastic.co/#/display/empty-prompt) for the "zero connectors" and "zero alerts" states. - When there are zero connectors configured, the empty prompt in the following screenshot is displayed: 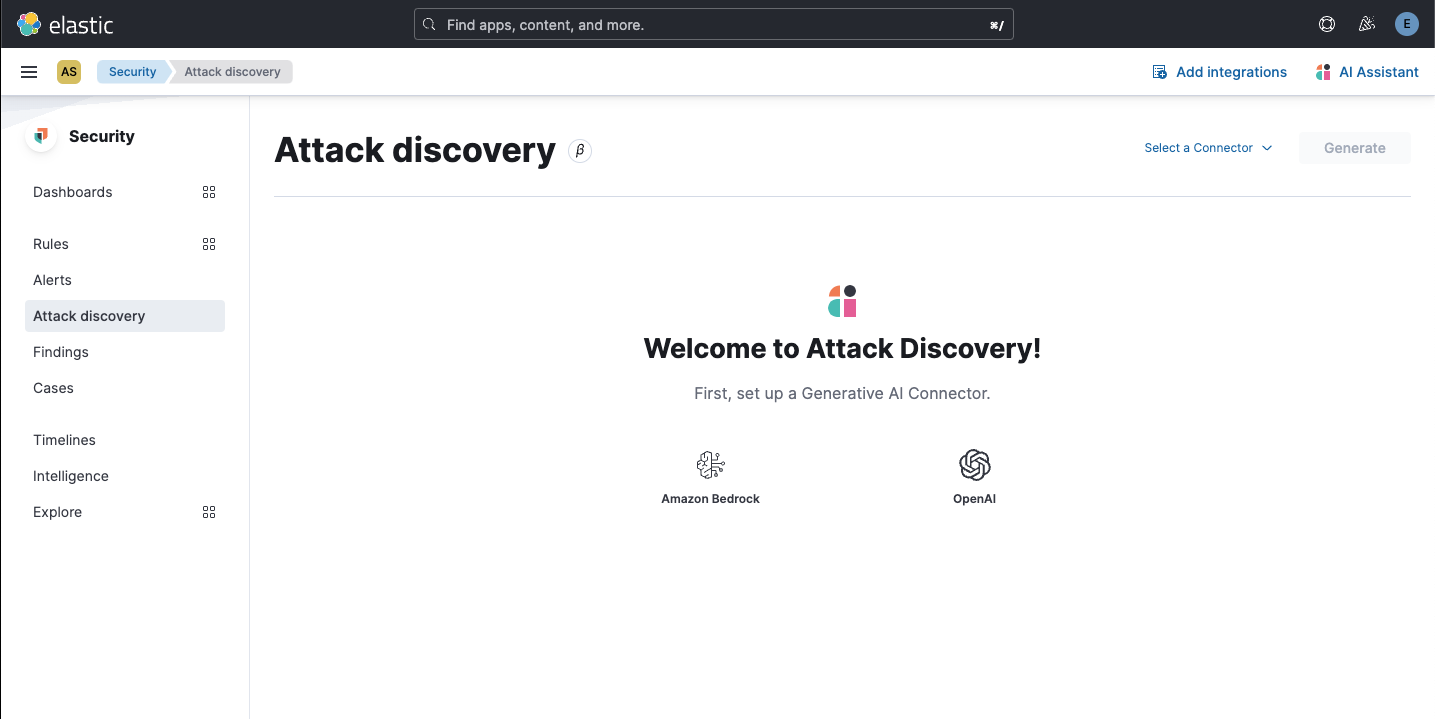 - When there are zero open alerts in the last 24 hours to send to the LLM, the empty prompt in the following screenshot is displayed: 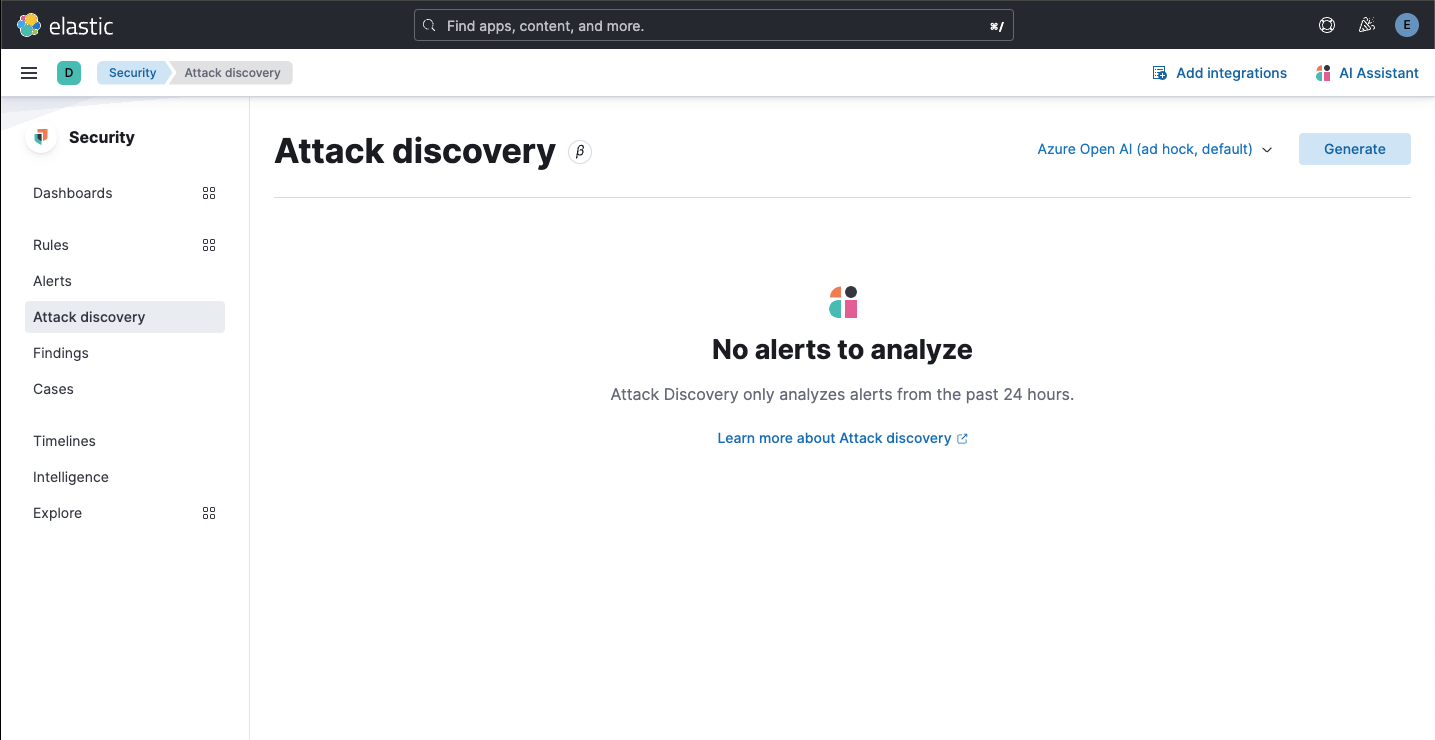 The fix for the "no alerts" state required returning an additional stat, the number of alerts sent as context to the LLM: ``` alertsContextCount ``` The `alertsContextCount` stat is now included in telemetry. ### Desk testing The `Test setup` section describes how to reproduce the states necessary to desk test this PR in an existing environment. The `Steps to verify` section updates the test environment from zero to one connector. The connector will then be used to test the zero alerts state. #### Test setup Testing this fix requires no alerts, and no connectors. This section describes how to reset an existing environment (both the deployment and the browser) to test these states. 1. Navigate to Security > Alerts 2. If there are alerts in the last 24 hours, create and login to a new space, because zero alerts are required. 3. Navigate to Stack Management > Connectors 4. Delete any `OpenAI` or `Bedrock` connectors (tagged with `Generative AI for Security`) 5. Remove any pre-configured connectors from `kibana.dev.yml` 6. Clear local storage (to remove any trace of previously selected connectors) 7. Close all browser tabs with a current session to Kibana (to clear session storage) 8. Restart Kibana server #### Steps to verify 1. Navigate to Security > Alerts **Expected result** - There are zero open alerts in the last 24 hours 2. Navigate to Security > Attack discovery **Expected result** - The following empty prompt is displayed:  3. Click `OpenAI` **Expected result** - The OpenAI connector modal is displayed 4. Enter the new connector details, and then click `Save` **Expected results** - A toast is displayed, confirming the new connector was successfully created - The newly-created connector is selected in the connector selector - The `Up to 20 alerts will be analyzed` empty state in the following screenshot is displayed: 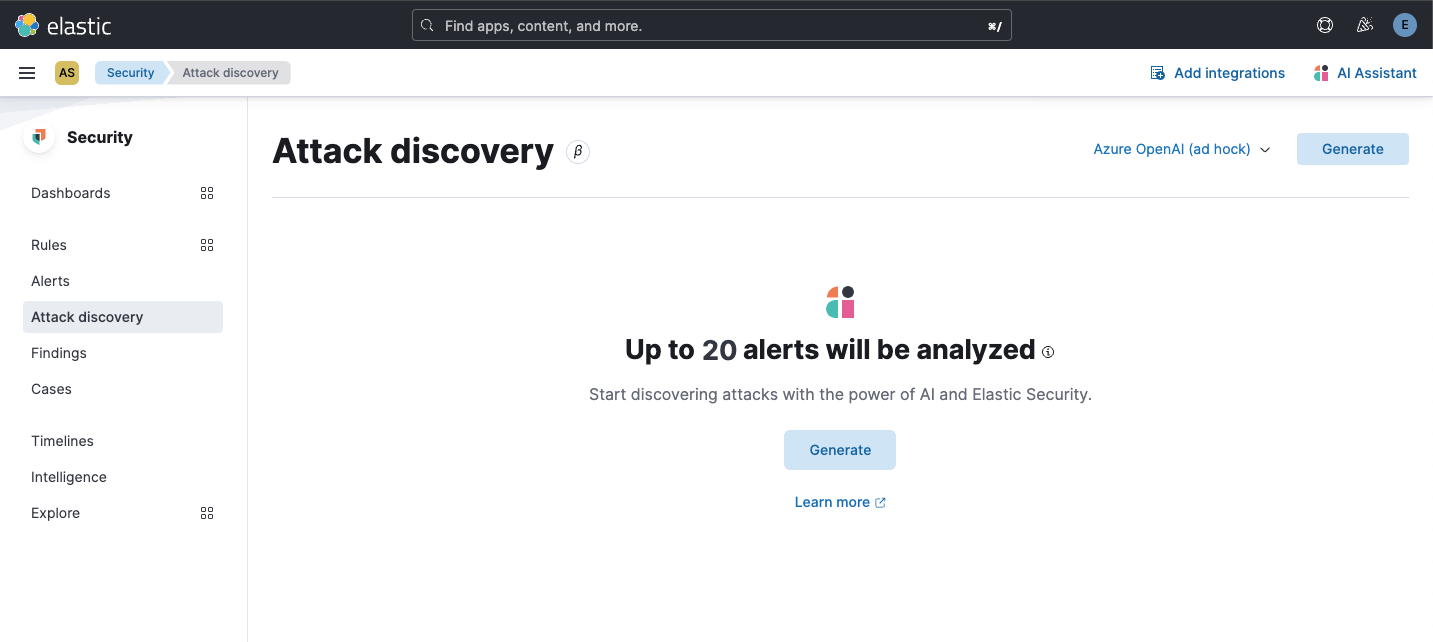 5. Click `Generate` **Expected result** - The `No alerts to analyze` empty state (for zero alerts sent as context to the LLM) is displayed:  6. Generate some alerts 7. Navigate to Security > Alerts **Expected result** - Alerts in the last 24 hours are now available (as shown by the Alerts page) 8. Once again, navigate to Security > Attack discovery **Expected result** - The `Up to 20 alerts will be analyzed` empty state is displayed 9. Once again, click `Generate` **Expected results** - The `Attack discovery in progress` loading callout is displayed - Attack discoveries are created for the alerts (when applicable)
50f32bc
to
7f1d99c
Compare
💚 Build Succeeded
Metrics [docs]Module Count
Async chunks
Page load bundle
History
To update your PR or re-run it, just comment with: |
💔 All backports failed
Manual backportTo create the backport manually run: Questions ?Please refer to the Backport tool documentation |
💚 All backports created successfully
Note: Successful backport PRs will be merged automatically after passing CI. Questions ?Please refer to the Backport tool documentation |

… alerts empty states (elastic#182904) ## [Security Solution] [Attack discovery] Fixes zero connectors and zero alerts empty states ### Summary This PR fixes usability issues in _Attack discovery_ by displaying an [Empty prompt](https://eui.elastic.co/#/display/empty-prompt) for the "zero connectors" and "zero alerts" states. - When there are zero connectors configured, the empty prompt in the following screenshot is displayed:  - When there are zero open alerts in the last 24 hours to send to the LLM, the empty prompt in the following screenshot is displayed:  The fix for the "no alerts" state required returning an additional stat, the number of alerts sent as context to the LLM: ``` alertsContextCount ``` The `alertsContextCount` stat is now included in telemetry. ### Desk testing The `Test setup` section describes how to reproduce the states necessary to desk test this PR in an existing environment. The `Steps to verify` section updates the test environment from zero to one connector. The connector will then be used to test the zero alerts state. #### Test setup Testing this fix requires no alerts, and no connectors. This section describes how to reset an existing environment (both the deployment and the browser) to test these states. 1. Navigate to Security > Alerts 2. If there are alerts in the last 24 hours, create and login to a new space, because zero alerts are required. 3. Navigate to Stack Management > Connectors 4. Delete any `OpenAI` or `Bedrock` connectors (tagged with `Generative AI for Security`) 5. Remove any pre-configured connectors from `kibana.dev.yml` 6. Clear local storage (to remove any trace of previously selected connectors) 7. Close all browser tabs with a current session to Kibana (to clear session storage) 8. Restart Kibana server #### Steps to verify 1. Navigate to Security > Alerts **Expected result** - There are zero open alerts in the last 24 hours 2. Navigate to Security > Attack discovery **Expected result** - The following empty prompt is displayed:  3. Click `OpenAI` **Expected result** - The OpenAI connector modal is displayed 4. Enter the new connector details, and then click `Save` **Expected results** - A toast is displayed, confirming the new connector was successfully created - The newly-created connector is selected in the connector selector - The `Up to 20 alerts will be analyzed` empty state in the following screenshot is displayed:  5. Click `Generate` **Expected result** - The `No alerts to analyze` empty state (for zero alerts sent as context to the LLM) is displayed:  6. Generate some alerts 7. Navigate to Security > Alerts **Expected result** - Alerts in the last 24 hours are now available (as shown by the Alerts page) 8. Once again, navigate to Security > Attack discovery **Expected result** - The `Up to 20 alerts will be analyzed` empty state is displayed 9. Once again, click `Generate` **Expected results** - The `Attack discovery in progress` loading callout is displayed - Attack discoveries are created for the alerts (when applicable) (cherry picked from commit 6f4d423)
…nd zero alerts empty states (#182904) (#182999) # Backport This will backport the following commits from `main` to `8.14`: - [[Security Solution] [Attack discovery] Fixes zero connectors and zero alerts empty states (#182904)](#182904) <!--- Backport version: 8.9.8 --> ### Questions ? Please refer to the [Backport tool documentation](https://github.com/sqren/backport) <!--BACKPORT [{"author":{"name":"Andrew Macri","email":"andrew.macri@elastic.co"},"sourceCommit":{"committedDate":"2024-05-08T20:13:19Z","message":"[Security Solution] [Attack discovery] Fixes zero connectors and zero alerts empty states (#182904)\n\n## [Security Solution] [Attack discovery] Fixes zero connectors and zero alerts empty states\r\n\r\n### Summary\r\n\r\nThis PR fixes usability issues in _Attack discovery_ by displaying an [Empty prompt](https://eui.elastic.co/#/display/empty-prompt) for the \"zero connectors\" and \"zero alerts\" states.\r\n\r\n- When there are zero connectors configured, the empty prompt in the following screenshot is displayed:\r\n\r\n\r\n\r\n- When there are zero open alerts in the last 24 hours to send to the LLM, the empty prompt in the following screenshot is displayed:\r\n\r\n\r\n\r\nThe fix for the \"no alerts\" state required returning an additional stat, the number of alerts sent as context to the LLM:\r\n\r\n```\r\nalertsContextCount\r\n```\r\n\r\nThe `alertsContextCount` stat is now included in telemetry.\r\n\r\n### Desk testing\r\n\r\nThe `Test setup` section describes how to reproduce the states necessary to desk test this PR in an existing environment.\r\n\r\nThe `Steps to verify` section updates the test environment from zero to one connector. The connector will then be used to test the zero alerts state.\r\n\r\n#### Test setup\r\n\r\nTesting this fix requires no alerts, and no connectors. This section describes how to reset an existing environment (both the deployment and the browser) to test these states.\r\n\r\n1. Navigate to Security > Alerts\r\n\r\n2. If there are alerts in the last 24 hours, create and login to a new space, because zero alerts are required.\r\n\r\n3. Navigate to Stack Management > Connectors\r\n\r\n4. Delete any `OpenAI` or `Bedrock` connectors (tagged with `Generative AI for Security`)\r\n\r\n5. Remove any pre-configured connectors from `kibana.dev.yml`\r\n\r\n6. Clear local storage (to remove any trace of previously selected connectors)\r\n\r\n7. Close all browser tabs with a current session to Kibana (to clear session storage)\r\n\r\n8. Restart Kibana server\r\n\r\n#### Steps to verify\r\n\r\n1. Navigate to Security > Alerts\r\n\r\n**Expected result**\r\n\r\n- There are zero open alerts in the last 24 hours\r\n\r\n2. Navigate to Security > Attack discovery\r\n\r\n**Expected result**\r\n\r\n- The following empty prompt is displayed:\r\n\r\n\r\n\r\n3. Click `OpenAI`\r\n\r\n**Expected result**\r\n\r\n- The OpenAI connector modal is displayed\r\n\r\n4. Enter the new connector details, and then click `Save`\r\n\r\n**Expected results**\r\n\r\n- A toast is displayed, confirming the new connector was successfully created\r\n- The newly-created connector is selected in the connector selector\r\n- The `Up to 20 alerts will be analyzed` empty state in the following screenshot is displayed:\r\n\r\n\r\n\r\n5. Click `Generate`\r\n\r\n**Expected result**\r\n\r\n- The `No alerts to analyze` empty state (for zero alerts sent as context to the LLM) is displayed:\r\n\r\n\r\n\r\n6. Generate some alerts\r\n\r\n7. Navigate to Security > Alerts\r\n\r\n**Expected result**\r\n\r\n- Alerts in the last 24 hours are now available (as shown by the Alerts page)\r\n\r\n8. Once again, navigate to Security > Attack discovery\r\n\r\n**Expected result**\r\n\r\n- The `Up to 20 alerts will be analyzed` empty state is displayed\r\n\r\n9. Once again, click `Generate`\r\n\r\n**Expected results**\r\n\r\n- The `Attack discovery in progress` loading callout is displayed\r\n- Attack discoveries are created for the alerts (when applicable)","sha":"6f4d423321d1834c6516a64086d24c21175da9a7","branchLabelMapping":{"^v8.15.0$":"main","^v(\\d+).(\\d+).\\d+$":"$1.$2"}},"sourcePullRequest":{"labels":["bug","release_note:skip","Team: SecuritySolution","Team:Security Generative AI","v8.14.0","v8.15.0","Feature:Attack Discovery"],"number":182904,"url":"#182904 Solution] [Attack discovery] Fixes zero connectors and zero alerts empty states (#182904)\n\n## [Security Solution] [Attack discovery] Fixes zero connectors and zero alerts empty states\r\n\r\n### Summary\r\n\r\nThis PR fixes usability issues in _Attack discovery_ by displaying an [Empty prompt](https://eui.elastic.co/#/display/empty-prompt) for the \"zero connectors\" and \"zero alerts\" states.\r\n\r\n- When there are zero connectors configured, the empty prompt in the following screenshot is displayed:\r\n\r\n\r\n\r\n- When there are zero open alerts in the last 24 hours to send to the LLM, the empty prompt in the following screenshot is displayed:\r\n\r\n\r\n\r\nThe fix for the \"no alerts\" state required returning an additional stat, the number of alerts sent as context to the LLM:\r\n\r\n```\r\nalertsContextCount\r\n```\r\n\r\nThe `alertsContextCount` stat is now included in telemetry.\r\n\r\n### Desk testing\r\n\r\nThe `Test setup` section describes how to reproduce the states necessary to desk test this PR in an existing environment.\r\n\r\nThe `Steps to verify` section updates the test environment from zero to one connector. The connector will then be used to test the zero alerts state.\r\n\r\n#### Test setup\r\n\r\nTesting this fix requires no alerts, and no connectors. This section describes how to reset an existing environment (both the deployment and the browser) to test these states.\r\n\r\n1. Navigate to Security > Alerts\r\n\r\n2. If there are alerts in the last 24 hours, create and login to a new space, because zero alerts are required.\r\n\r\n3. Navigate to Stack Management > Connectors\r\n\r\n4. Delete any `OpenAI` or `Bedrock` connectors (tagged with `Generative AI for Security`)\r\n\r\n5. Remove any pre-configured connectors from `kibana.dev.yml`\r\n\r\n6. Clear local storage (to remove any trace of previously selected connectors)\r\n\r\n7. Close all browser tabs with a current session to Kibana (to clear session storage)\r\n\r\n8. Restart Kibana server\r\n\r\n#### Steps to verify\r\n\r\n1. Navigate to Security > Alerts\r\n\r\n**Expected result**\r\n\r\n- There are zero open alerts in the last 24 hours\r\n\r\n2. Navigate to Security > Attack discovery\r\n\r\n**Expected result**\r\n\r\n- The following empty prompt is displayed:\r\n\r\n\r\n\r\n3. Click `OpenAI`\r\n\r\n**Expected result**\r\n\r\n- The OpenAI connector modal is displayed\r\n\r\n4. Enter the new connector details, and then click `Save`\r\n\r\n**Expected results**\r\n\r\n- A toast is displayed, confirming the new connector was successfully created\r\n- The newly-created connector is selected in the connector selector\r\n- The `Up to 20 alerts will be analyzed` empty state in the following screenshot is displayed:\r\n\r\n\r\n\r\n5. Click `Generate`\r\n\r\n**Expected result**\r\n\r\n- The `No alerts to analyze` empty state (for zero alerts sent as context to the LLM) is displayed:\r\n\r\n\r\n\r\n6. Generate some alerts\r\n\r\n7. Navigate to Security > Alerts\r\n\r\n**Expected result**\r\n\r\n- Alerts in the last 24 hours are now available (as shown by the Alerts page)\r\n\r\n8. Once again, navigate to Security > Attack discovery\r\n\r\n**Expected result**\r\n\r\n- The `Up to 20 alerts will be analyzed` empty state is displayed\r\n\r\n9. Once again, click `Generate`\r\n\r\n**Expected results**\r\n\r\n- The `Attack discovery in progress` loading callout is displayed\r\n- Attack discoveries are created for the alerts (when applicable)","sha":"6f4d423321d1834c6516a64086d24c21175da9a7"}},"sourceBranch":"main","suggestedTargetBranches":["8.14"],"targetPullRequestStates":[{"branch":"8.14","label":"v8.14.0","labelRegex":"^v(\\d+).(\\d+).\\d+$","isSourceBranch":false,"state":"NOT_CREATED"},{"branch":"main","label":"v8.15.0","labelRegex":"^v8.15.0$","isSourceBranch":true,"state":"MERGED","url":"#182904 Solution] [Attack discovery] Fixes zero connectors and zero alerts empty states (#182904)\n\n## [Security Solution] [Attack discovery] Fixes zero connectors and zero alerts empty states\r\n\r\n### Summary\r\n\r\nThis PR fixes usability issues in _Attack discovery_ by displaying an [Empty prompt](https://eui.elastic.co/#/display/empty-prompt) for the \"zero connectors\" and \"zero alerts\" states.\r\n\r\n- When there are zero connectors configured, the empty prompt in the following screenshot is displayed:\r\n\r\n\r\n\r\n- When there are zero open alerts in the last 24 hours to send to the LLM, the empty prompt in the following screenshot is displayed:\r\n\r\n\r\n\r\nThe fix for the \"no alerts\" state required returning an additional stat, the number of alerts sent as context to the LLM:\r\n\r\n```\r\nalertsContextCount\r\n```\r\n\r\nThe `alertsContextCount` stat is now included in telemetry.\r\n\r\n### Desk testing\r\n\r\nThe `Test setup` section describes how to reproduce the states necessary to desk test this PR in an existing environment.\r\n\r\nThe `Steps to verify` section updates the test environment from zero to one connector. The connector will then be used to test the zero alerts state.\r\n\r\n#### Test setup\r\n\r\nTesting this fix requires no alerts, and no connectors. This section describes how to reset an existing environment (both the deployment and the browser) to test these states.\r\n\r\n1. Navigate to Security > Alerts\r\n\r\n2. If there are alerts in the last 24 hours, create and login to a new space, because zero alerts are required.\r\n\r\n3. Navigate to Stack Management > Connectors\r\n\r\n4. Delete any `OpenAI` or `Bedrock` connectors (tagged with `Generative AI for Security`)\r\n\r\n5. Remove any pre-configured connectors from `kibana.dev.yml`\r\n\r\n6. Clear local storage (to remove any trace of previously selected connectors)\r\n\r\n7. Close all browser tabs with a current session to Kibana (to clear session storage)\r\n\r\n8. Restart Kibana server\r\n\r\n#### Steps to verify\r\n\r\n1. Navigate to Security > Alerts\r\n\r\n**Expected result**\r\n\r\n- There are zero open alerts in the last 24 hours\r\n\r\n2. Navigate to Security > Attack discovery\r\n\r\n**Expected result**\r\n\r\n- The following empty prompt is displayed:\r\n\r\n\r\n\r\n3. Click `OpenAI`\r\n\r\n**Expected result**\r\n\r\n- The OpenAI connector modal is displayed\r\n\r\n4. Enter the new connector details, and then click `Save`\r\n\r\n**Expected results**\r\n\r\n- A toast is displayed, confirming the new connector was successfully created\r\n- The newly-created connector is selected in the connector selector\r\n- The `Up to 20 alerts will be analyzed` empty state in the following screenshot is displayed:\r\n\r\n\r\n\r\n5. Click `Generate`\r\n\r\n**Expected result**\r\n\r\n- The `No alerts to analyze` empty state (for zero alerts sent as context to the LLM) is displayed:\r\n\r\n\r\n\r\n6. Generate some alerts\r\n\r\n7. Navigate to Security > Alerts\r\n\r\n**Expected result**\r\n\r\n- Alerts in the last 24 hours are now available (as shown by the Alerts page)\r\n\r\n8. Once again, navigate to Security > Attack discovery\r\n\r\n**Expected result**\r\n\r\n- The `Up to 20 alerts will be analyzed` empty state is displayed\r\n\r\n9. Once again, click `Generate`\r\n\r\n**Expected results**\r\n\r\n- The `Attack discovery in progress` loading callout is displayed\r\n- Attack discoveries are created for the alerts (when applicable)","sha":"6f4d423321d1834c6516a64086d24c21175da9a7"}}]}] BACKPORT-->
[Security Solution] [Attack discovery] Fixes zero connectors and zero alerts empty states
Summary
This PR fixes usability issues in Attack discovery by displaying an Empty prompt for the "zero connectors" and "zero alerts" states.
The fix for the "no alerts" state required returning an additional stat, the number of alerts sent as context to the LLM:
The
alertsContextCountstat is now included in telemetry.Desk testing
The
Test setupsection describes how to reproduce the states necessary to desk test this PR in an existing environment.The
Steps to verifysection updates the test environment from zero to one connector. The connector will then be used to test the zero alerts state.Test setup
Testing this fix requires no alerts, and no connectors. This section describes how to reset an existing environment (both the deployment and the browser) to test these states.
Navigate to Security > Alerts
If there are alerts in the last 24 hours, create and login to a new space, because zero alerts are required.
Navigate to Stack Management > Connectors
Delete any
OpenAIorBedrockconnectors (tagged withGenerative AI for Security)Remove any pre-configured connectors from
kibana.dev.ymlClear local storage (to remove any trace of previously selected connectors)
Close all browser tabs with a current session to Kibana (to clear session storage)
Restart Kibana server
Steps to verify
Expected result
Expected result
OpenAIExpected result
SaveExpected results
Up to 20 alerts will be analyzedempty state in the following screenshot is displayed:GenerateExpected result
No alerts to analyzeempty state (for zero alerts sent as context to the LLM) is displayed:Generate some alerts
Navigate to Security > Alerts
Expected result
Expected result
Up to 20 alerts will be analyzedempty state is displayedGenerateExpected results
Attack discovery in progressloading callout is displayed