| Latest Release |
|
| Examples |

|
| PyPI Downloads |
|
| License |

|
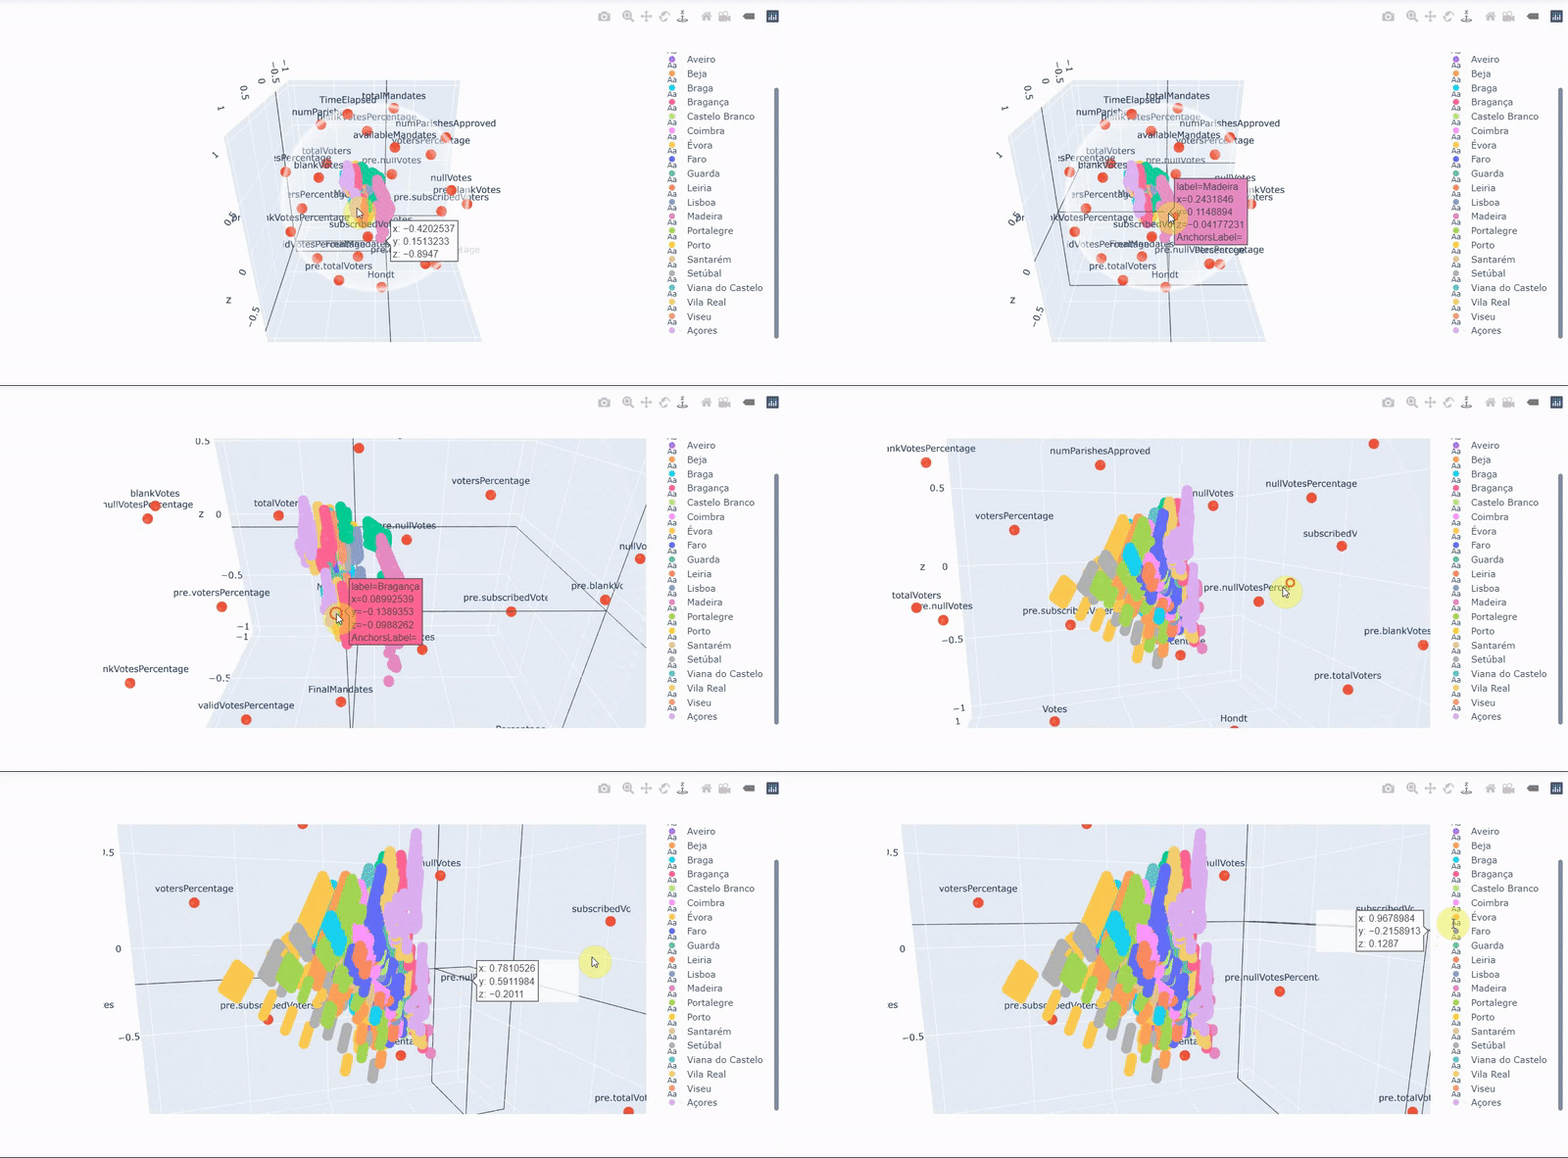
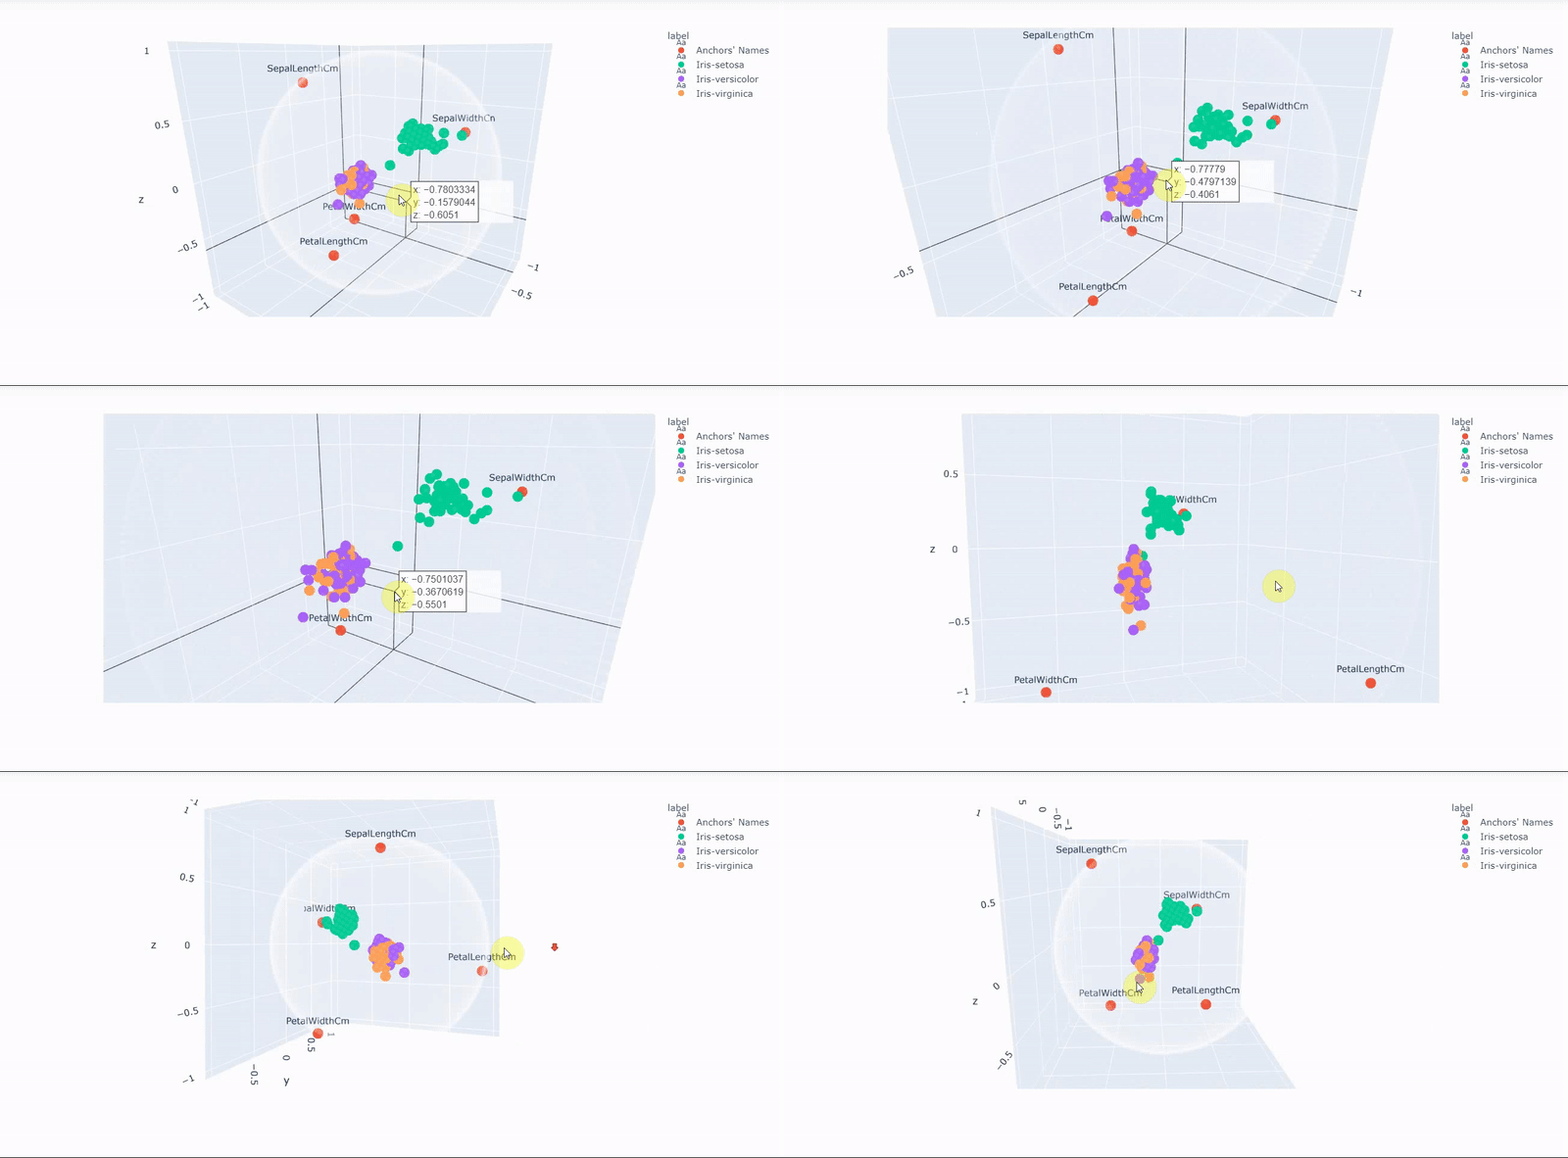
RadViz-Plotly is An Open-Source Python package that data scientists can use to draw the 2D, and 3D Radial Visualization (RadViz) plots for any high-dimensional datasets. Using the 3D/2D RadViz plot, we can have a broad vision for data distribution on all provided dimensions to understand the data and discover hidden insights. The Radviz-Plotly package has two functions, 2DRadViz that plots the 2D Radial visualization and 3DRadViz that plots Radial visualization, using the powerful interactive tools in Plotly library.
Try the RadViz-Plotly package without locally Installation
Follow these steps
1- Click this link here. It's a collection of interactive Jupyter notebooks that contains three folders. Each folder contains Dataset and a Jupyter file that use RadViz-Plotly.
Hint: sometimes this link takes a long time to open as jupyter's environment.
2- After the jupyter environment comes out, open Car Evaluation Dataset, Election Dataset, or Iris Dataset folder.
3- Open file with extension .ipynb (the jupyter file)
4- After the jypyter file loading, from the cell list on the toolbar click Run All
Hints:
A- At the first running time, it takes time to install the dependences.
B- This is an interactive RadViz package where you can make zoom, fillter lables, and rotate the 3D graph
C- This packge depends on the plotly.py packge
1- Install RadViz Plotly using this command
pip install RadViz-Plotly
2- Download examples repository using this command
git clone https://github.com/elewah/RadViz-Plotly-Examples.git
or Download by clicking here
3- Run these examples using jupyter labs to understand how to use RadViz-Plotly package
RadViz-Plotly is An Open-Source Python package that data scientists can use to draw the 2D, and 3D Radial Visualization (RadViz) plots for any high-dimensional datasets. Using the 3D/2D RadViz plot, we can have a broad vision for data distribution on all provided dimensions to understand the data and discover hidden insights. The Radviz-Plotly package has two functions, 2DRadViz that plots the 2D Radial visualization and 3DRadViz that plots Radial visualization, using the powerful interactive tools in Plotly library. The RadViz-Plotly package has two functions, 2DRadViz for plotting the 2D Radial visualization, and 3DRadViz for drawing the 3D Radial visualization, using the powerful interactive tools in the Plotly library. A research group on the IoT lab at Ontario tech university developed it.
Kindly cite this paper in your research if it helps your work.
A. Elewah, A. A. Badawi, H. Khalil, S. Rahnamayan and K. Elgazzar, "3D-RadViz: Three Dimensional Radial Visualization for Large-Scale Data Visualization," 2021 IEEE Congress on Evolutionary Computation (CEC), 2021, pp. 1037-1046, doi: 10.1109/CEC45853.2021.9504983.
Email: abdelrahman.elewah@ontariotechu.ca
Code released under the MIT license.


