Object inspect pane collapse button hidden in some tabs #434
Comments
|
I am experiencing the same on Ember Inspector 1.8.3 and Chrome 44.0.2403.125. To close panel at the moment, I would need to go to the Data or Container tabs before being able to see the button, then would click it from there. |
|
Yes it's probably a styling issue. Will look into it. |
Sign up for free
to join this conversation on GitHub.
Already have an account?
Sign in to comment
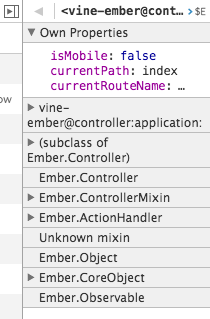
Most of the time (especially <1.8) the object inspect pane had a collapse button ( ) just to the top left of it . It seems to be showing up sporadically now (and often not at all) resulting in the pane being stuck open with no way to close it.
Expected:
Actual:
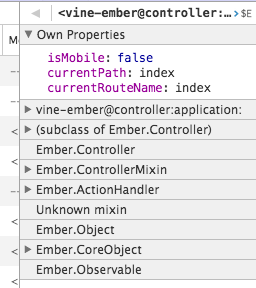
I suspect it's probably just a styling issue (the button is obscured) as the button will appear/disappear depending on which Ember Inspector tab you're on. A quick check:
Using Ember Inspector 1.8.3 in Chrome 44.0.2403.107 (64-bit), though have seen it in other Chrome installations at different versions.
The text was updated successfully, but these errors were encountered: