A pluggable interactive visualization runtime environment and configuration editor.
Try it out! Edit the configuration by clicking on numbers and colors in the text on the left, or try clicking and dragging the diagonal lines in the boxes.
Installable via Bower:
bower install vis-editor
The core concept of this project is that visualizations can be instantiated, configured with data, arranged on the screen, and coupled together to produce linked views. A JSON configuration structure defines the entire state of an application. The configuration refers to plugins by name, which are loaded at runtime and called upon to instantiate instances of visualizations and other components. Configuration changes can be made at runtime using an interactive JSON editor. The JSON configuration also updates in response to user interactions with visualizations.
This system is intented to be embedded within larger Web applications to address interactive visualization needs. The JSON configuration can serve as the primary integration point. For example, the configuration could be automatically generated based on available data or user configurations. The configuration can also support collaboration, in that it can be stored to disk and restored at a later date (potentially by a user other than the original author).
Long term goals also include undo/redo support and real-time collaboration between many users.
A configuration is a JSON object encapsulating an application state. This configuration contains specifications for a set of runtime components, each of which has:
- a unique name (called the "alias" of the component),
- an associated plugin that creates the runtime component, and
- a key-value dictionary specifying the state of the runtime component.
The configuration structure can be summarized as follows.
{
  alias -> {
    plugin: string,
    state: { property -> value }
  }
}
The runtime environment is responsible for synchronizing the JSON configuration with the running application. The runtime environment loads plugins referred to in the configuration using RequireJS. Each plugin is an AMD module that provides functionality to
- create a runtime component,
- manipulate the state of the component,
- listen for changes that occur within the component, and
- destroy the component.
This organization allows a dynamic configuration structure to drive the state of the application, and also allows changes resulting from user interactions with runtime components to be propagated to the configuration.
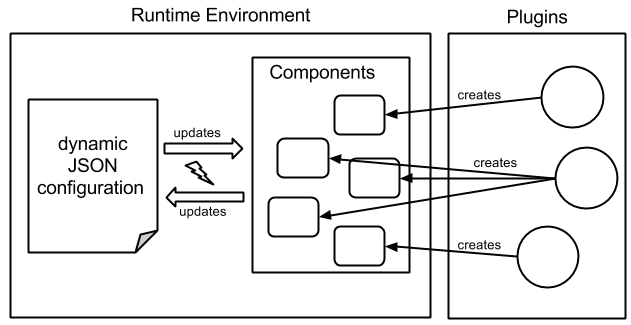
This diagram illustrates that
- Plugins create runtime components.
- Changes in configuration propagate to runtime components.
- Changes in runtime components propagate back to the configuration.
See also
- runtime module Documents exact configuration structure.
- runtime module unit tests Contains simple example plugins.
Status: partially implemented.
Since the architecture for this visualization editor is based on plugins, several foundational pieces are implemented as plugins.
The layout module provides tiled visualization containers using a nested box layout, computed by the computeLayout module.
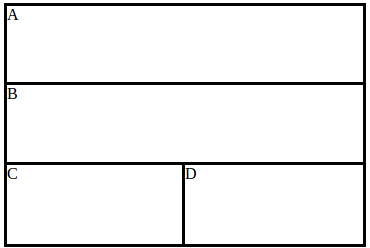
The above image is a simple example of a nested box layout, which can be configured by the following JSON structure.
{
  "orientation": "vertical",
  "children": [
    "A",
    "B",
    {
      "orientation": "horizontal",
      "children": [
        "C",
        "D"
      ]
    }
  ]
}
The following features are also present:
- Specifying relative (proportions to siblings) or absolute (fixed number of pixels) size of any node in the layout tree. Relative size makes sense for resizable visualizations, while absolute size makes sense for conventional UI widgets that only look good at a specific size in terms of pixels.
- Toggling visibility of components. When a component is marked as "hidden", it is excluded from the layout algorithm. This could be used to, for example, hide and show the JSON configuration editor when the user clicks on a "settings" button.
Status: implemented.
- computeLayout module This implements the nested box layout algorithm.
- computeLayout module unit tests
- layout plugin This provides the interface between the runtime and nested box layout algorithm.
- layout plugin unit tests
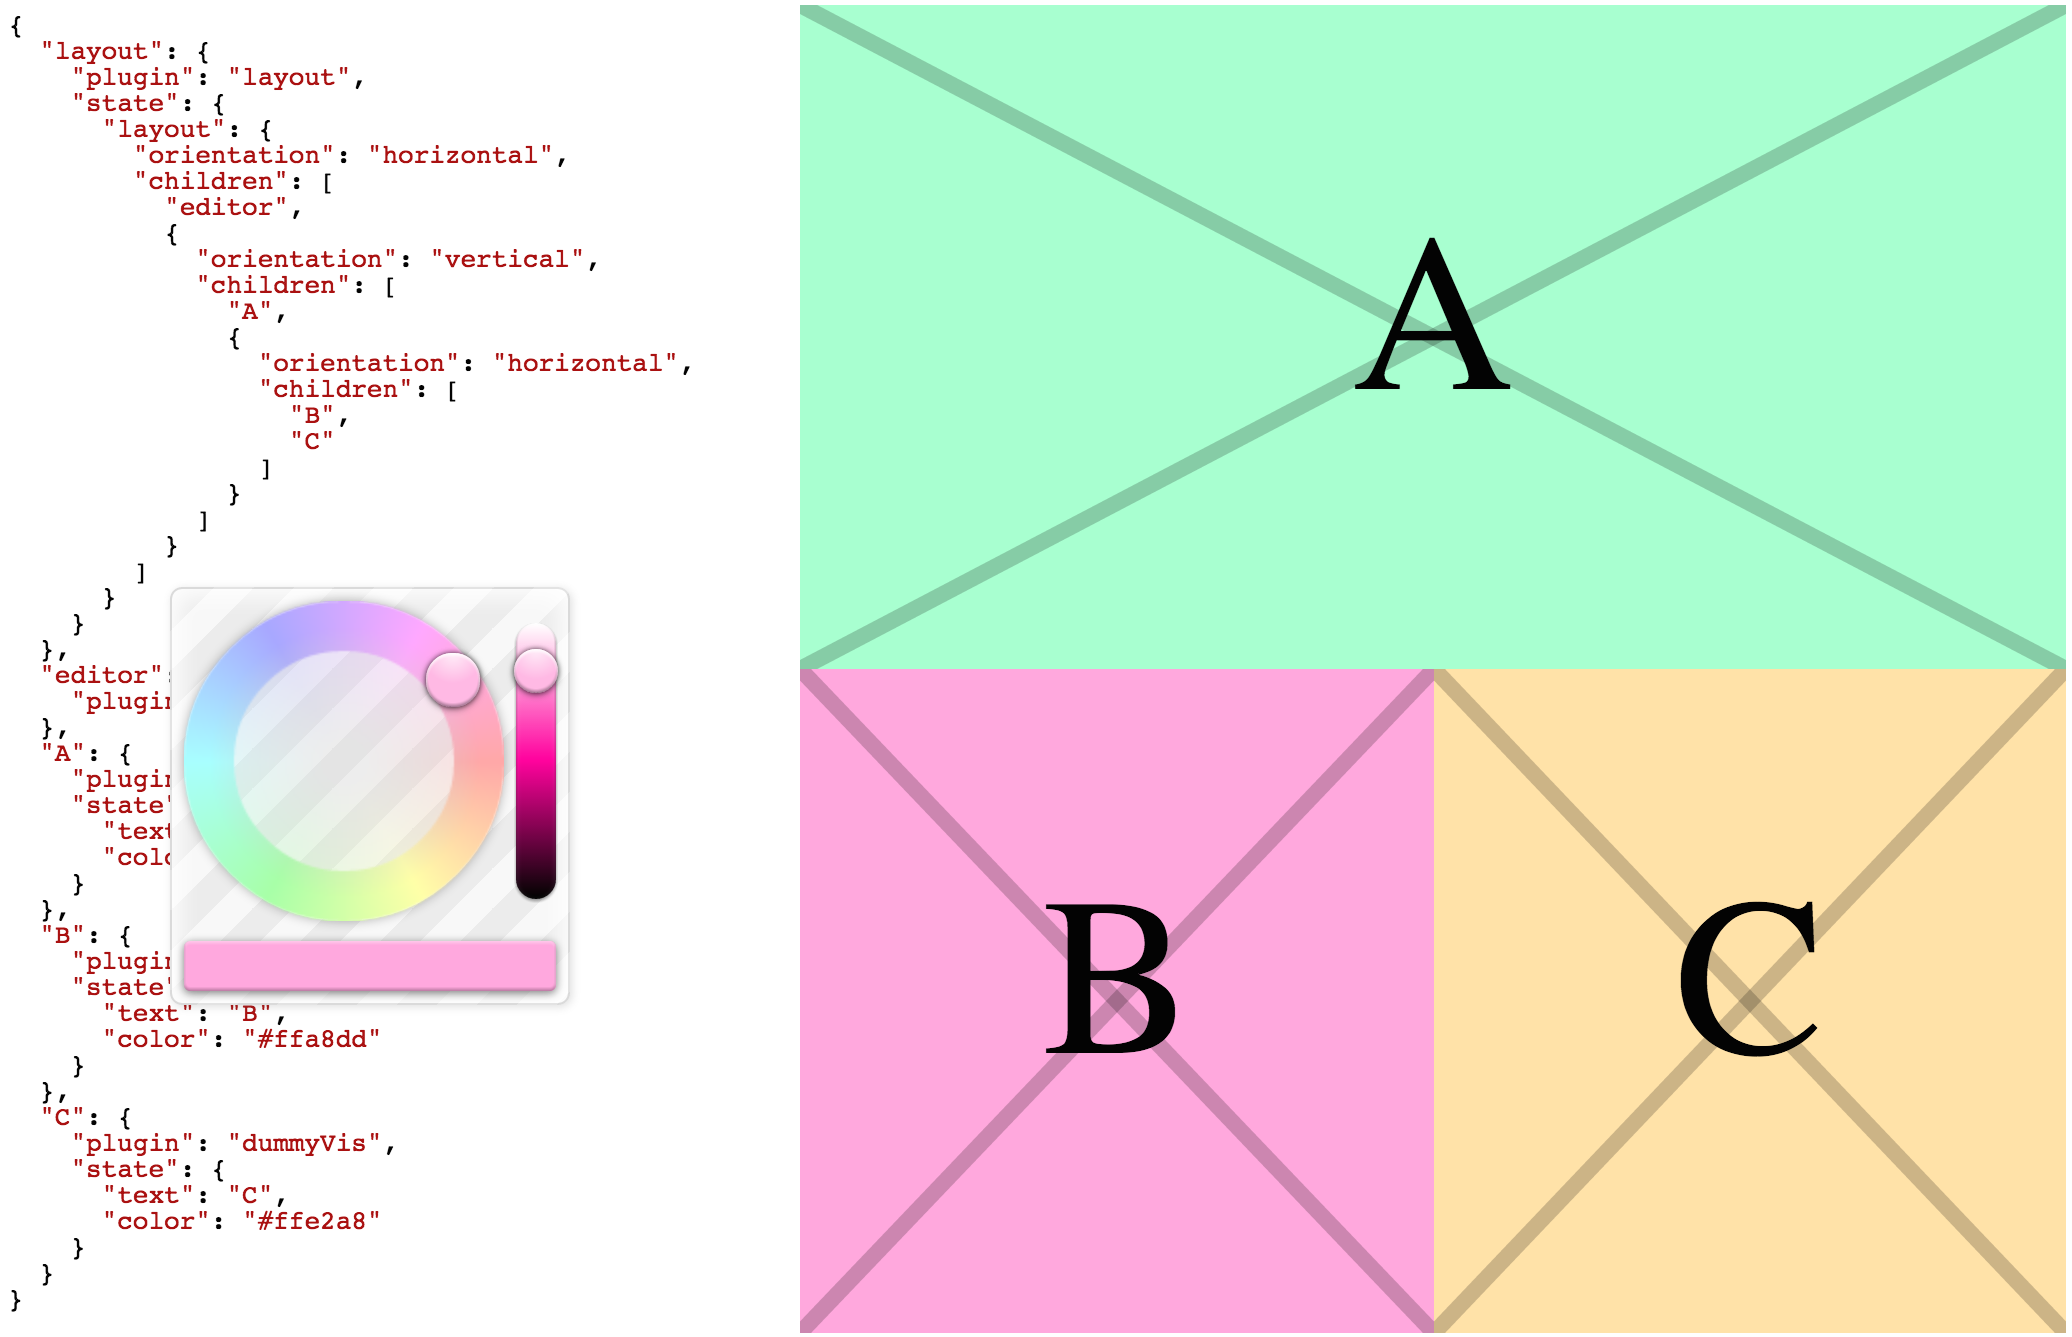
The JSON Editor is an enhanced text editor for editing the configuration at runtime. Changes are propagated through the runtime environment to the instantiated plugins. When changes are made, only the differences are propagated through the system. This lays the foundation for undo/redo and real-time synchronization between many clients.
Status: implemented, leveraging CodeMirror and Inlet.
The DummyVis plugin is a simple example that demonstrates basic plugin structure and functionality. This plugin serves as a placeholder for real visualizations.

Features include:
- A colored background
- Clicking on the background changes the color.
- A colored X that resizes to the plugin container
- Clicking and dragging the X changes its size.
- Clicking and dragging also sets the
loadingproperty for one second, to simulate asynchronous operations that may fetch data from a server.
- Text in front of the X.
- A progress indicator when a special property
pendingis set.
Status: implemented.
The Links plugin is for establishing bindings between runtime components. By specifying a link using the Links plugin in a configuration, the output resulting from a user interaction in one view can be used as input to another view. This is the foundation for linked views.
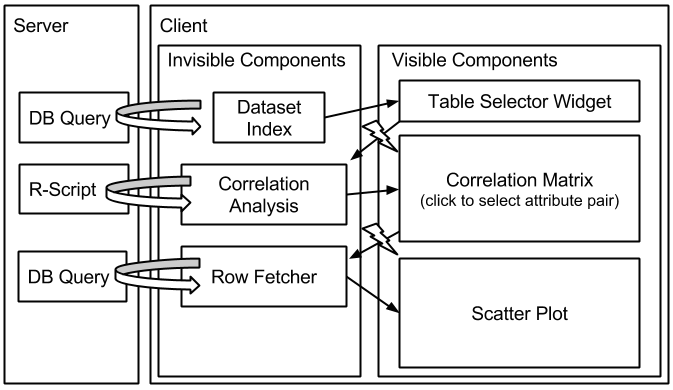
Plugins may be created for components that make requests to a server. The inputs and outputs of such components may also be bound to visualizations in order to establish linked views with an asynchronous step that leverages server-side capabilities.
Status: Prototype implemented in Ph. D. prototype, yet to be ported into visEditor.
Targets for implementation as plugins include the following visualizations:
- Bar Chart
- Scatter Plot
- Table
- Crossfilter
- Line Chart
- Parallel Coordinates
- Stacked Area Chart[https://github.com/curran/model/tree/gh-pages/examples/d3StackedArea]
- Choropleth Map (using Leaflet)
- Calendar View
The following features common to many D3-based visualizations can reside in a separate module (prototyped in the Reactivis project):
- Margins
- Scales (X, Y, color)
- Axes
- Color Legend
- Brushing (draw a rectangle to select many records)
- Selecting (click/tap to select a single value)
- Hovering
Status: Several visualizations have been implemented using ModelJS in model-contrib and as examples in the ModelJS project. All of these are yet to be ported into the VisEditor project.
To demonstrate all essential features of the visualization editor, a proof of concept system could be devised that integrates with an analytics backend that allows exploration of a set of data tables using linked views.