Custom charts for nvd3.
By Enplore (https://github.com/enplore/nvd3-charts.git).
Current version checked OK with nvd3 1.8.4 and d3 3.5.17.
Download the scripts and include them after including d3 and nvd3 scripts. To use, just use nv.models.xxx as per below.
The repo is not published on npmjs, however you can still install it with npm from github:
npm install --save github:enplore/nvd3-charts
Then import 'nvd3-charts/gaugeChart'; after importing d3 and nvd3 packages. To use, just use nv.models.xxx as per below.
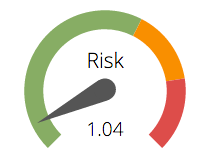
Simple gauge, wants a single value as data. Use CSS widths to adjust size (not responsive).
Live demo: http://codepen.io/anon/pen/OXprXo
nv.addGraph(function() {
    var chart = nv.models.gaugeChart()
        .title('Gauge')
        .min(0)
        .max(1)
        .zoneLimit1(0.25)
        .zoneLimit2(0.75);

    d3.select('#gauge-chart svg')
        .datum([Math.random()])
        .call(chart);

    nv.utils.windowResize(chart.update);
    return chart;
});
Based on http://bl.ocks.org/mbostock/4063269. Accepts a similar data structure (see demo for exact structure). Responsive. Will reveal child node when clicked.
Live demo: http://codepen.io/anon/pen/yJMGVB
nv.addGraph(function() {
    var chart = nv.models.packedBubbleChart()
        .title('Bubbles')
        .valueFormat(function(d) { return d.index.toFixed(2); })
        .color(d3.scale.linear()
              .domain([0, 0.25, 0.5])
              .range(['#88ac67', "#f78f20", "#db4e4e"]));

    d3.select('#bubble-chart svg')
        .datum(bubbleData)
        .call(chart);

    nv.utils.windowResize(chart.update);
    return chart;
});
Based on http://bl.ocks.org/nbremer/6506614. Accepts a similar data structure (see demo for exact structure). Nodes are linked if the data point's "link" property is set.
Live demo: http://codepen.io/anon/pen/GqWPyX
nv.addGraph(function() {
    var chart = nv.models.radarChart()
        .valueFormat(function (d) { return d.toFixed(2); })
        .min(min)
        .max(max)
        .stepSize(tickStep)
        .margin({ top: 10 })
        .color(d3.scale.linear()
            .range(['#88ac67', "#f78f20", "#db4e4e"]));

    d3.select('#radar-chart svg')
        .datum(radarData)
        .call(chart);

    nv.utils.windowResize(chart.update);
    return chart;
});