Full scan least request LB alg: would it provide better performance in some cases? #4481
Comments
|
@markvincze thanks for the thorough analysis here. Sorry if I missed this, but can you comment on how many servers you have as upstreams? I'd think that P2C, like any statistical algorithm, would be better at large numbers and that a full scan would be better with a small number of upstreams. Do you see a discrepancy if you run the above experiments with a large number of upstreams (e.g. 50)? |
|
Hi @htuch, This benchmark was done with 20 instances. |
|
FWIW, I think having a full scan algorithm in certain cases like yours (long lived/expensive requests) make sense. These are cases where the probablistic P2C algorithm will not do well. I would point out that there is also an option to have an option to switch P2C to PNC (meaning allow the user to specify N for > 2 choices). This might provide most of the benefit without a full scan. |
|
I did the same benchmark with 60 API pods instead of 20. (I increased the benchmark request rate also accordingly.)
|


|
@markvincze yeah, I think either adding a PNC or full scan variant of P2C seems the way to go. The fact that the problem doesn't become better as you scale up the hosts seems surprising to me, presumably at some sufficiently high number of hosts the two would converge or we have some bug? |
|
I think you need a large number of requests per host to have it even out, so a smaller number of hosts would probably show more even results. |
|
I'd be surprised if this was a bug. My intuition was to expect results like this, although this is a pretty specific scenario, because
What could also make my benchmark results this extreme is that the 60 pods I'm testing with are all 1-core instances. So as soon as a node is processing not 1, but 2 requests in parallel, then its response time degrades almost twofold. Which I think can quickly start a "chain reaction" and slow the whole cluster down. I dont think in a real life API (where we rarely have 100% pure CPU intensive requests like this) we would get this extreme improvement with full scan. |
|
Yes, the fact that your backends are basically only capable of effectively handling a single request at full capacity and are CPU bound would lend itself to being more problematic. It seems totally reasonable to do full-scan as an alternative LB for least-loaded. |
|
I'm a bit late here, but it makes total sense that at 8 requests per second at the experiments peak, the overhead of a full scan would be trivial for 60 instances given the timescale for which each request is running. Have you tested the results of Matt's suggestion of using more than 2 choices on your benchmark? |
|
This issue has been automatically marked as stale because it has not had activity in the last 30 days. It will be closed in the next 7 days unless it is tagged "help wanted" or other activity occurs. Thank you for your contributions. |
|
This issue has been automatically closed because it has not had activity in the last 37 days. If this issue is still valid, please ping a maintainer and ask them to label it as "help wanted". Thank you for your contributions. |
Full scan least request LB algorithm
I've been using Envoy as a proxy/load balancer in front of an API with the following characteristics:
Because the requests are CPU intensive, it's good to evenly distribute the load across the servers, because if we're processing many requests in parallel on one machine, the performance degrades, with the CPU being the bottleneck.
Earlier I was using a simple Kubernetes load balancer (with an underlying Google Cloud load balancer), which only provided a round robin algorithm, so I switched to Envoy to be able to use Least Request, to better distribute the load across the servers.
Introducing Envoy and switching from
ROUND_ROBINtoLEAST_REQUESTindeed improved the perf (decreased the response times and made the CPU-load smoother across the machines).However, I still saw that the load was not close to even on the instances, often 1 machine was processing 0 requests, while another was doing 5.
I saw that the Least Request implemented by Envoy provides a P2C (power of two choices) implementation, and due to what I saw I started to doubt that the P2C algorithm is achieving the same uniform distribution as a full scan would.
So I decided to test this. I implemented a dummy API (I called it PrimeCalcApi) which has similar characteristics that I described above. One request is fully using 1 CPU core, and its response times vary approximately between 100ms and 5 seconds. (It's doing some fake CPU-intensive work, calculating primes. The source is here: https://github.com/markvincze/PrimeCalcApi/tree/master/src/PrimeCalcApi.WebService)
I deployed this to our Kubernetes cluster, with 20 instances.
Then I implented a very crude and naive Full Scan Least Request LB algorithm in Envoy (here is the PR in my fork: markvincze#1).
I deployed my fork of Envoy in front of this api cluster, with 1 single instance. (I was using
STRICT_DNSservice discovery with a Kubernetes headless service.)This is the full architecture.
Then I performed a load test in which I was continuously sending requests to this cluster through the Envoy LB. Initially 2 requests per second were sent, and I increased the rate of requests per second by 1, every 5 minutes. I was running the benchmark for 40 minutes, so at the end it was sending 8 requests per second. (The code of the benchmark is here: https://github.com/markvincze/PrimeCalcApi/tree/master/src/PrimeCalcApi.LoadTest)
(The API instances all have 1 CPU core, so as the request rate increases, once they start processing more than 1 request in parallel, their response time degrades as expected.)
I repeated this benchmark with
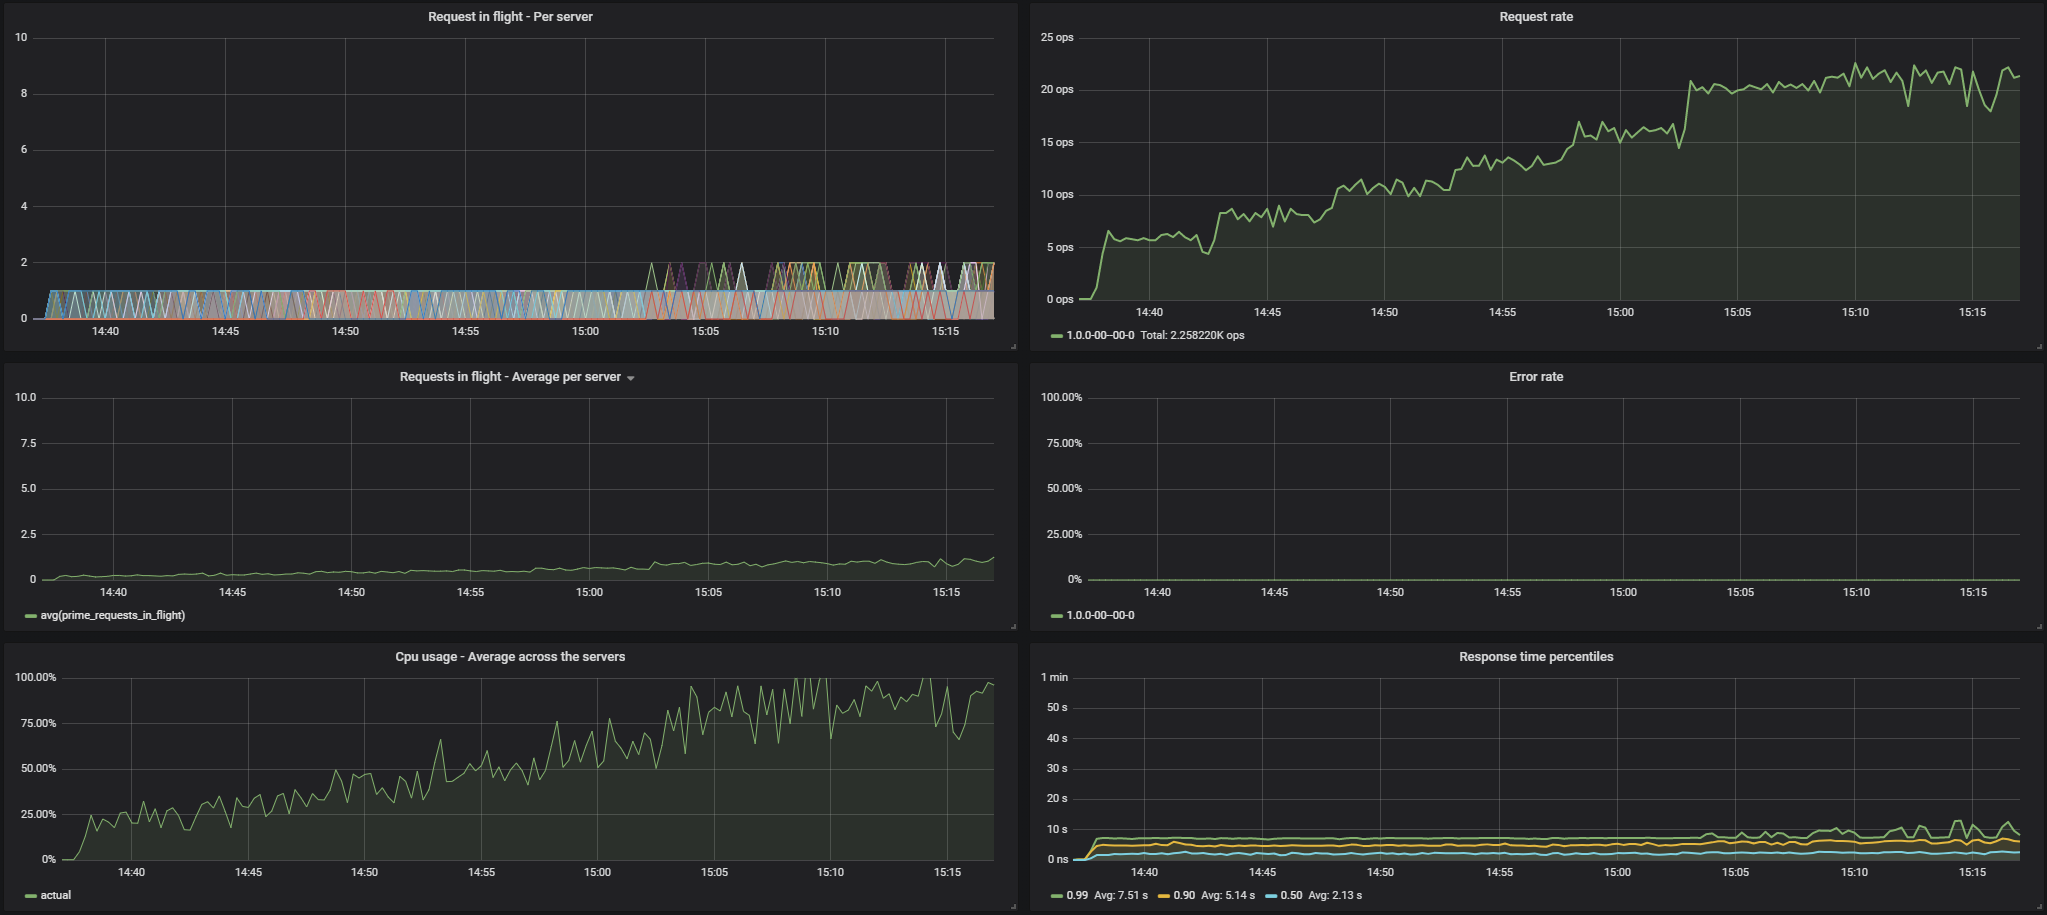
ROUND_ROBIN, thenLEAST_REQUEST, then (this is implemented in my fork)LEAST_REQUEST_FULL.Throughout the benchmark I collected the following metrics:
These were the results for
ROUND_ROBIN:Results for
LEAST_REQUEST:Results for
LEAST_REQUEST_FULL:You can see that the
LEAST_REQUESTwas significantly better thanROUND_ROBIN, but theLEAST_REQUEST_FULLbrought a very large improvement on top of that in terms of the even distribution of the load, and thus the response times.And here are two more images showing for the 3 different algorithms the distribution of the number of requests being executed, and the response time graphs separately.
My question is:
The text was updated successfully, but these errors were encountered: