Skip to content
New issue

Have a question about this project? Sign up for a free GitHub account to open an issue and contact its maintainers and the community.

By clicking “Sign up for GitHub”, you agree to our terms of service and privacy statement. We’ll occasionally send you account related emails.

Already on GitHub? Sign in to your account

Candlestick chart #81

Closed
ddovod opened this issue Jul 26, 2020 · 21 comments
Closed

Candlestick chart #81

ddovod opened this issue Jul 26, 2020 · 21 comments
Labels
plot type Requesting a plot type that isn't supported yet

Comments

@ddovod
Copy link

ddovod commented Jul 26, 2020

Hi. Thank you very much for such an amazing library!
Would you mind to implement a candlestick chart? It would be great to have a function with signature like

void PlotCandlestickChart(const char* label_id, const float* xs, const float* opens, const float* closes, const float* lows, const float* highs, int count, int offset, int stride)

I have a very basic implementation which looks like this
candles
The implementation is very straightforward and based on the error bars code, but I can share it here if you want.

Let me explain some problems I've faced here:

  1. As you can see, I use 2 colors for candles. The main problem is you cannot show a 2-colored marker in the legend box. I see 2 solutions here: either to support a multicolor markers in the legend, or use one color, but mark rising and falling candles with solid and hollow filling. I'm not sure what option is more suitable for implot.
  2. It would be great to be able to show a time on the X axis in some form.
  3. I'm not sure if this is a topic for implot, but it would be great to have some tools to show the candle parameters (OHLC values) when mouse is hovered or clicked the candle.

Please let me know if I can help somehow.
Thanks!

@ChiefyChief23
Copy link
Contributor

Firstly, that looks pretty good!

  1. Just more of a thought but I wonder if it would be possible to split the legend colour cube into two right angled triangles and render the two colours that are used within the plotting? This kind of limits it to two colours if kept with the square but just an initial suggestion?

  2. This is actually currently in the works by @Prinkesh and is under review. You can keep track of when this goes in from MR Feature/timestamp support rebase #55 or issue Addition of support to plot time along the x-axis #34. I've kind of jumped the gun a bit to implement it in my own code and as is it works great.

  3. As far as I'm aware, and correct me if I'm wrong @epezent, but the general outlook is because the library is relatively young any features, i.e. new forms of plots, together with actual use cases are welcome as they are likely to be used. Plus this base design could be used for other applications such as percentile box plots such as below. (I have no idea how candle sticks represent data as I have never delved into financial stuff, so if its what is shown below then my bad!)

image

@epezent
Copy link
Owner

epezent commented Jul 27, 2020

Hi @ddovod. Thanks for the suggestion! This is actually the first time I've heard of a candlestick plot. Your implementation looks quite good!

I'd rather avoid explicitly adding PlotCandlestickChart as it seems only related to trading/financial applications. My initial thought was that we could instead add PlotBoxPlot, but after a little investigation, the two would need completely different function signatures since you need explicit control over your box/whisker high and low values.

Now, I'm think we might could add a generic plotter such as:

PlotRects(const char* label_id, const float* xs, const float* ys, const float* widths, const float* heights, ... )

This might seem a little strange, but it would enable you to create your own PlotCandlestickChart, e.g.:

void PlotCandlestickChart(const char* label_id, const float* xs, const float* opens, const float* closes, const float* lows, const float* highs, int count, int offset, int stride) {
    PlotErrorBars(label_id, ...); // render your highs/lows
    PlotRects(label_id, ...);     // render your open/closes
    // these will appear as one series in the legend because they have the same label_id
}

This would also open up the possibility of supporting box plots and could even replace the underlying implementation for PlotBars too. Less code to maintain is good.

The tricky party is doing the two colors like you have. You could pre-sort the data and do two passes, such that you'd have a green rising and red falling entry in the legend. I know this is not ideal, but I don't see an easier path forward right now.

As @ChiefyChief23 said, time labels are being worked on. I've been dragging my feet merging @Prinkesh's PR, but hopefully I will get to it soon. Regarding hover, it's been requested for other plot types and ultimately I would like to provide a generic solution. It's not something I've had time to think about yet. It should be possible to do this outside of ImPlot's source yourself, using some of the built-in helper functions, though this would admittedly be a little cumbersome.

Let me know your thoughts.

@leeoniya
Copy link

leeoniya commented Jul 27, 2020

heh, i have a similar todo issue open in uPlot [0] to extract generic bar/box distribution, sizing & drawing logic so it can be re-used for ohlc/candlesticks [1], box/whisker plots [2], bars [3] and x-aligned heatmaps [4]. will be interesting to see what you guys end up with :)

my current thoughts are:

  • a helper fn which can distribute boxes horizontally with some configurable chart padding, minimum hz gap, and/or min/max box width.
  • a callback which allows dynamic styling per box (stroke style, fill style) based on its backing data
  • a way to define extra decorations for under the box layer (ohlc shadow, box vertical min/max line) and over the box layer (median bar, mean diamond, min/max cross-bars).

/highjack

[0] leeoniya/uPlot#184
[1] https://leeoniya.github.io/uPlot/demos/candlestick-ohlc.html
[2] https://leeoniya.github.io/uPlot/demos/box-whisker.html
[3] https://leeoniya.github.io/uPlot/demos/multi-bars.html
[4] https://leeoniya.github.io/uPlot/demos/latency-heatmap.html

@epezent
Copy link
Owner

epezent commented Jul 27, 2020

Thanks, Leon! I'll keep an eye on your progress as well.

@ddovod
Copy link
Author

ddovod commented Jul 27, 2020

Hi @ChiefyChief23

Just more of a thought but I wonder if it would be possible to split the legend colour cube into two right angled triangles and render the two colours that are used within the plotting? This kind of limits it to two colours if kept with the square but just an initial suggestion?

Yep, that's an option I'm thinking about, but it sounds limiting

Hi @epezent

I'd rather avoid explicitly adding PlotCandlestickChart as it seems only related to trading/financial applications. My initial thought was that we could instead add PlotBoxPlot, but after a little investigation, the two would need completely different function signatures since you need explicit control over your box/whisker high and low values.

It would be great if you come up with some generic solution, but please keep in mind that the visual appearance of the whiskers on error bars and shadows on candles are different enough to not use one code to draw them (note the T-shaped parts of the error bars and I-shaped parts of the candle chart). But, again, generic and probably customizable solution would be awesome to have

@ChiefyChief23
Copy link
Contributor

ChiefyChief23 commented Jul 27, 2020

@epezent For generic-ness in order to get the CandleSticks we could over lay PlotRects over a new function called PlotStems. Plot stems could just be a vertical line and the declaration could be something similar to

PlotStems(const char* label_id, const float* xs, const float* y_mins, const float* y_maxs, ... );

So this would effectively just draw a vertical line along a given x position between two y values. Which could also have a Horizontal version PlotStemsH so as well as being able to create CandleStick plots we could do plots similar to that below, thoughts?

image
image

@ddovod It is kind of limiting. After sleeping on it I kind of had an idea, have you ever seen the progress spinners within imgui? Well using that idea instead of showing different characters within a sequence what if it showed a sequence of colours? Then there is no limiting factor? So the legend as time goes by would switch to the colours used to render the given line??

@ddovod
Copy link
Author

ddovod commented Jul 27, 2020

I believe the legend indicator should be static.
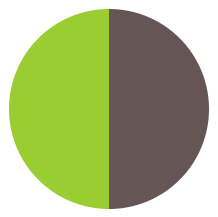
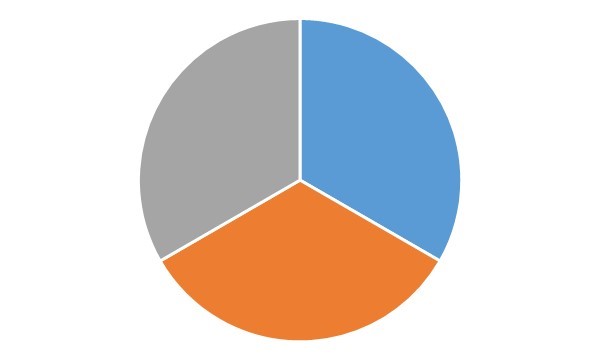
One more option is to use circle instead of rectangle and fill it like a pie chart with equal sized sectors for each color (sorry for layout)
one
two
three

@epezent
Copy link
Owner

epezent commented Jul 27, 2020

@ddovod , I had the same idea of using pie charts. The rendering code already exists for PlotPieChart, so it would be quite simple to implement. Even simpler would be to continue using a square, but subdivided it either horizontally or vertically for n colors. The only real complication is that each legend entry will have to have dynamic storage for colors instead of just one color. Not that big of a deal, but it would require a few changes under the hood.

Regarding the stems, PlotErrorBars can already plot vertical lines without the horizontal whisker by pushing 0 for ImPlotStyleVar_ErrorBarSize (see slider in Error Bars demo). We could also introduce PlotSegments, similar to PlotRects to handle this pattern of discontinuous line segments.

Actually, now that I look back at the Error Bars demo, it seems that you could in fact accomplish Candlesticks with the current API using only PlotErrorBars:

void PlotCandlestickChart(const char* label_id, const float* xs, const float* opens, const float* closes, const float* lows, const float* highs, int count, int offset, int stride) {
    PushStyleVar(ImPlotStyleVar_ErrorBarSize,0);    // no whiskers
    PushStyleVar(ImPlotStyleVar_ErrorBarWeight,1);  // thin error bar for high/low
    PlotErrorBars(label_id, ...);                   // render your highs/lows
    PushStyleVar(ImPlotStyleVar_ErrorBarWeight,10); // thick error bar for open/close
    PlotErrorBars(label_id, ...);                   // render your open/closes
    PopStyleVar(3);
}

@epezent
Copy link
Owner

epezent commented Jul 27, 2020

@ddovod, could you provide a test data set that I could play around with. Preferably formatted as float arrays that can be passed to the prototype function signature above.

@leeoniya
Copy link

@epezent you can pull some OHLC data from my demo:

https://github.com/leeoniya/uPlot/blob/a80c61962ca4f462a28880122bd94bf58831f7cc/demos/candlestick-ohlc.html#L240-L248

i had to fake/random the volume bars since i could not find any reliable free source for daily gold volume.

@ddovod
Copy link
Author

ddovod commented Jul 28, 2020

@epezent Sounds good, both subdivided rectangles and drawing candlesticks using error bars. I would like to have a separate function for candlesticks just for convenience to not force everybody make one in their code, this type of chart is widely used.

@epezent
Copy link
Owner

epezent commented Jul 29, 2020

@ddovod , I'll definitely consider it. This at least has me thinking about how we can extract common rendering patterns and expose those for users to implement their own custom plotters.

@epezent epezent added the plot type Requesting a plot type that isn't supported yet label Aug 17, 2020
@epezent
Copy link
Owner

epezent commented Aug 18, 2020

@ddovod , I haven't decided whether or not candlesticks belong in the public API yet (I'm leaning toward no), but I did want you to know that I've added an example of creating a custom PlotCandlestick to the demo. This afforded by the recent refactors that expose some of ImPlot's guts in implot_internal.h. You can take a peek inside of this file to see what else is available, and further extend the demo example to suit your needs. Moving forward I hope to improve the API in implot_internal.h, and possibly move some of it to the public API in implot.h.

The two-tone legend icon still isn't resolved, and I'm still dragging on incorporating time formatted axes, but hopefully this is a step in the right direction. Let me know your thoughts.

image

@epezent
Copy link
Owner

epezent commented Aug 19, 2020

@ddovod , for fun I added an example of custom tooltips to the demo:

candletool

@ddovod
Copy link
Author

ddovod commented Aug 19, 2020

@epezent Wow, looks great! Thanks a lot, I'll definitely take a look

@coolxv
Copy link

coolxv commented Aug 20, 2020

This site is worth checking out
https://echarts.apache.org/examples/en/index.html#chart-type-candlestick

image

@epezent epezent closed this as completed Aug 28, 2020
@epezent
Copy link
Owner

epezent commented Sep 6, 2020

You stock guys may be interested to know that ImPlot now supports time formatted x-axes:

@jahnf
Copy link

jahnf commented Mar 29, 2022

Sorry for posting here in this closed issue, but it seems to be the best fit instead of opening a new issue.

(and first of all: thank you for the amazing library, just discovered it a week ago)

For testing purposes I loaded a local CSV file with EURUSD M1 data.
With M1 data (one OHLC data point / minute) the data gaps (over the weekend) are especially visible:

Is there any way to "just" skip the data gaps?

data_gaps_implot

@sweihub
Copy link

sweihub commented Sep 16, 2022

Hey, I am playing with the candlestick, how can I remove the big grid lines?

The ImPlotAxisFlags_NoGridLines flag will remove all grid lines, I just don't want the big grid lines, but keep the background small grid lines. Can anyone point it out? Thanks!

image

@ArturSztuc
Copy link

Sorry for posting here in this closed issue, but it seems to be the best fit instead of opening a new issue.

(and first of all: thank you for the amazing library, just discovered it a week ago)

For testing purposes I loaded a local CSV file with EURUSD M1 data. With M1 data (one OHLC data point / minute) the data gaps (over the weekend) are especially visible:

Is there any way to "just" skip the data gaps?

@jahnf I know it's been over a year since this question, but did you find a solution? I have the exact same issue.

@spliffli
Copy link

spliffli commented May 6, 2024

@ddovod @epezent Sorry if this has already been answered, but how can I use this implementation of a candlestick chart with imgui? To be more specific, I plan on using a C# .NET wrapper around imgui called ImGui.NET.

I find it unclear from reading whether or not candlestick charts are natively supported by implot, or if it's necessary to modify the implot code to achieve that.

It would be nice to have both candlestick and line charts for representing price data for trading, whether it's stocks, crypto, forex or futures

Sign up for free to join this conversation on GitHub. Already have an account? Sign in to comment
Labels
plot type Requesting a plot type that isn't supported yet
Projects
None yet
Development

No branches or pull requests

9 participants