You signed in with another tab or window. Reload to refresh your session.You signed out in another tab or window. Reload to refresh your session.You switched accounts on another tab or window. Reload to refresh your session.Dismiss alert
What is this feature?
There are a lot of really great things that I've been looking for in a react plotting library (shoutout to brushes and event charts !!)
A useful feature would be heatmaps that show multivariate time series where each variable is a row and a variable's magnitude is denoted through color.
How should the feature work?
It should take in a 2d array and draw an even (or maybe uneven could be a good option too) grid of rectangles where the color is attached to some value scale.
The two features that I'm not sure that react-ts-charts has are
a categorical axis (for example, if you have 5 sensors, and you want to show their uptime coverage over time, displaying each sensor as a row), and
color scales + a color bar
Do you have examples or an idea of how it can be implemented?
Here's a d3 example which shows a basic way of making a heatmap. I'm sure it won't be much different with react+svg https://www.d3-graph-gallery.com/graph/heatmap_basic.html
Additional context
(Add any other context or screenshots about the feature request here)
I'm mostly interested in the first and third plots which are the easiest to deal with
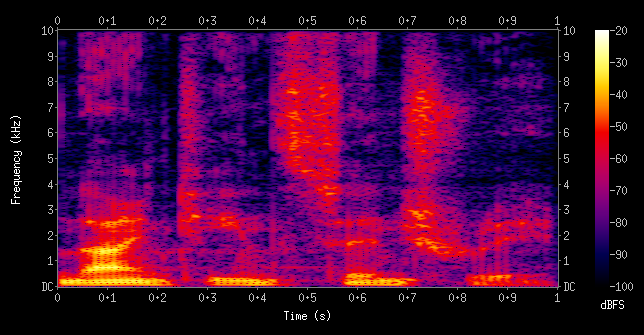
Spectrogram reference
Here's an example of an audio spectrogram. The y axis has a linear scale
Categorical heatmap reference
Here's an example with a categorical scale
The principal is the same, but they differ in labeling
Update: they are also called lasagna plots
The text was updated successfully, but these errors were encountered:
beasteers
changed the title
Add heatmaps (spectrogram not geo)
Add heatmaps/lasagna plots
Oct 22, 2019
🌈Feature request
What is this feature?
There are a lot of really great things that I've been looking for in a react plotting library (shoutout to brushes and event charts !!)
A useful feature would be heatmaps that show multivariate time series where each variable is a row and a variable's magnitude is denoted through color.
How should the feature work?
It should take in a 2d array and draw an even (or maybe uneven could be a good option too) grid of rectangles where the color is attached to some value scale.
The two features that I'm not sure that react-ts-charts has are
Do you have examples or an idea of how it can be implemented?
Here's a d3 example which shows a basic way of making a heatmap. I'm sure it won't be much different with react+svg
https://www.d3-graph-gallery.com/graph/heatmap_basic.html
Additional context
(Add any other context or screenshots about the feature request here)
I'm mostly interested in the first and third plots which are the easiest to deal with
Spectrogram reference
Here's an example of an audio spectrogram. The y axis has a linear scale
Categorical heatmap reference
Here's an example with a categorical scale

The principal is the same, but they differ in labeling
Update: they are also called lasagna plots
The text was updated successfully, but these errors were encountered: